| This Week’s a.i. Stock Spotlight is APPLE ($AAPL) |
Apple is making waves again, riding high on the artificial intelligence trend that big tech has been embracing for the past year. In just three months, Apple shares have surged over 34%, and the latest boost came after their annual Worldwide Developers Conference. There, they unveiled Apple Intelligence, a cutting-edge A.I. software set to launch this fall. The market responded with enthusiasm, pushing the stock over $207, with a robust 7% gain.
CEO Tim Cook, in his typically understated manner, highlighted that Apple has been leveraging A.I. and machine learning for years. Now, with Apple Intelligence, they’re set to redefine the landscape with a product that’s powerful, intuitive, integrated, personal, and crucially, private. Privacy, folks, is a massive selling point in a world where Big Tech is constantly tracking our every move.
Investors are clearly excited. Why? Because Apple Intelligence will only be available on the latest Apple devices, like the iPhone 15 Pro and Pro Max, and newer Macs and iPads with M1 chips. This exclusivity is poised to spark a wave of upgrades from Apple’s loyal user base. Remember, the iPhone alone accounts for over half of Apple’s annual revenue. A boost in iPhone sales translates to a significant lift in Apple’s bottom line.
Analysts are buzzing, predicting a surge in iPhone sales, especially with the new iPhone launch on the horizon. But let’s not ignore the elephant in the room—Apple’s stock is trading at over 32 times earnings, a premium that already factors in a lot of optimism.
So, where does that leave us?
Let’s dig deeper because there are some fundamental concerns about Apple’s ($AAPL) growth. Since September 2018, Apple stock is up 280%, while revenue has only grown 44%. The multiples—price to sales and price to earnings—have driven this growth. But to see the stock price increase 7x faster over revenue makes even the most evangelical Apple enthusiast a bit cautious.
Investors should be asking not if Apple is strong or will continue to generate cash flow, but can it grow? With a P/E multiple over 32, implying a lot of expected growth, the earnings yield is about 3%. You can get 5% in Treasuries today. So, what’s going on with Apple? It seems the stock keeps rising because there is no bad news in the headlines.
Recently, A.I. has been the buzz. Apple looks well-positioned in A.I., but will it boost revenue? Maybe, maybe not. The new iPhones might be more expensive to make, which could hit margins. These are costly additions that investors might not be considering.
Looking at Apple’s revenue, the compound annual growth rate since September 2018 is just 6.8%. Revenue has been declining since September 2022. The trend shows a bit of growth during the pandemic, but now it’s on the decline.
For the iPhone, the compound annual growth rate since 2018 is 3.5% , with a dip during the pandemic followed by a spike from stimulus checks, then a decline again in 2023 and early 2024. Mac and iPad sales followed similar patterns, with growth in 2021 and 2022, then a decline. The iPhone business is declining as the stock rises.
Two segments have shown growth: wearables, with products like the Apple Watch and AirPods, which saw momentum through 2022 but have slowed. The only consistently growing segment is Services, driven by the 30% cut from app purchases and a significant check from Google for being the default search engine on Safari.
But A.I. on Apple devices could mean fewer searches, leading to less Services Revenue. The only growth segment might shrink if Apple’s A.I. is successful.
This raises questions about Apple’s valuation. The P/E multiple is 33.5, and the price-to-sales is 8.5, both significantly higher over the past decade. Apple has earned this due to its dominant market position, but at these multiples, with slower growth, is Apple still a good value?
The stock is expensive, and it’s hard to see Apple living up to this valuation. Investors should consider if the current price is justified given the lack of growth. Traders on the other hand are simply riding the short-term trend.
Apple has had issues with product launches like the Apple Watch and the Vision Pro. Developers are hesitant to build for these products due to Apple’s 30% cut. This dependence on high margins from Services could be problematic long-term.
As Apple leans heavily into Services Revenue and A.I., investors and analysts question if the company is worth its current multiple. Apple is strategically well-positioned, but from a revenue perspective, it faces significant challenges.
In this weekly stock study, we will look at and analyze the following indicators and metrics as are our guidelines which dictate our behavior in deciding whether to buy, sell, or stand aside on a particular stock.
- Wall Street Analysts’ Estimates
- 52-week high and low boundaries
- Best Case – Worst Case Analysis
- Vantagepoint A.I. Forecast (Predictive Blue Line)
- Neural Network Forecast
- Daily Range Forecast
- Intermarket Analysis
- Our Suggestion
We don’t base our decisions on things like earnings or fundamental cash flow valuations. However, we do look at them to better understand the financial landscape that a company is operating under.
Wall Street Analysts Forecasts
When we evaluate a stock, the first thing we look at is the opinions of the professionals who live and breathe the market. We get this crucial information by checking out what top Wall Street analysts have to say about $AAPL. These expert opinions set the stage for understanding whether a stock is expensive, fairly valued, or cheap.
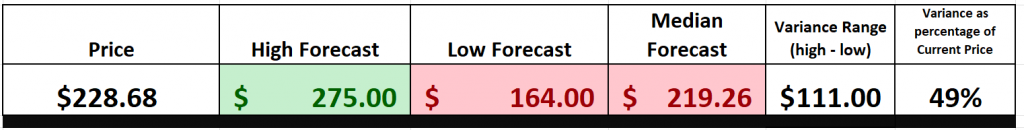
Looking at the latest data from 31 Wall Street analysts over the past three months, the median price target for Apple is $219.26. On the high end, some analysts are forecasting a rise to $275.00, while the more cautious among them see a drop to $164.00 . So, what does this mean for us? Well, it suggests that $AAPL is currently fairly valued, but with room for growth—up to another 21% according to the optimists. Meanwhile, the most bearish analysts are predicting a potential 39% decline.
This wide range of opinions on such a heavily followed stock is what fuels the volatility we often see in Apple’s share price. We always pay very close attention to the variance between the most bullish and bearish forecasts as that often places a cap on the medium-term rallies and declines in the market.
52-Week High and Low Boundaries
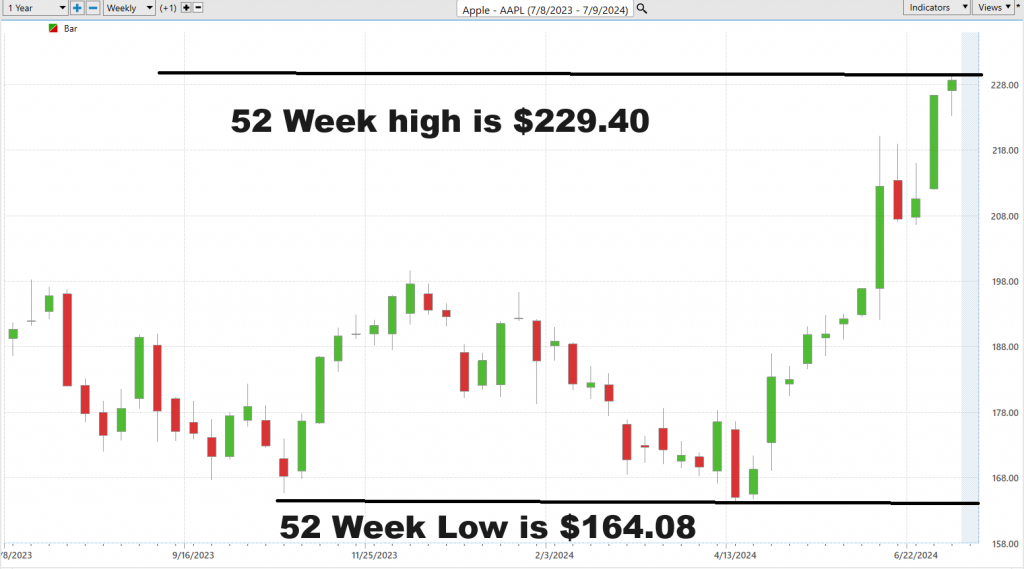
When analyzing an asset, it’s essential to evaluate its position relative to its 52-week highs. Great stocks often make new 52-week highs consistently, which might seem counterintuitive, but it’s a hallmark of strong performance. One of the most straightforward ways to evaluate a stock is by examining long-term monthly and weekly charts to understand the trend. Successful traders often rely on these longer-term charts for comprehensive trend analysis.
The 52-week high often acts as a significant resistance level, and it’s common to see a stock price surge once this level is breached. As the price interacts with this level, it’s crucial to pay attention to what artificial intelligence forecasts are signaling.
Over the past 52 weeks, $AAPL has traded as high as $230.88 and as low as $164.08, giving us an annual trading range of $66.80. By dividing this range by the current price of $228.68, we can calculate a broad measure of volatility, which is 29. This suggests that it’s normal to see $AAPL trade up to 29% higher or lower than its current price over the next 12 months. Therefore, if the stock remains within these broad boundaries, it would be considered normal based on its current volatility.
So, keep an eye on those 52-week highs and understand the volatility measures as you analyze $AAPL’s performance. This will help you make informed decisions and navigate the market with greater confidence.
We also advise traders to study where a stock is on the longer term 10-year chart to get a better perspective of the long-term trend. When we zoom out on $AAPL and analyze it from this context we see that it is also making new all-time highs. One of our favorite all-time trading setups is to place stocks on our trading radar that are making new 10-year highs as well as new 52-week highs simultaneously. This is rare when it occurs, and it communicates a great deal of confidence among traders and investors in the underlying strength of the asset.
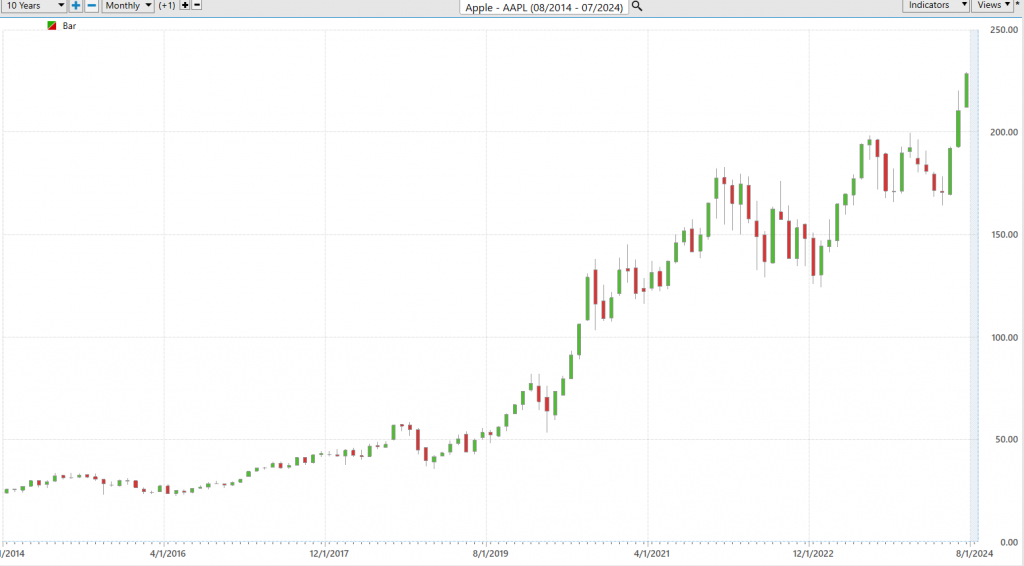
Over the last 10 years $AAPL is up over 796%!
Best Case – Worst Case Analysis
Many traders dive into the market utterly unprepared and oblivious to the risks. They’re often blinded by greed and the allure of their own analysis. But there’s a straightforward technique to instantly grasp both risk and reward—analyzing the strength of rallies and declines over the past year.
Looking at a price chart in the stock market and comparing overall market rallies to declines provides a tangible perspective on volatility. It vividly illustrates how prices can fluctuate rapidly and dramatically due to market events, investor sentiment, and other factors. The price chart offers a clear visual representation of the market’s movements over time, showcasing its ups and downs in an easily understandable format.
For instance, during a market rally, the price chart will depict a steady rise in prices with occasional dips or corrections. This signifies a period of optimism and confidence, where investors are buying stocks in anticipation of future gains. Conversely, during a market decline, the chart will reveal a sharp drop in prices, punctuated by brief rallies. This indicates a period of fear and uncertainty, with investors offloading stocks to avoid further losses. Crucially, before you start trading, you can compare the magnitude of rallies to declines and set realistic expectations.
By comparing these rallies and declines, traders can see how swiftly market sentiment can change and how volatile the market can be. This real-world perspective helps investors make informed decisions about when to buy and sell stocks and prepares them for potential losses during volatile periods.
First we look at the best-case scenario:
Followed by the worst-case scenario:
By doing and studying this analysis you can quickly see the short-term risk for $AAPL over the past year. More importantly you can also see that the stock traded in a sideways pattern for 9 months of the past year.
So, folks, don’t let greed blind you. Use this simple technique to understand the true nature of market movements and make smarter trading decisions. Stay informed, stay prepared, and you’ll navigate the market with greater confidence and clarity.
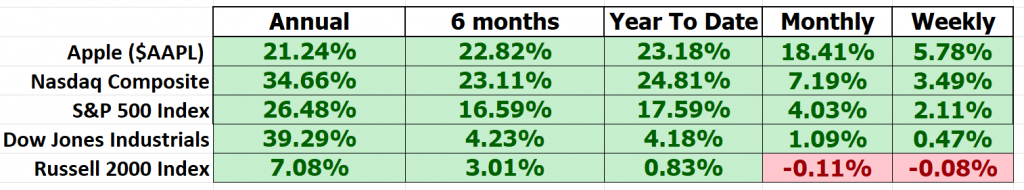
Next we compare $AAPL to the broader stock market indexes.
Over the longer term $AAPL has underperformed the S&P 500 Index. Over the shorter-term time frames $AAPL has outperformed all of the broader stock market indexes.
The beta for Apple Inc. ($AAPL) over the past five years is approximately 1.29. Beta is a measure of a stock’s volatility in relation to the overall market. Here’s a quick rundown on what beta values signify:
– **Beta of 1**: This indicates that the stock’s price tends to move with the market. If the market goes up by 1%, the stock is expected to go up by 1% as well, and vice versa.
– **Beta greater than 1**: This suggests that the stock is more volatile than the market. For example, a beta of 1.29 means the stock is 29% more volatile than the market. If the market moves up by 1%, the stock could move up by 1.29%.
– **Beta less than 1**: This indicates that the stock is less volatile than the market. A beta of 0.5, for example, means the stock would be expected to move up or down only 0.5% for a 1% move in the market.
Apple’s beta of 1.29 reflects a relatively high volatility compared to the market, which means it has historically experienced larger price fluctuations in response to market changes. This information is crucial for investors when evaluating the risk associated with the stock and making informed decisions about buying or selling.
Vantagepoint A.I. Predictive Blue Line
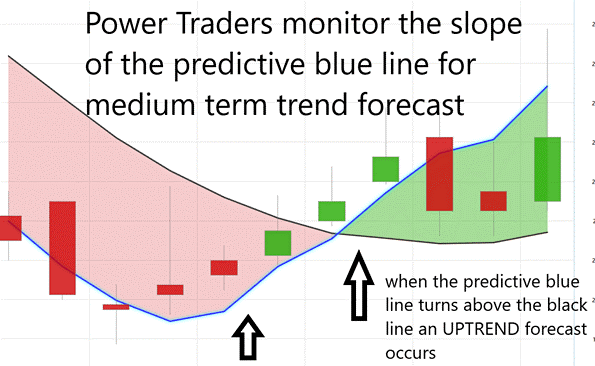
Alright, let’s get to the nuts and bolts of trading with VantagePoint Software. Traders are harnessing the power of artificial intelligence to get a read on market trends by monitoring the slope of the predictive blue line. The black line you see. That’s a simple 10-day moving average, a reflection of past market performance. But the predictive blue line? That’s your value zone—where traders aim to buy the asset at or below during uptrends.
When analyzing the chart, traders focus on the interplay between the black and predictive blue lines. The blue line is powered by VantagePoint’s patented Neural Network and Intermarket Analysis, factoring in the asset’s strongest price drivers and statistical correlations to determine its value.
Here’s the kicker: when the predictive blue line crosses above the black line, it signals an upward trend—an entry point for traders. Conversely, when it dips below, it signals a potential decline. This means traders can identify the trend and value zone without guesswork.
For short-term swing traders, it’s all about the trend, not the popularity of a stock like Apple, which is a Wall Street darling.
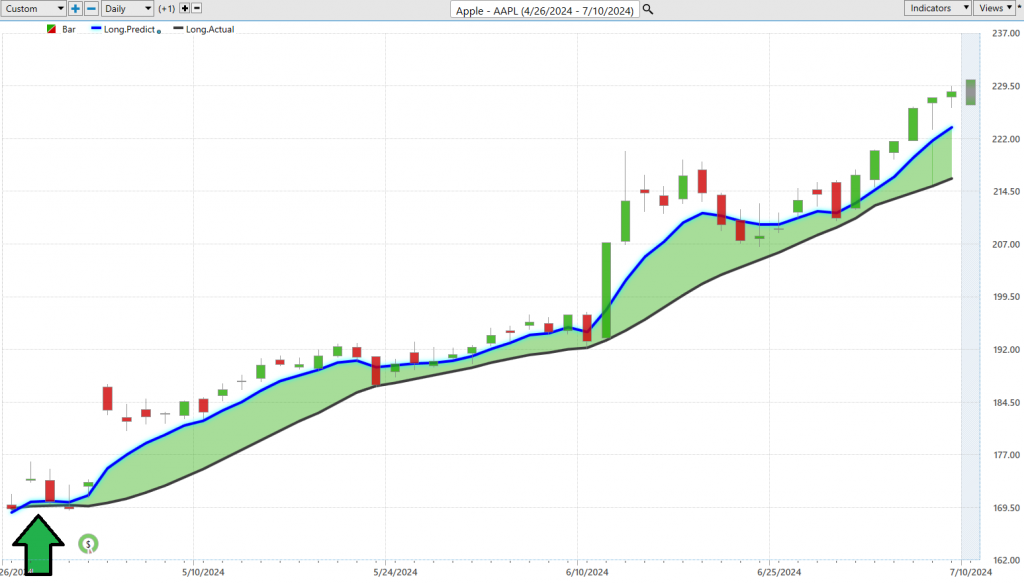
Let’s break it down for Apple ($AAPL) stock with these advanced tools:
**Trend Analysis**: The predictive blue line is your crystal ball for future market movements. If it’s climbing, you’re looking at a bullish trend, a cue to consider buying. If it dips, prepare for potential drops in Apple’s stock price.
**Value Zone Identification**: This is where timing is everything. The ‘Value Zone’ around the predictive blue line is crucial—buy when the stock is at or below this line during uptrends and sell when it peaks during downswings. This strategy helps traders maximize gains and minimize risks.
**Market Positioning**: When the blue line heads south, it’s a signal for potentially lower prices ahead. Savvy traders might step back, hedge their positions, or take other measures to protect their portfolios during turbulent times.
Thanks to AI advancements, traders now have precision tools that offer insights that were once unimaginable. The predictive blue line is more than just a tool; it’s a guiding light through the fog of market fluctuations, pointing toward profitable moves. In the high-stakes world of stock trading, having these insights can be the difference between smooth sailing and getting lost at sea.
VantagePoint A.I. Neural Network Forecast (Machine Learning)
A neural network is a sophisticated form of artificial intelligence that simulates the way the human brain processes information. It consists of layers of interconnected nodes (neurons) that work together to analyze data and identify complex patterns. In trading, neural networks can enhance performance by recognizing intricate market trends and making accurate predictions. They excel in processing vast amounts of historical price data, technical indicators, fundamental data, sentiment data, intermarket data, and macroeconomic data, which allows them to generate insights that might not be apparent to human analysts.
By leveraging neural networks, traders gain the ability to anticipate market movements more effectively, thanks to the networks’ capability to learn from past data and adapt to new market conditions. This predictive power enables traders to make more informed decisions, optimize entry and exit points, and respond proactively to market changes. Additionally, the speed and efficiency of neural networks in analyzing data ensure that traders receive timely insights, which is crucial in the fast-paced trading environment. Overall, neural networks provide a powerful tool for improving trading strategies and achieving better outcomes in the market.
The real game-changer here is how neural networks evolve. They learn from new data continuously, getting sharper and more effective. For traders, this means a toolkit supercharged with the ability to predict market trends, stepping up their decision-making game, tightening risk management, and potentially cranking up returns.
Take, for example, platforms like VantagePoint. Here, neural networks aren’t just another feature—they’re a strategic asset. They light up the charts, green when the market’s ripe for the picking, red when it’s time to back off. And when you pair these networks with traditional tools like the Predictive Blue Line? That’s when the magic happens. You get a ‘double confirmation’ signal—a two-punch combo of insights that not only points traders to goldmine opportunities but also helps slice through market complexity with unmatched precision.
Observe how you study the chart below how strategic the predictive blue line boundary is in defining value and the general trend. Also notice that the neural index forecast is for the next 48 to 72 hours. So, traders are forewarned of short-term strength or weakness in the market.
VantagePoint A.I. Daily Range Forecast
Alright, let’s talk about one of the toughest challenges in trading—knowing when to dive in and when to pull back. Market volatility can make those decisions incredibly tricky. For traders looking at stocks like Apple ($AAPL), timing is everything. It means understanding the daily, weekly, and monthly trading ranges and then using that knowledge effectively.
But here’s the twist: it’s not just about having the data. The real power comes from transforming that data into winning strategies. This is where the heavy hitters like A.I., machine learning, and neural networks come into play. These technologies aren’t just flashy terms—they’re your navigation tools through the turbulent waters of the financial markets. They provide clear, actionable insights into market trends and pinpoint trading ranges with impressive accuracy, reducing the guesswork in your trading decisions.
$AAPL is a wonderful stock to trade. The average daily trading volume for Apple Inc. ($AAPL) is approximately 77.13 million shares. This metric provides a snapshot of the stock’s liquidity, indicating how actively it is traded on an average day. Apple has around 15.33 billion shares outstanding.
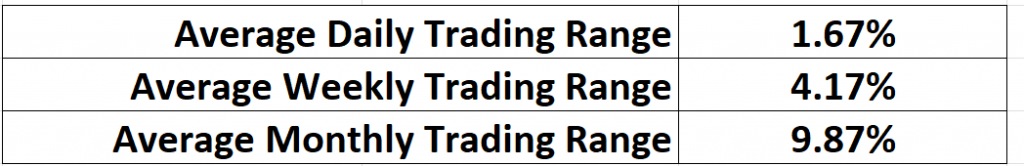
Now, let’s examine the volatility Apple ($AAPL) has faced over the past year, broken down into daily, weekly, and monthly segments. This level of detail can give you the edge in your trading strategy.
In today’s volatile market, tools like the VantagePoint A.I. Daily Range Forecast are indispensable for traders. With unmatched accuracy and comprehensive analysis, this technology gives short-term swing traders a significant advantage, allowing them to navigate the market with confidence. The tool provides detailed insights into expected daily market movements, outlining market trends and anticipated trading ranges.
The chart below highlights how effective this forecast has been on $AAPL over the past 6 months. Every day the high price and low forecast is made for the following trading day. These forecasts offer exacting precision for short term traders interested in exploiting the trend in $AAPL.
This granularity helps traders meticulously plan their entry and exit strategies, significantly boosting their confidence. By leveraging advanced analytics, traders can convert complex market data into actionable strategies, paving the way for substantial growth even in unpredictable financial environments. Predictive analytics offer the precision traders need to capitalize on market dynamics, highlighting the critical role of advanced technological tools in modern trading.
Intermarket Analysis
Intermarket analysis is like looking at how different things in the world are connected and affect each other. Imagine Apple makes iPhones, and to do that, it needs parts from companies that make chips. If those chip companies are doing well, it helps Apple make more iPhones, which can make Apple’s stock price go up. Also, Apple sells iPhones all over the world, so if the U.S. dollar is weaker, the money Apple makes in other countries is worth more, which is good for Apple. Finally, if the metals Apple uses to make iPhones stay at a stable price, it costs Apple less to make each phone, which helps them make more money. By understanding how these different markets—like chips, money from different countries, and metal prices—affect Apple, we can make better guesses about how Apple’s stock will do.
Intermarket analysis involves examining the relationships between different financial markets to understand how they influence each other. For Apple Inc. ($AAPL), one key area is the semiconductor industry. Apple relies on companies like TSMC and Qualcomm for its chip supply. Strong earnings reports and positive production forecasts from these semiconductor companies can signal a stable supply chain for Apple, potentially boosting its stock price. Conversely, any issues within the semiconductor industry can negatively impact Apple’s production capabilities and stock performance.
Currency markets also play a significant role in Apple’s financial performance. Apple generates substantial revenue from international markets, so fluctuations in the U.S. dollar affect its earnings. A weaker dollar increases the value of Apple’s overseas revenue when converted back to dollars, positively impacting its stock price. On the other hand, a stronger dollar can reduce Apple’s reported earnings, posing a challenge for its stock performance. Therefore, monitoring currency trends provides valuable insights into Apple’s financial outlook.
Commodity prices are another critical factor in intermarket analysis for Apple. The company’s production costs depend on the prices of raw materials like aluminum and rare earth metals. Stable commodity prices suggest steady production costs, which is favorable for Apple’s profit margins. However, rising commodity prices can increase manufacturing expenses, potentially squeezing margins if Apple cannot pass these costs onto consumers. By analyzing these interconnected markets—semiconductors, currencies, and commodities—traders can gain a comprehensive understanding of the various factors that impact Apple’s stock, allowing for more informed trading decisions.
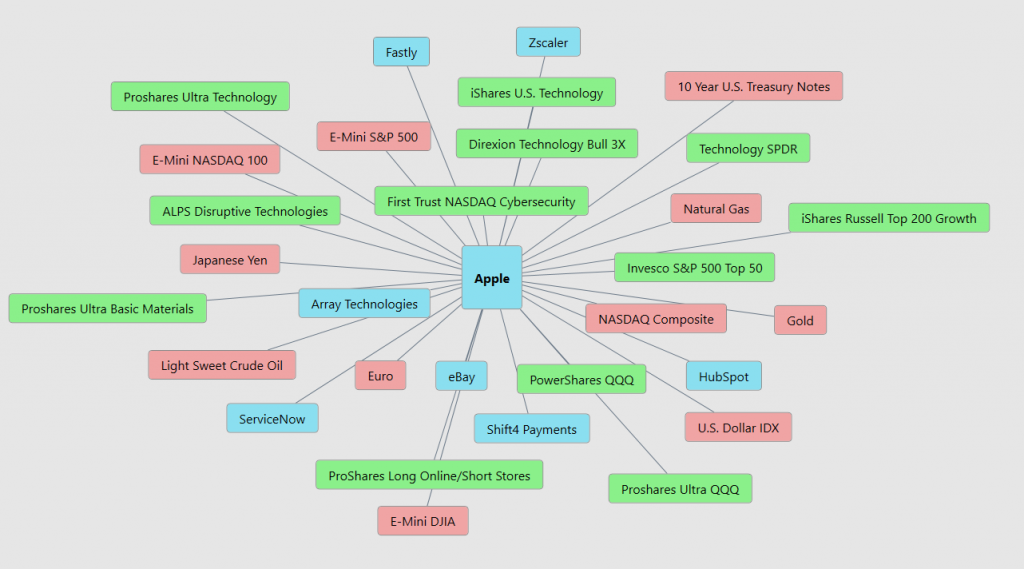
As you study the graphic below, these are the 31 top drivers of $AAPL’s price.
Our Suggestion
Apple Inc. ($AAPL) is scheduled to report its next earnings on August 1, 2024, after market close.
During the most recent earnings call, several key risks were highlighted. One significant concern is the potential impact of global economic conditions on consumer spending , which could affect demand for Apple’s products. Additionally, the company is navigating supply chain challenges , particularly with semiconductor shortages, which could impact production timelines and costs. Regulatory scrutiny and legal challenges in various regions, especially related to antitrust issues, also pose risks to Apple’s operations and market position. Lastly, currency fluctuations and geopolitical tensions could adversely affect Apple’s international revenue.
While we think $AAPL is a great stock, from a pure fundamental viewpoint it is priced very expensively at this time. The trend is UP though and because of $AAPL’s popularity we advise Power traders to rely on the daily range forecast and predictive blue line for guidance.
Practice good money management on all of your trades.
It’s Not Magic.
It’s Machine Learning.
Let’s Be Careful Out There!
Disclaimer: THERE IS A HIGH DEGREE OF RISK INVOLVED IN TRADING. IT IS NOT PRUDENT OR ADVISABLE TO MAKE TRADING DECISIONS THAT ARE BEYOND YOUR FINANCIAL MEANS OR INVOLVE TRADING CAPITAL THAT YOU ARE NOT WILLING AND CAPABLE OF LOSING.
VANTAGEPOINT’S MARKETING CAMPAIGNS, OF ANY KIND, DO NOT CONSTITUTE TRADING ADVICE OR AN ENDORSEMENT OR RECOMMENDATION BY VANTAGEPOINT AI OR ANY ASSOCIATED AFFILIATES OF ANY TRADING METHODS, PROGRAMS, SYSTEMS OR ROUTINES. VANTAGEPOINT’S PERSONNEL ARE NOT LICENSED BROKERS OR ADVISORS AND DO NOT OFFER TRADING ADVICE.