| This Week’s a.i. Stock Spotlight is Costco ($COST) |
Costco Wholesale Corporation distinguishes itself in the retail landscape through a unique business model that emphasizes bulk sales and membership exclusivity, contrasting sharply with both traditional brick-and-mortar big box retailers and online shopping platforms.
Unlike conventional retailers that profit from wide-ranging individual item sales, Costco focuses on selling a limited selection of products in bulk quantities at deeply discounted prices, which are accessible only to its members. This membership model not only ensures customer loyalty but also provides a steady revenue stream through annual fees. Furthermore, while other big box stores often rely on sales from a wide variety of goods, including high-margin items, Costco maintains a commitment to keeping costs low for its members by limiting stock keeping units (SKUs) and maximizing sales efficiency. This strategy fundamentally differs from online retailers, who often capitalize on a vast selection, convenience, and direct-to-consumer shipping, but without the same emphasis on bulk sales and in-person warehouse shopping experience.
We did a stock analysis on $COST 7 months ago which you can review here. In that analysis we stated that we believed based upon its dominant retail position and unique business model that we thought the future prospects were very bright.
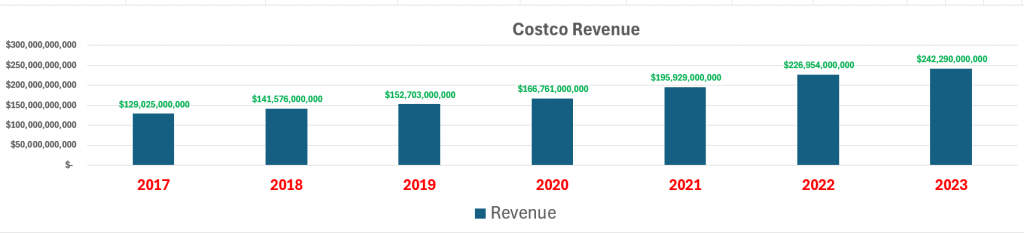
COSTCO just smashed expectations with a reported revenue of $58.5 billion—a robust 9% increase from last year—and a surge in diluted earnings per share to $3.78, up an impressive 29%, surpassing Wall Street’s consensus estimates. The business is firing on all cylinders.
Take a quick gander at Costco and you’ll be wowed. The fact that it’s trouncing analysts’ expectations isn’t a fluke but a testament to its rock-solid fundamentals—a comfort for investors in turbulent times.
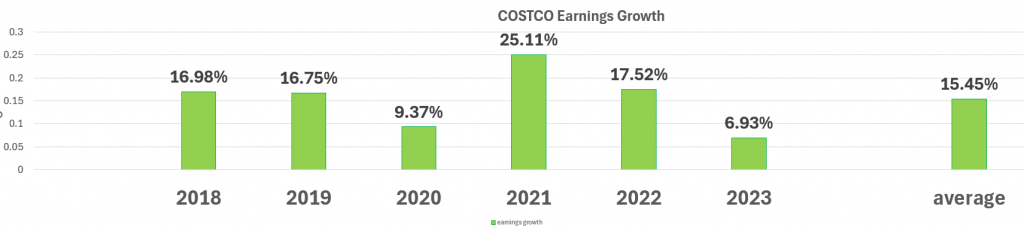
Over the last seven years, Costco’s revenue growth has averaged a healthy 11.5%. Remarkably, over the last decade, not once has the company seen a year-over-year sales dip. This kind of operational excellence is what you’d call legendary in retail.
In the fiscal third quarter of 2024, ending May 12, same-store sales popped 6.6%. Amidst the squeeze of inflation affecting household budgets everywhere, Costco’s value proposition has never shone brighter, primarily driven by an increase in customer traffic.
What’s more, it’s not just sales; earnings growth has been stellar too, averaging 15.45% annually over the same period.
Despite a lofty valuation, investors are holding steady. The trading axiom of betting on the fastest horse in the race fits perfectly with Costco—it’s a behemoth with a retail dominance that its competitors can only envy.
All you need to do is to compare $COST to the largest retailers and you will quickly understand the trading MAXIM that Winners tend to keep winning. COSTCO stock continues to have the dominant and winning position of all retailers.
Yet, the big question for Costco’s journey to a $1,000 stock price might be its current valuation. Priced at 52 times trailing earnings, this is significantly higher than Walmart’s 28 times. Even by its own historical standards, Costco’s stock isn’t cheap.
To hit a $1,000 stock price, the P/E ratio would need to stretch to 62, based on the last 12 months’ earnings per share of $16.15. If earnings per share increase, the required P/E multiple could be lower. However, if the stock does hit $1,000 this year, it’s likely operating near a P/E of 60—a tough ask given last quarter’s 9% growth rate.
Yet, there’s a potential catalyst on the horizon that could fuel investor optimism—a hike in membership fees, which hasn’t happened since 2017. Costco could be biding its time, waiting for a more favorable economic climate before announcing an increase.
Despite inflation, Costco has held prices steady, even on its iconic hot dog combo, showcasing a commitment to value. But if inflation eases and economic conditions improve, a fee increase could be imminent. The timing is uncertain—this year, next, or later—but if it comes sooner rather than later, it could ignite the stock towards that $1,000 mark.
In this weekly stock study, we will look at an analysis of the following indicators and metrics which are our guidelines which dictate our behavior in deciding whether to buy, sell or stand aside on a particular stock.
- Analysts Ratings
- 52 week high and low boundaries
- Vantagepoint A.I. Forecast (Predictive Blue Line)
- Neural Network Forecast (Machine Learning)
- Seasonal Analysis
- Daily Range Forecast
- Intermarket Analysis
- Our trading suggestion
While we make all our decisions based upon the artificial intelligence forecasts, we do look at the fundamentals briefly, just to understand the financial landscape that COSTCO is operating in.
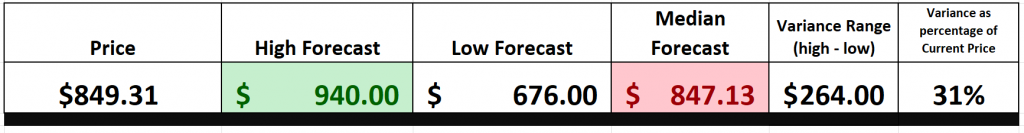
Wall Street Analysts Forecasts
Drawing on the insights of 25 Wall Street analysts, the consensus for Costco’s trajectory over the next 12 months sets a varied course. They’ve pegged the average price target at $847.13, with optimism pushing some to loftier predictions up to $940.00, while the more cautious among them hedge their bets down to $676.00. Interestingly, this average target suggests a slight dip of about 0.26% from its current trading price of $849.31. The blend of high hopes and conservative estimates paints a mixed picture of how analysts are wrestling with Costco’s valuation and future market maneuvers.
We pay attention to the variance between the most bullish and most bearish forecast to provide us with a better understanding of expected volatility. Currently this variance is $264.00 or 31% of the current price.
This level is moderately high and worthy of caution and practicing good money management when trading $COST.
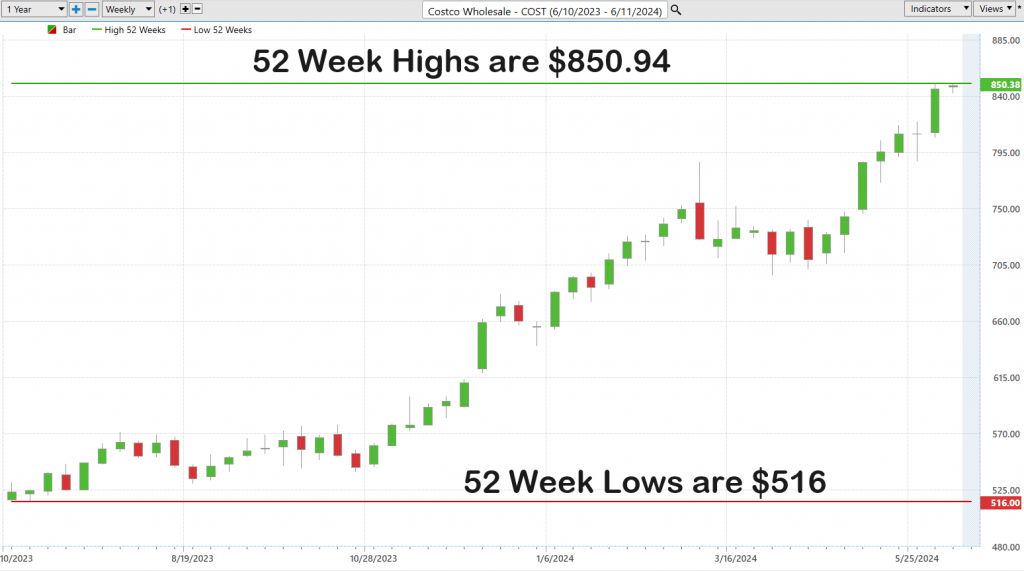
52 Week High and Low Boundaries
Let’s break it down with some commonsense metrics. Over the last year, $COST has swung from a high of $850.94 to a low of $516, marking a broad trading range of $334.94. When we slice that range by the current price, we find that $COST has experienced a statistical volatility of 39% over the past year. What this means in plain terms is that it would be entirely within the norm to see $COST swing up or down by as much as 39% from its current position.
Now, when we see a powerhouse like $COST not just nudging but firmly setting new records above those previous 52-week highs, it’s as if the bull itself is declaring, ‘Step aside, bears—this show is mine!’ This isn’t just a small step; it’s the firing of the starting gun for a bold ascent into new market territories, a whole new saga for this dynamic trend.
As $COST consistently sets these new 52-week highs, it’s clear it’s not a fleeting moment. This is a clarion call that resonates across the markets, rallying an army of traders who boost volume and energy, transforming this into a high stakes play. This isn’t just a bump in the stock’s trajectory; it’s a beacon, a rallying cry to traders everywhere to hop on this ride, this meteoric rise to the upper echelons of the market.
When an asset consistently sets new 52-week highs and simultaneously reaches new 10-year peaks, it’s a rare and noteworthy event that signals immense momentum. This dual record-breaking performance sends a clear message to the market about the asset’s robust upward trajectory and its ability to surmount any challenges on its path to success. Such achievements underscore the asset’s resilience and market confidence, indicating a strong investor belief in its potential for continued growth. This trend is often a beacon for both existing and potential investors, highlighting the asset as a formidable contender in its sector, poised for further success.
These record highs are more than just digits; they’re milestones, achievements that mark the relentless forward march of $COST. Each new peak is not just progress—it’s a leap forward, an elevation of the benchmark, igniting the bullish spirit across the trading floors. In the grand theatre of trading, perception often morphs into reality, and consistently smashing past 52-week highs crafts a narrative of dominance and allure for a stock like $COST, making it a beacon for bullish investors.
Let’s zoom out for a moment, pull up a long-term chart, and take a real good look at the journey this giant has been on. If you survey the span of the last decade, you’ll see that $COST has been hitting new 52-week highs year after year. That’s not just growth; that’s a testament to sustained, superior performance. More importantly for 6 of the last 12 months it has been making new 52-week highs and new 10-year highs simultaneously.
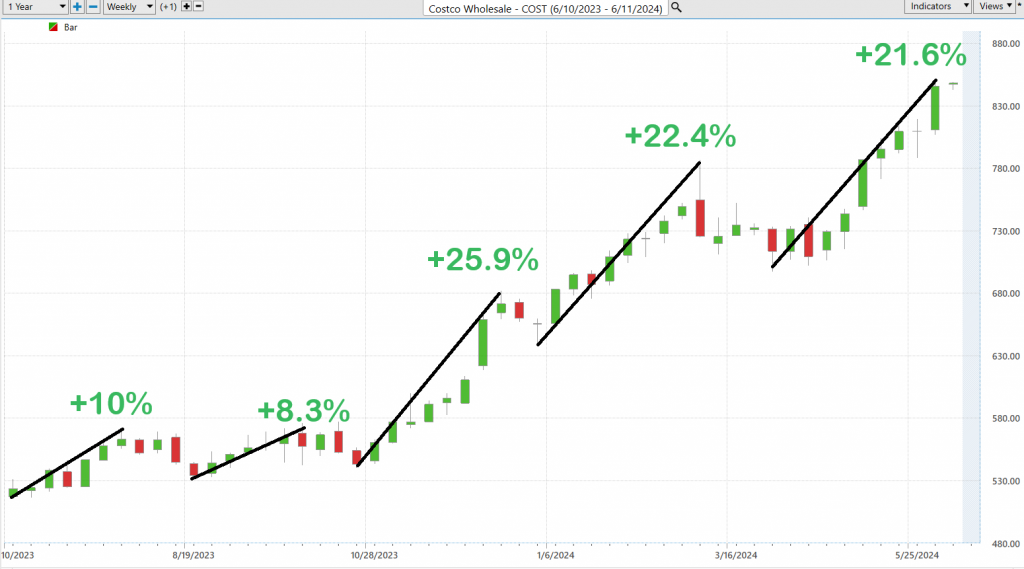
Best-Case/Worst-Case Analysis
Understanding both the potential rewards and inherent risks in the market is crucial for any investor looking to navigate the complexities of investing successfully. One of the simplest and most practical ways to gain this understanding is by analyzing the short-term rallies and declines of an asset over the past year. This comparison sheds light on the asset’s volatility and helps investors gauge whether the potential for gain outweighs the risk of loss. By observing how the asset behaves in different market conditions—both bullish and bearish—investors can develop a more nuanced view of the asset’s performance dynamics, better preparing them to make informed decisions that align with their investment goals and risk tolerance.
If you’re looking to unravel the enigmas of the market, there’s no better tool than a price chart. Think of it as a thrilling rollercoaster ride right through the pulsating heart of Wall Street, capturing every riveting rise and fall with precision. When the market rallies, the chart climbs majestically, mirroring the soaring eagle, an epitome of optimism where investors gather, betting on the lure of future prosperity. Yet, amidst these heights, it’s not uncommon to encounter the inevitable corrections and dips—moments that truly test the mettle of seasoned investors.
Conversely, when the tide turns and the markets plummet, the chart reflects this descent sharply, like a stone dropped into the depths of despair. This plunge is driven by fear and uncertainty, with investors scrambling in panic. However, even during these times of turmoil, brief rallies emerge, symbols of enduring resilience and hope. Here lies the crux of market wisdom: by comparing the intensity of these rallies to the severity of the downturns, one grasps the full spectrum of market sentiment. This approach isn’t just beneficial; it’s essential. It offers a comprehensive view of both the promising highs and the perilous lows, equipping investors with a dual perspective that serves as a navigational compass through the stormy seas of the stock market. This balanced understanding of risk and reward doesn’t just enhance a stock’s portfolio; it fundamentally transforms how one engages with the market, fostering a strategic, long-term approach to investing that seeks to master, not merely endure, the fluctuations of the market.
First, we start with the best-case analysis:
Next, we look at the worst-case analysis:
From this very simple and practical analysis you can quickly determine the level of risk associated with buying and holding $COST over the past year.
Next, we want to compare the performance of $COST to the broader stock market indexes.
Costco continues to outperform all of the major stock market indexes across all time frames.
We’re stepping into what seasoned traders might call the “BETA” territory. Think of beta (β) as the Richter scale for stocks. It’s that crucial metric that shows us how much a stock is going to shake and move in relation to the big leagues, typically the S&P 500. In plain English, beta measures a stock’s sensitivity to the market’s swings—both the highs and the lows.
Now, let’s decode this beta beast, a vital tool for understanding how a stock dances with the broader market. Here’s what you need to know:
– A beta of 1 is like having a dance partner perfectly in sync with the music. If the overall market jumps by 5%, a stock with a beta of 1 is expected to match that, moving up 5% as well.
– Now, imagine a beta greater than 1 as riding the market’s wildest rollercoaster. A beta of, say, 1.5 means the stock is 50% more volatile than the market. So, if the market climbs 5%, this thrill-seeker of a stock might shoot up by 7.5%—or drop just as sharply.
– But let’s not forget about those seeking a smoother ride. A beta below 1, like 0.5, tells us the stock is half as volatile as the market. When the market ticks up by 5%, this steadier stock will likely see a more chill 2.5% increase.
The beta of Costco Wholesale Corporation ($COST) is currently 0.78. This indicates that the stock is 22% less volatile than the broader market, typically measured against the S&P 500. So, in $COST you have a stock that has been 22% less volatile than the broader market and has outperformed it on a percentage basis by 163%. For this reason alone, $COST deserves to be on your trading radar.
Now that we have completed what we call commonsense metrics we move on to explore the ai, neural network and machine learning forecasts.
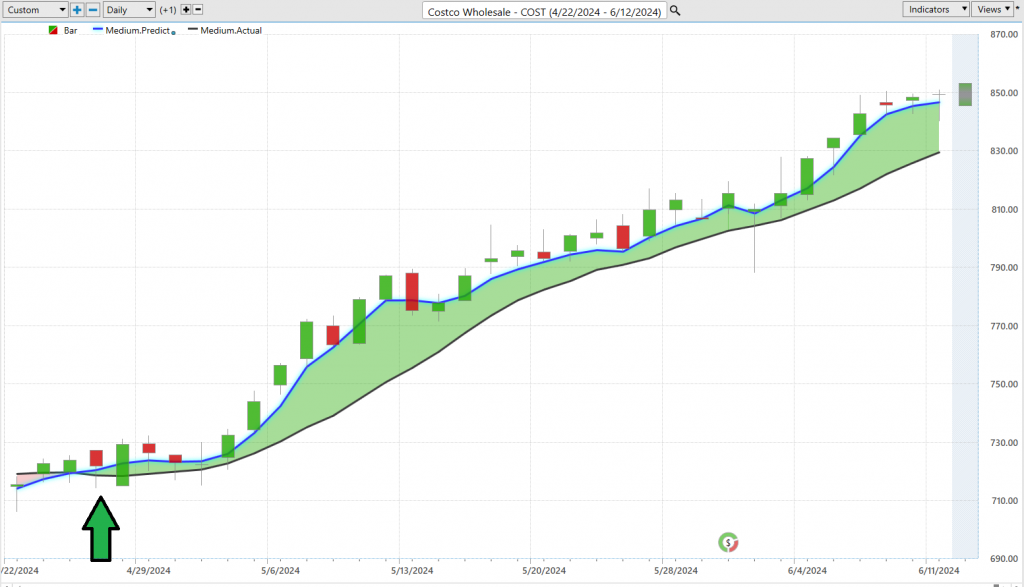
Vantagepoint A.I. Predictive Blue Line
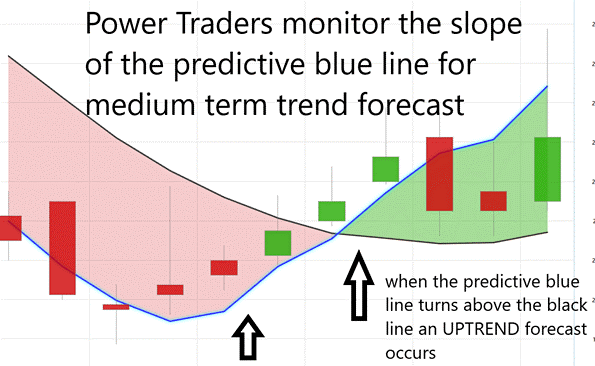
Let’s crank up the heat on how traders are using cutting-edge tech to chart their course in the markets, specifically focusing on the Vantagepoint Predictive blue line. This tool isn’t just another line on a chart; it’s a powerhouse for traders, leveraging the magic of artificial intelligence and machine learning, combined with a sophisticated intermarket analysis to predict market trends. The blue line acts like a compass in the wilderness of stock trading, pointing out the medium-term price trends for stocks like Costco.
When you spot that blue line climbing, it’s like the market’s giving you the green light to jump in—this is where the buy signals start flashing. If it flattens out, you’re in watch-and-wait territory, expecting things to stay steady. And when that line starts to dip? That’s your cue that prices might be taking a tumble soon. This isn’t just a line; it’s your trading ninja, quietly crunching numbers to map out your next move. Remember, the golden rule in trading—whether you’re looking for quick gains or riding out for the long run—is to sync up with the trend. With the predictive blue line from Vantagepoint, you’re not just following trends, you’re staying a step ahead, illuminated by the insights of one of the sharpest tools in the shed.
When you observe two consecutive closes above the predictive blue line, it’s akin to the market tipping its hat to you, hinting that an uptrend could be unfolding. Conversely, spotting two consecutive closes below that line should sound the alarm bells—a possible downtrend looms. This straightforward, no-nonsense approach demystifies the complexities of market trends, allowing you to tailor your investment and trading strategies with precision. It’s about aligning yourself with the correct trend at the opportune moment—it’s as clear-cut as that.
Neural Network Forecast (Machine Learning)
A neural network, in the context of trading, is a form of artificial intelligence designed to simulate the way human brains operate, allowing it to process vast amounts of information quickly and efficiently. It is constructed from layers of interconnected nodes, or “neurons,” each of which processes incoming data, makes calculations, and passes results to subsequent layers. The network is trained using historical data to recognize patterns and make predictions about future market movements. This training involves adjusting the weights of the connections between nodes to minimize prediction errors, enhancing the model’s accuracy over time.
For traders, neural networks can dramatically improve decision-making processes. By analyzing complex and large datasets far beyond human capability, these networks can detect subtle patterns and indicators that might be overlooked otherwise. They can forecast market trends, identify trading opportunities, and even suggest optimal entry and exit points, all in real time. This capacity to digest and analyze data from multiple sources—including market indicators, economic reports, and global events—enables traders to make more informed and strategic decisions.
Imagine, if you will, a neural network as an extraordinarily intelligent artificial brain at the core of your trading strategy. This brain is voracious—it consumes enormous amounts of market data, processes this through its complex system, and delivers astute predictions that are constantly refined. These Neural Index trading algorithms are perpetual learners, continuously enhancing their precision, which is invaluable for verifying market trends.
These advanced A.I. systems delve into the depths of market data, absorbing everything from detailed technical analyses to broad global events and precise corporate predictions. And here’s the striking part—they’re incredibly fast. They identify correlations and connections between disparate market factors with a speed and accuracy that outpace human capabilities. For instance, they might detect how shifts in oil prices could unexpectedly affect regional stock indices. These insights offer traders a substantial competitive advantage.
Here’s the cornerstone of effective trading—verification. Experienced traders often cross-reference signals from the predictive blue line with the Neural Network Indicator for robust trend confirmation. When these two align, it signals a clear opportunity, either to buy or to sell, depending on the direction of the alignment.
Think of these neural networks as the superheroes of the trading world, wielding the power of next-generation supercomputers to uncover market patterns and connections that are beyond the reach of traditional analysis. That’s why astute traders keep an eye out for these high-probability forecasts, deeply rooted in historical data.
In essence, being a power trader means keeping a vigilant watch on both the Neural Network and the A.I. forecasts—your very own dynamic duo. When both indicators signal green, it’s a strong buy signal; when they flash red, it’s time to sell. Remember, in the fast-paced world of trading, the assurance of double confirmation is your key to success.
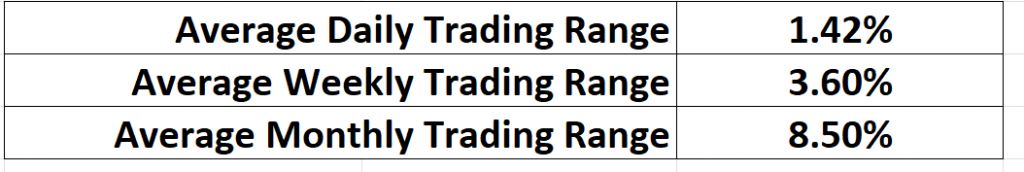
VantagePoint A.I. Daily Range Forecast
One of the biggest issues that traders grapple with is their entries and exits. This is where VantagePoint shines in providing daily predicted price levels for unparalleled guidance.
Because of the incredible data crunching power of the artificial intelligence, machine learning and intermarket analysis, the software makes harnessing market volatility second nature.
Here are the average daily, weekly, and monthly ranges for Costco over the past year.
But here’s the real scoop: it’s not merely about possessing vast amounts of data; the true art is in harnessing that data to craft unbeatable strategies. This is where the heavy artillery—A.I., machine learning, and neural networks—comes into play. These aren’t just high-tech jargon; they are indispensable tools, guiding you through the turbulent waters of the financial markets. With these technologies at your disposal, you gain crystal-clear insights into market trends and pinpoint precise trading opportunities with extraordinary accuracy, dramatically reducing the guesswork involved in your trading decisions.
Here is a chart of the VantagePoint A.I. daily range forecast over the past 3 months. Observe the exacting precision that is offered to Power Traders. This wisdom the critical role of these modern technologies in today’s trading world.
With this kind of detailed insight, traders can sharpen their game, strategically planning when to jump in and out of trades, boosting their confidence to sky-high levels. By tapping into advanced analytics, traders transform complex market data into clear-cut, actionable strategies, setting the stage for big-time growth even when the market throws curveballs. This precision—thanks to predictive analytics—becomes a game-changer for those looking to make a play on market dynamics, underscoring just how vital these advanced tech tools are in the modern trading arena.
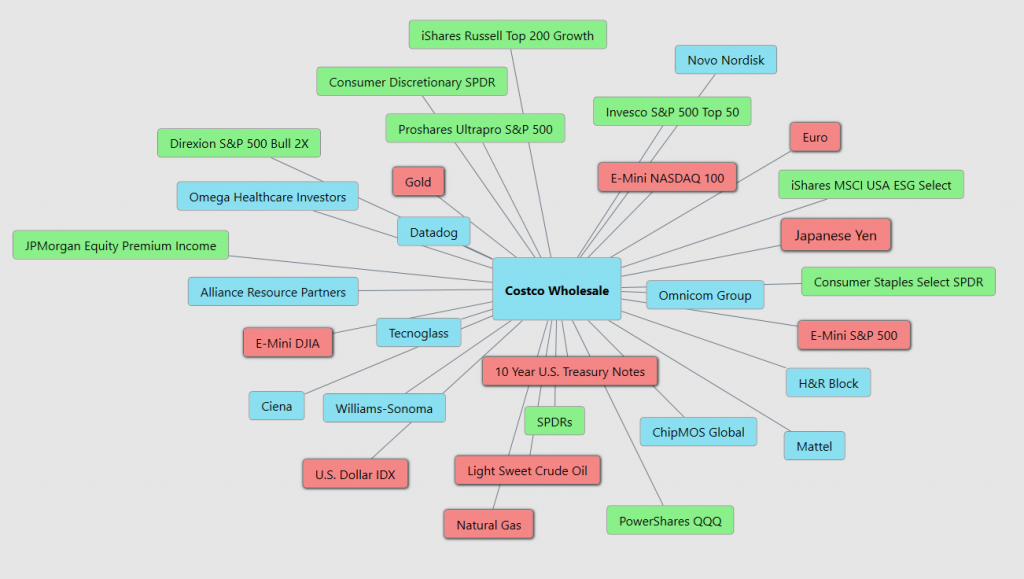
Intermarket Analysis
Intermarket analysis explores market dynamics by scrutinizing the correlations between various asset classes, illuminating how movements in one can influence others. This analytical method is pivotal for traders, providing insights into how interconnected market forces can inform investment decisions. A quintessential example of such a relationship is the inverse link between stock prices and bond interest rates, suggesting that as interest rates rise, stock prices tend to decline, and vice versa.
While fundamentally grounded in relationships between markets, intermarket analysis is often categorized under technical analysis and can be approached through various methods, including mechanical and rule-based strategies. By tapping into the power of these intermarket connections, traders can unlock a treasure trove of insights into sweeping market trends and spot crucial pivot points where the game changes. This isn’t just about looking at the numbers; it’s about seeing the whole playing field—how different markets dance together, pushing and pulling on each other. With this kind of strategic vision, traders can predict price moves before they happen, riding the wave of interconnected market forces. It’s this holistic game plan that boosts their edge, turning potential into profits in the high-stakes world of trading.
Exploring the 31 key drivers of price offers traders a lens to discover hidden opportunities. By delving into these diverse elements, traders can unearth underlying forces that might not be immediately visible through standard technical analysis. This deeper insight enables traders to make well-informed decisions and spot potentially undervalued opportunities. For instance, a rapid shift in crude oil prices can affect not just energy stocks but also the transportation and manufacturing sectors. By grasping these complex interrelations, traders are better positioned to leverage emerging trends and enhance their profitability.
Our Suggestion
Costco stands out from its retail competitors primarily due to its membership-based model and bulk selling strategy. Unlike typical retailers, Costco requires customers to purchase a membership to shop, and this strategy has proven incredibly successful. As of early May, Costco boasts a staggering 74.5 million paid memberships, a figure that’s on the rise and backed by a high renewal rate—over 90% worldwide and even higher in the U.S. and Canada. This model not only fosters customer loyalty but also drives consistent revenue through membership fees, which have been gradually increasing, now starting at $60 annually.
Furthermore, Costco has always focused on in-store shopping experiences but didn’t ignore the shift towards e-commerce, especially accentuated by the pandemic. While historically slow in its digital expansion, Costco has been catching up, with online sales growing impressively, outpacing overall company growth in recent months. This is part of a broader strategy to enhance its online presence without sacrificing the draw of its physical stores, which continue to perform well.
The retailer is also diversifying its product range, slowly expanding beyond groceries into categories like clothing, electronics, and other discretionary items. Recent reports suggest a shift in consumer behavior, with an uptick in purchases of more discretionary products as inflation stabilizes. Costco is leveraging this trend by broadening its inventory, even introducing new products under its popular Kirkland Signature brand.
In terms of expansion, Costco continues to build new stores, maintaining a robust growth strategy despite the dense presence of competitors like Walmart and Target. With nearly 880 stores primarily in North America, Costco’s store count is modest compared to Walmart’s and Target’s, but its market strategy and store performance suggest there’s still plenty of room for growth. This careful but consistent expansion underscores Costco’s strategic approach to growth, balancing new store openings with maintaining high performance in existing locations.
Costco is dominating the retailer playbook with its unique club membership model, and folks, it’s working like a charm. With over 74 million folks paying up to shop, and a renewal rate that any business would kill for, Costco isn’t just surviving: it’s thriving. They’re dialing up the heat with memberships starting at 60 bucks a pop and climbing, yet the crowds just keep coming.
And let me tell you, while the digital gold rush had everyone scrambling, Costco took its sweet time to get into e-commerce. But now? They’re all in, ramping up online sales like there’s no tomorrow, growing faster than you can say ‘bulk savings.’ Plus, they’re not just sticking to what they know. Costco’s stretching its legs, diving into new markets from high-tech gadgets to fashion, and even making a splash with exclusive Kirkland Signature goodies.
As for growing their footprint, while some might say the U.S. is oversaturated with stores, Costco’s playing the long game. They’re laying down new stores, not just anywhere but right where they need to be, proving that even amidst a sea of Walmart’s and Targets, a Costco store can not only survive but actually flourish. Last quarter’s sales numbers? Up over 6% across the board. Now that’s what you call market savvy—knowing when to hold, when to fold, and when to go all in.
Costco’s next earnings call is scheduled for September 26, 2024, after the market closes. We advise traders and investors to pay close attention to revenue growth and earnings.
Both metrics have been growing very quickly and I expect that they will continue to fuel future growth.
Traders use the ai forecast for guidance and practice solid money management on all of your traders.
Let’s Be Careful Out There.
It’s Not Magic.
It’s Machine Learning.
Disclaimer: THERE IS A HIGH DEGREE OF RISK INVOLVED IN TRADING. IT IS NOT PRUDENT OR ADVISABLE TO MAKE TRADING DECISIONS THAT ARE BEYOND YOUR FINANCIAL MEANS OR INVOLVE TRADING CAPITAL THAT YOU ARE NOT WILLING AND CAPABLE OF LOSING.
VANTAGEPOINT’S MARKETING CAMPAIGNS, OF ANY KIND, DO NOT CONSTITUTE TRADING ADVICE OR AN ENDORSEMENT OR RECOMMENDATION BY VANTAGEPOINT AI OR ANY ASSOCIATED AFFILIATES OF ANY TRADING METHODS, PROGRAMS, SYSTEMS OR ROUTINES. VANTAGEPOINT’S PERSONNEL ARE NOT LICENSED BROKERS OR ADVISORS AND DO NOT OFFER TRADING ADVICE.