| This week’s stock analysis is Invesco QQQ Trust – ($QQQ) |

The PowerShares QQQ ETF, widely known as QQQ, has captivated investors as a premier exchange-traded fund that tracks the dynamic Nasdaq-100 Index. Comprising 100 top non-financial firms listed on the Nasdaq Stock Market, QQQ has emerged as a force to reckon with in the market.
The $QQQ ETF has numerous reasons for its popularity. Among them are:
1. Tech-Heavy Exposure Driving Market Growth:
An enchanting allure for investors lies in QQQ’s tech-centric portfolio, featuring renowned giants like Apple, Microsoft, Amazon, Google, and Facebook. These tech behemoths have played pivotal roles in steering market growth.
2. Diversification Amplifying Growth Potential:
Investors have embraced QQQ for its potential to offer exposure to a diverse array of high-growth companies within the technology and communication sectors.
3. Unparalleled Performance:
QQQ has carved a path of consistent and robust returns, enticing investors who seek capital appreciation and market-beating gains.
4. Liquid and Lucrative:
With soaring trading volumes, QQQ ensures seamless transactions with minimal price fluctuations. The ETF currently manages a staggering $213.28 billion, generating a tantalizing dividend yield of $2.15 per share or 0.56%.
Incepted on March 10, 1999, by the esteemed global asset management company Invesco, QQQ boasts an impressive history that has fueled its enduring popularity among investors. Now, let’s turn our attention to the expense ratio, a pivotal metric for evaluating ETFs. The expense ratio for QQQ stands at a commendable 0.2%. This figure reflects the ETF’s
prudent management of operating expenses relative to its assets under management (AUM), which translates to a lower burden on investors’ investment capital.
Beta, a crucial risk gauge in finance, shines a light on QQQ’s market sensitivity. With a beta of 1.22, the ETF is projected to exhibit 22% more price movement compared to its benchmark index. This implies heightened volatility relative to the market. While this characteristic might lead to outperformance during bullish market conditions, it could also expose investors to increased risk during market downturns.
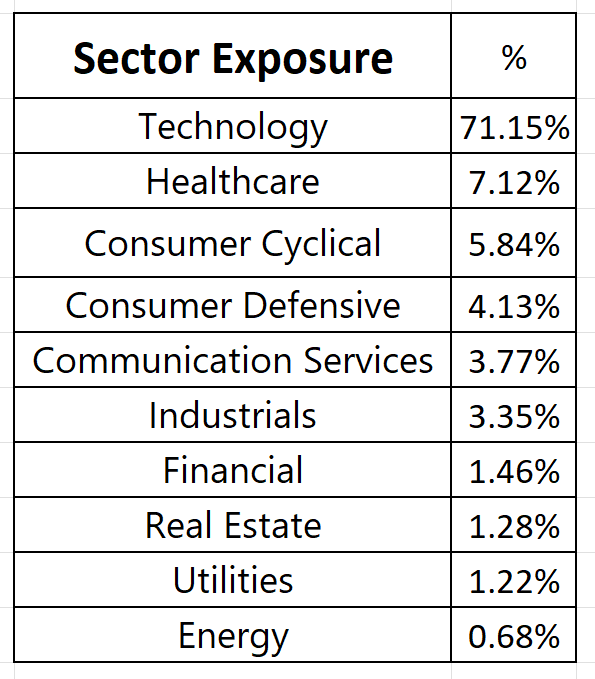
Furthermore, a sector breakdown reveals QQQ’s firm embrace of the technology sector, with a hefty weighting of holdings in this segment. As the ETF’s top ten holdings boast an average price-to-earnings (P/E) ratio of approximately 86.9 to 1, it accentuates the tech sector’s appeal. However, the overall P/E ratio for the entire fund stands at 31, signaling a relatively high valuation for the portfolio as a whole.
In conclusion, PowerShares QQQ ETF has emerged as a tech-heavy darling with a strong performance history, captivating investors with its growth potential and tech-centric holdings. While it bears a higher level of market sensitivity, its prudent expense management and diversified portfolio make it an enticing prospect for investors seeking tech-driven growth. As with any investment, it’s essential for investors to consider their risk appetite and long-term goals when evaluating this captivating ETF.
In this weekly stock study, we will look at and analyze the following indicators and metrics as are our guidelines which dictate our behavior on a particular stock.
- Wall Street Analysts’ Estimates
- 52-week high and low boundaries
- Best Case – Worst Case Analysis
- Vantagepoint A.I. Forecast (Predictive Blue Line)
- Neural Network Forecast
- Daily Range Forecast
- Intermarket Analysis
- Our trading suggestion
We don’t base our decisions on things like earnings or fundamental cash flow valuations. However, we do look at them to better understand the financial landscape that a company is operating under.
Analysts Ratings
The first set of boundaries which we explore in our stock study is what do the professionals think who monitor the stock for a living. We can acquire this information by simply looking at the boundaries that the top Wall Street Analysts set for $QQQ. This initial set of boundaries provides us with an idea of what is expensive, fairly valued, and cheap.
Based on 1,748 Wall Street analysts offering 12-month price targets to QQQ holdings in the last 3 months. The average price target is $416.46 with a high forecast of $498.62 and a low forecast of $315.68. The average price target represents an 8.80% change from the last price of $382.79.
When we represent these values graphically, we get a very direct idea of VOLATILITY based upon the top minds on Wall Street who follow the $QQQ 24/7. By simply looking at the difference between the high estimate and the low estimate from top Wall Street Analysts we can see that the variance from the current price is 47.8%.
This value informs us that it would be wise for us to expect the $QQQ to trade 47.8% higher or lower than the current price over the next year. What is also interesting to us is that the average forecast among all analysts is $416.46 which tells us that the consensus estimate on Wall Street is that there is still a belief that the ETF can rally 8.8% from the current price levels.
52-week High-Low Chart
Where the rubber meets the road as far as analysis is concerned is looking at the charts and evaluating where the asset stands in relation to its 52-week highs. As counterintuitive as it may sound, great stocks tend to consistently make new 52-week highs.
One of the simplest ways to evaluate a stock is to look at some long term monthly and weekly charts to be able to zoom out and see the big picture of the trend. Some of the greatest traders in the world use the longer-term monthly charts to determine trend analysis.
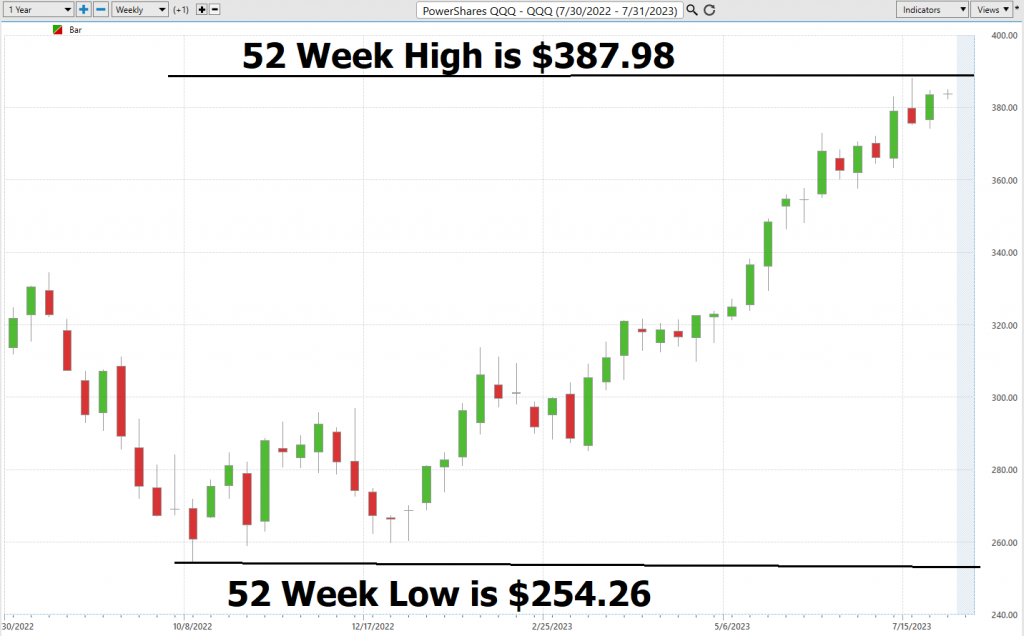
In the world of traders, the 52-week high and low metrics hold profound significance, playing a crucial role in their investment and trading decisions. By scrutinizing an asset’s current market price in comparison to its past highs and lows, traders gain valuable insights into the asset’s position within its annual range. Presently, $QQQ finds itself trading in the 96th percentile of its 52-week range, prompting keen attention from market participants.
Over the past year, the price action of $QQQ has witnessed impressive extremes, reaching a soaring high of $387.98 and plunging to a low of $252.91, resulting in a substantial annual range of $135.07. This annual range’s statistical volatility stands at a notable 35.2%. Calculated by dividing the annual range into the current price, this metric unveils a straightforward yet insightful glimpse into the asset’s past 52-week volatility. Armed with this historical roadmap of volatility, traders can make informed comparisons with Wall Street Analysts’ forecast estimates, elevating their expectations while trading $QQQ.
The annualized statistical volatility serves as a window into an asset’s past behavior, thereby aiding in forecasting its future trajectory. A high annualized statistical volatility suggests that substantial fluctuations have characterized the past and are likely to persist into the future. In the case of $QQQ, the statistical volatility of 35.2% signals the possibility of witnessing price movements up to 35.2% higher and/or lower than the current level, should the next 52 weeks mirror the previous period.
Traders keenly observe their positioning in relation to the 52-week trading range, recognizing the potent impact of the 52-week high as a robust resistance level for the market. When the 52-week high is surpassed, it often triggers explosive upward moves in stock prices, propelling them sharply higher within a short timeframe.
In conclusion, the 52-week high and low metrics, along with annualized statistical volatility, serve as indispensable tools for traders navigating the financial markets. These insights provide invaluable guidance, empowering traders to anticipate potential price swings and align their strategies for optimal results. As they keep a watchful eye on $QQQ’s position within its trading range, they remain attuned to potential breakout opportunities and capitalize on market dynamics to secure their trading success.
We also recommend that traders zoom out and look at the 10-year monthly chart whenever possible. This chart will provide a longer-term view of the price trajectory and volatility that the $QQ has experienced over the past decade.
Best Case – Worst Case Analysis
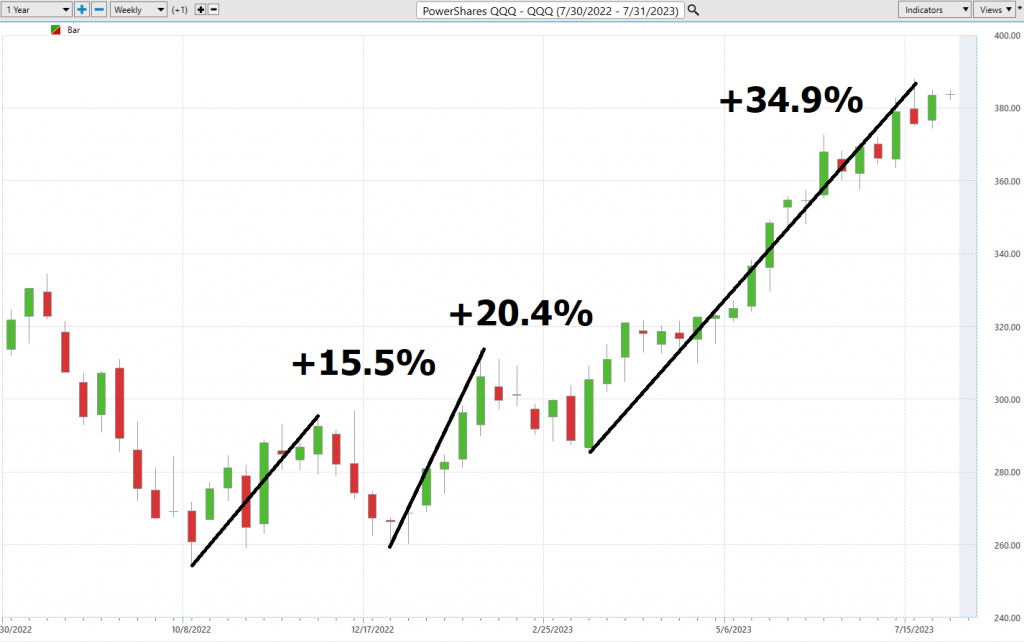
Next, we want to look at the best case and worst-case scenarios. We do this to compare the magnitude of the rallies against the weakness of the declines. By simply connecting the intermittent highs and lows we can get a very real and practical perspective on the risk and volatility associated with trading $QQQ.
The graphic below shows the roller coaster ride.
Here is the best-case analysis.
Followed by the worst-case analysis.
Observe how so far, the rallies and declines, measure peak to trough have stayed within the statistical volatility boundaries.
We would expect this type of volatility to continue. This means that traders should anticipate wild swings in the market and pay attention to the a.i. forecast when we hit large drawdown levels from recent peaks.
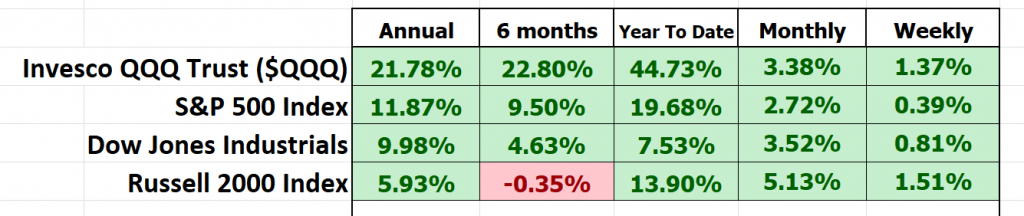
Lastly, we compare $QQQ to the broader stock market indexes to get an idea of its performance on a weekly, monthly, semi-annual, and annual basis.
This analysis clearly tells us that $QQQ has outperformed the broader market but that it is also significantly more volatile.
Vantagepoint A.I. Forecast Predictive Blue Line
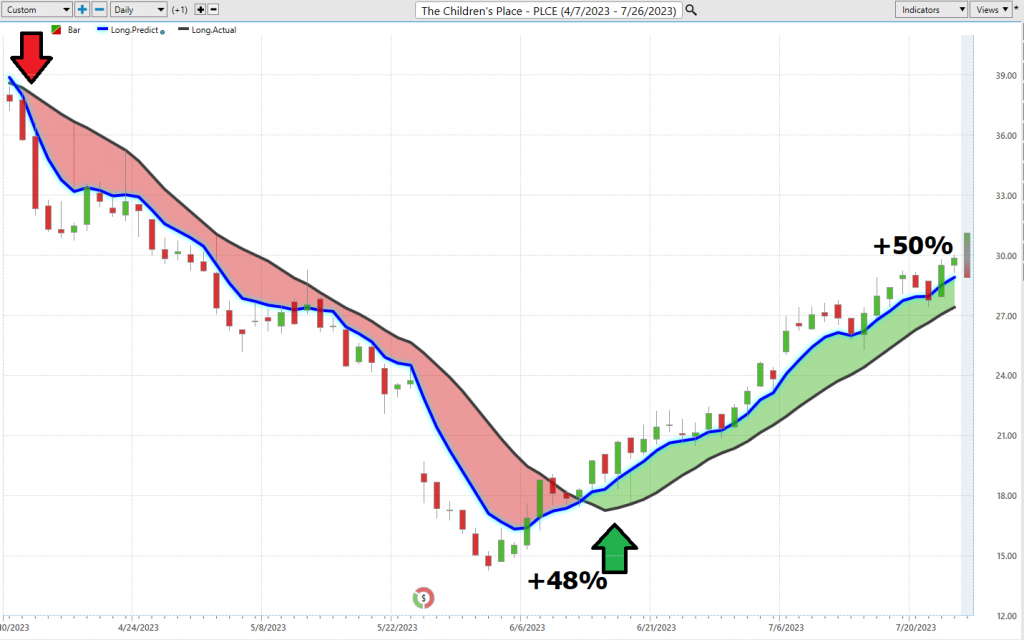
Using VantagePoint Software and artificial intelligence, traders are alerted to trend forecasts by monitoring the slope of the predictive blue line. The black line is a simple 10-day moving average of prices which simply tells you what has occurred in the market. The predictive blue line also acts as a value zone where in uptrends traders try to purchase the asset at or below the blue line.
In studying the chart below, pay close attention to the relationship between the black line and predictive blue line. All that the black line tells you is what has occurred. It tells you where prices have been and what the average price over the last ten days is.
The predictive blue line, on the other hand utilizes that Vantagepoint patented Neural Network and Intermarket Analysis to arrive at its value. It looks at the strongest price drivers of an asset through artificial intelligence and statistical correlations to determine its value.
Whenever we see the predictive blue line move above the black line, we are presented with an UP-forecast entry opportunity. This is highlighted by the UP arrow on the chart.
Whenever the predictive blue line moves below the black line, we are presented with a DOWN forecast. More importantly, there is no guesswork involved. Ideally, traders are trying to buy at or below the predictive blue line. In other words, observe how the predictive blue line acts like a magnet and pulls price towards it regularly.
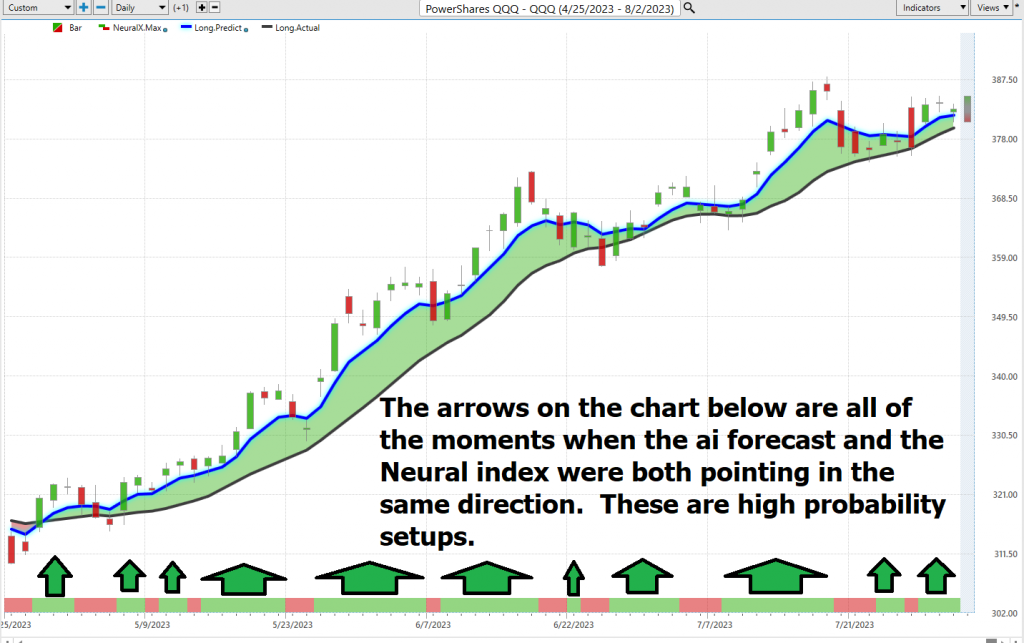
Fine Tuning Entries with The Neural Net Indicator
In the realm of market analysis, the Neural Network Indicator takes center stage at the bottom of the chart, a powerful predictor of forthcoming market strength or vulnerability. With a green hue, it communicates an aura of strength, while a red shade signals short-term market weakness. For Power Traders seeking the edge in their
trading decisions, this indicator serves as a compass, guiding them towards optimal entry and exit points when cross-referenced with the predictive blue line.
The Neural Net, a computational learning system, unleashes its might by processing vast troves of data through a network of functions, skillfully translating inputs into desired outputs. Constantly self-monitoring and enhancing its prowess, this artificial intelligence (AI) marvel excels in spotting trends, envisioning outcomes, and making informed decisions. In the trading world, the Neural Network emerges as an invaluable asset, capable of identifying patterns, forecasting trends, and empowering traders with an automated decision support tool, bolstering the potential for trading success.
With a relentless pursuit of statistically robust trading opportunities, Power Traders harness the force of both neural networks and AI to conquer the markets. A “double confirmation” setup beckons, and they eagerly await the predictive blue line’s upward trajectory, artfully aligned with the Neural Net’s validation at the chart’s bottom. This synchronicity serves as a potent signal, unveiling promising trading prospects that ignite their pursuit of profitable trades.
We advise Power Traders to cross reference the predictive blue line with the Neural Net for the best entry opportunities. Observe how the slope of the predictive blue line has remained positive from the time earnings were announced.
You can see in the chart above how the Neural Index was consistently green which meant that rising prices were expected. These instances provide extremely high probability trading opportunities to exploit the trend.
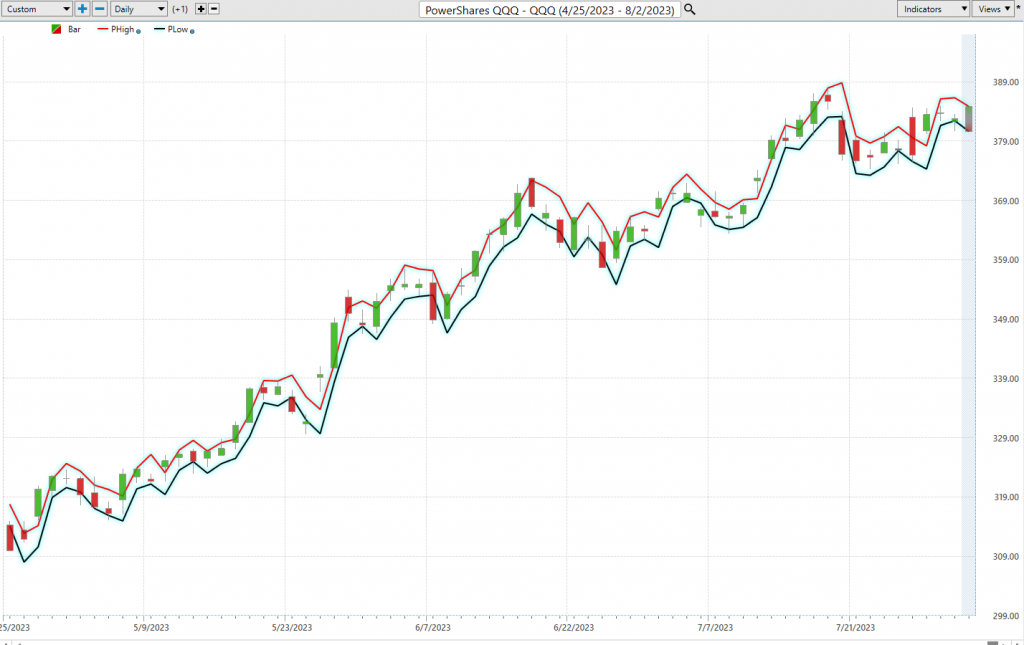
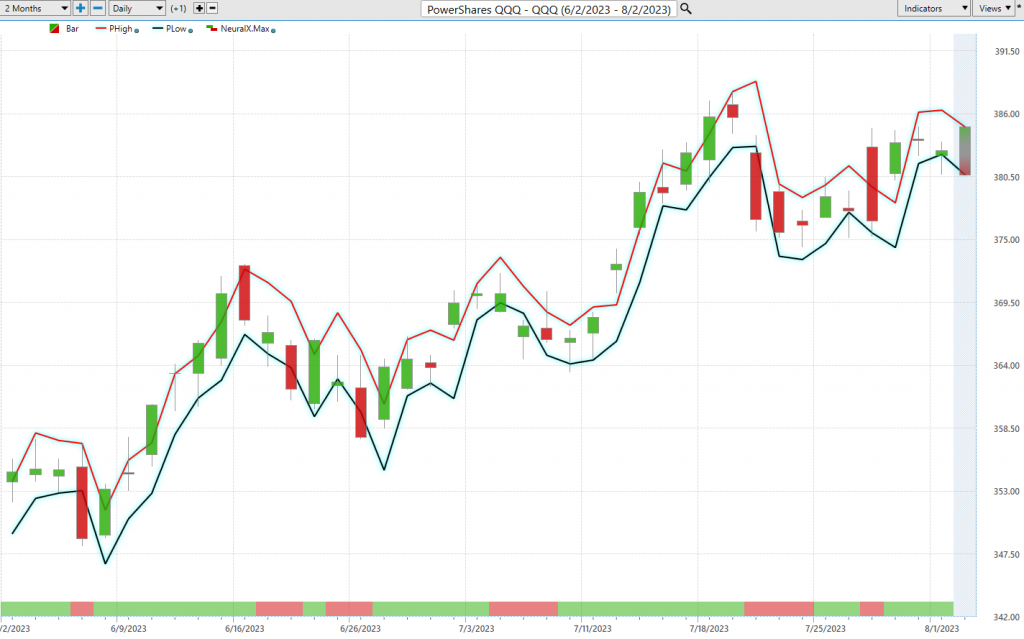
VantagePoint Software Daily Price Range Prediction
Every trader wants to know where to ideally buy and sell the underlying asset.
$QQQ is a very volatile ETF as we have already discovered. This volatility can be a dream if you are on the right side of the trend at the right time. Or it can be a nightmare if you are not.
Let’s look at the trading metrics for $QQQ over the past year:
These metrics give us a very real idea of risk for the time frame measured. But they only tell us what has happened in the past.
One of the powerful features in the Vantagepoint A.I. Software which Power Traders use every day is the Daily Price Range prediction forecast. This tool assists traders in even further micro refining their entries and exits in the market.
What is the most important feature that traders are concerned about? Traders need to know where to enter and exit a market. VantagePoint provides this answer with exacting precision. Every day the Daily Range forecast is updated to provide insight to that days anticipated price action.
By cross-referencing the double confirmation setup with the daily range forecast Power Traders are alerted to swing trading opportunities with exacting precision.
Intermarket Analysis
Vantagepoint Software’s remarkable capabilities lie in its adeptness at conducting Intermarket analysis, unlocking the secret to identifying assets with the strongest
statistical interconnections, serving as primary price drivers. While studying charts offers objective realities and reveals support and resistance levels with clarity, we must remember that we dwell in an intricate global marketplace, where everything is intricately linked. For traders, the billion-dollar question perpetually revolves around unearthing the key drivers influencing the price of their chosen underlying assets.
These elusive yet highly significant intangibles elude the naked eye but boast extraordinarily high statistical correlations. Enter Intermarket analysis—an analytical technique that delves into the correlations between various financial markets and assets. By scrutinizing the intricate web of connections spanning stocks, commodities, money markets, bonds, currencies, and everything else tradable in public markets, investors can gain vital insights into potential trends. Intermarket analysis leverages both fundamental data, like news reports, and technical data, such as price movements, to unravel relationships that inform astute trading decisions.
The ever-present challenge for investors and traders is deciphering the myriad factors—small changes in interest rates, crude oil prices, dollar volatility, and a plethora of other variables—that influence companies’ survival strategies amid the current challenging times.
Understanding the key drivers shaping $QQQ’s price action yields immense value. This comprehension not only sheds light on the ETFs most likely to incorporate $QQQ into their portfolios but also uncovers other industries exerting an impact on $QQQ’s price movements.
This invaluable knowledge empowers traders to spot additional opportunities and identify ETFs that align with $QQQ’s buyers. By unlocking these insights, traders can unveil nascent trading opportunities before they blossom into full-fledged prospects. Such foresight sets the stage for unearthing untapped trading potentials, propelling traders ahead of the curve and onto the path of strategic success.
Suggestion
The trend is UP. Momentum is UP.
While I am not a fundamental investor, I pay attention to benchmarks like the price earnings ratio of a stock or an ETF to better understand its price action historically.
While I expect the $QQQ to trade higher it’s not because of improving economic conditions, or greater earnings on the part of the companies included in the ETF. Rather we’re witnessing a mania where tech companies are believed to be able to defy the laws of gravity.
Benjamin Graham is the wise long-term investor who profoundly influenced Warren Buffett as his mentor. Graham championed an investment philosophy centered around long-term value. He advocated for buying companies that were trading at less than 7 times earnings, a key indicator of undervaluation. Graham’s timeless approach emphasized thorough research, prudent analysis, and the art of identifying companies with strong fundamentals at bargain prices. His enduring wisdom continues to shape the investment landscape, guiding investors to seek enduring value and sound opportunities in the market. Traders and investors who believe in the time-proven philosophies of Buffett and Graham would currently be looking at the Crude Oil, Gas Exploration sector where many outstanding companies are trading at 6 times earnings.
My interpretation of current price action is that the $QQQ is that when the top 10 stocks in the ETF are trading on average at 89 times earnings, only two things can occur to create a more favorable valuation. 1) The companies will produce more earnings, which is unlikely considering that the cost of money has increased by 100% over the past 18 months. or 2) the companies will decline in price to make the p/e more attractive.
While short-term trading opportunities exist on the long side of QQQ’s, this ETF is trading at nosebleed levels. It is not for the faint-hearted. Only seasoned traders should be in this ETF with tight small money management stops.
I recognize this is a very “unsexy” thing to say. The QQQ’s are all of the rage. Huge gains have been made and participants are convinced that “this time is different.” But if you look at the long-term chart historically, we’ve only traded higher than the current price level for 11 weeks during 2021 before the Fed started their interest rate increases.
For these reasons, we look at $QQQ as a HIT and Run candidate. We think there is a bit more upside but will trade in small quantities for short periods of time.
As I write these words it has been reported that credit rating agency FITCH has downgraded US Treasuries from AAA to AA. This is important because it implies that there is less and less faith in the U.S. dollar despite it being the reserve currency of the world.
Observe in the chart above how spending on interest expenditures has gone parabolic! In a debt-based monetary system, the dangers become evident when interest expenses escalate exponentially, creating a parabolic chart pattern. As interest rates surge, the burden of servicing debt becomes overwhelming for individuals, corporations, and governments, leading to potential defaults and economic instability. Such a scenario can trigger a vicious cycle of rising debt, higher interest costs, and reduced investment, constraining economic growth and causing financial crises.
The credit rating agency FITCH is apparently recognizing the dangers inherent in the chart above in choosing to downgrade U.S. credit. It’s a bit peculiar that Fitch initially threatened to downgrade the US in May, expressing concern over the lack of a debt-ceiling deal and time running out, and then went ahead with the downgrade in August after Congress eventually worked out the deal to avoid default. Nevertheless, I understand the broader message they are sending. Fitch highlighted a steady decline in governance standards, particularly on fiscal and debt matters, spanning the past two decades, despite the bipartisan agreement to suspend the debt limit until January 2025.
An important side note: S&P credit rating agency downgraded the U.S. Treasury rating from AAA to AA+ on August 5, 2011. The downgrade occurred during a period of heightened concern over the U.S. debt ceiling and the country’s fiscal situation. It marked a significant event as it was the first time in history that the United States lost its AAA credit rating from S&P. The end result is that we saw the $QQQ’s sell off 15% over the next 3 weeks .
This recent action from Fitch echoes a similar move made by S&P Global Ratings in 2011, which remained in effect. While investors still view Treasuries as a safe haven and reliable collateral, this downgrade brings attention to the deteriorating US fiscal outlook. It raises concerns about the nation’s fiscal stability and underscores the need for responsible fiscal management moving forward.
While this is not a death blow to stocks, what it does do is force all traders and investors to evaluate how much exposure they are willing to give to U.S. Bonds.
Our advice: Follow the a.i. trend analysis and practice good money management on all your trades . There will be short term swing trades in the QQQ’s but recognize that with this type of news volatility will increase even further from what we have written about in this article.
We will re-evaluate this analysis based upon:
- Wall Street Analysts’ Estimates
- 52-week high and low boundaries
- Vantagepoint A.I. Forecast (Predictive Blue Line)
- Neural Network Forecast
- Daily Range Forecast
Let’s Be Careful Out There!
Remember, It’s Not Magic.
It’s Machine Learning.
Disclaimer: THERE IS A HIGH DEGREE OF RISK INVOLVED IN TRADING. IT IS NOT PRUDENT OR ADVISABLE TO MAKE TRADING DECISIONS THAT ARE BEYOND YOUR FINANCIAL MEANS OR INVOLVE TRADING CAPITAL THAT YOU ARE NOT WILLING AND CAPABLE OF LOSING.
VANTAGEPOINT’S MARKETING CAMPAIGNS, OF ANY KIND, DO NOT CONSTITUTE TRADING ADVICE OR AN ENDORSEMENT OR RECOMMENDATION BY VANTAGEPOINT AI OR ANY ASSOCIATED AFFILIATES OF ANY TRADING METHODS, PROGRAMS, SYSTEMS OR ROUTINES. VANTAGEPOINT’S PERSONNEL ARE NOT LICENSED BROKERS OR ADVISORS AND DO NOT OFFER TRADING ADVICE.