| This Week’s a.i. Stock Spotlight is WalMart ($WMT) |

Walmart, renowned for its laser-focus on low-margin, competitive pricing, is now celebrating an impressive streak of financial victories, thanks to its strategic tech investments.
Reflecting on Walmart’s recent financial outcomes, the fiscal year concluded on January 31, 2024, and the subsequent quarter ending on April 30, 2024, illustrate significant momentum. The retailer is witnessing an increasing influx of customers both in-store and online, propelling its stock to achieve 52-week highs.
Diving into the financial specifics, Walmart’s performance for fiscal 2024 underscores its solid position. Remarkably, the company’s free cash flow surged by $3 billion, reaching $15 billion.
The above table comes to life when you look at it on a percentage change basis which highlights consistent revenue growth but a very volatile earnings environment.
A highlight for investors is the impressive 23% rise in e-commerce sales during the fourth quarter of fiscal 2024, complemented by a 28% increase in global advertising revenue across the year.
These results reflect a company that’s not just executing but excelling in a strategy that deeply resonates with consumers. Given the traditionally low margins in in-store retail, the significant revenue generated from advertising and e-commerce offers promising prospects for future margin expansion. This strategic shift is shaping up as a pivotal growth lever for Walmart’s stock.
Looking forward, the optimism within Walmart is palpable. The retailer has raised its dividend by 9% for the current fiscal year, establishing a new annual yield of about 1.3%. Moreover, it retains a robust $15.5 billion for future share repurchases. The anticipated acquisition of Vizio, still under regulatory scrutiny, is expected to further amplify its advertising revenue streams. Walmart’s confident outlook anticipates sales and operating income to reach or even exceed the upper echelons of its initial projections.
With rising sales, expanding non-core revenue streams, and the financial prowess to enhance dividends, Walmart undeniably presents an attractive investment opportunity. The stock is not just at a high; it’s set for higher growth, earnings, and multiple expansion.
Taking a fresh position in Walmart might seem a bit risky at this moment. The stock has rocketed up nearly 30% since the lows of October, soaring a whopping 65% from its mid-2022 bottom and is now cruising at record highs. Currently trading at 26 times projected earnings per share, some might question how much higher it can realistically climb.
However, this might just be one of those rare moments where paying a premium could be exactly the right move. There are compelling reasons to bet on Walmart right now.
**Impressive Growth**: At a time when numerous companies are slamming into economic barriers, Walmart is breaking through. Take Target, for example, which just saw its same-store sales drop by 3.7% for the quarter ending in early May. Contrast that with Walmart, where same-store sales in the U.S. jumped by 3.8% during its first fiscal quarter, helping propel overall revenue growth by 6%. These numbers are part of a longer trend that’s also driving strong profit growth.
Why is Walmart outpacing a similar giant like Target? It’s all in the product mix. While Target focuses more on discretionary items, Walmart stacks up on groceries and consumer staples that are always in demand, no matter the economic climate.
**Capturing the High Earners**: Walmart is increasingly appealing to a segment it hasn’t traditionally dominated – households earning over $100,000 a year. Since the inflation surge in 2022, even the higher earners are looking to stretch their dollars further, and Walmart is rising to the occasion. Whether these shoppers will stick around post-crisis is up for debate, but Walmart isn’t taking chances, enhancing its stores, and pushing its Walmart+ program to rival Amazon Prime.
**E-commerce Prowess**: Walmart’s e-commerce segment is on fire, with online sales up 21% from the previous year, illustrating continuous significant growth. This sector, generating about $80 billion annually, shows there’s still plenty of market share to snatch from competitors like Amazon.
As Wall Street watches closely, it’s clear that Walmart is not just tweaking its online platform; it’s revolutionizing it. The retail giant is rolling out cutting-edge advertising solutions that empower third-party sellers to showcase their products with unprecedented effectiveness. This strategy is not merely about broadening its market reach; it’s about sharply enhancing profitability. Indeed, e-commerce advertising revenues are now boasting staggering margins between 70% to 80%.
**The Power of Scale**: In this digital arena, Walmart’s immense size transforms from a mere advantage into a formidable weapon. This is no ordinary retailer; this is a titan with the clout to set market terms, streamline its supply chain with unparalleled efficiency, and deliver products with a speed that rivals any in the industry.
But here’s what really has Wall Street buzzing: For the first time, Walmart is showing signs of mounting a genuine counteroffensive against Amazon’s long-standing online dominance. By continuously refining its e-commerce strategies and leveraging its colossal infrastructure, Walmart is beginning to turn the tide. Analysts are keyed up as they see Walmart not just competing, but striking back, chipping away at Amazon’s market share with its sophisticated online platforms.
To sum up, while the stock market is inherently subject to ups and downs, Walmart’s trajectory is pointed decidedly upward. The long-term outlook is decidedly bullish. This isn’t merely about purchasing stock; it’s about investing in a market leader poised for sustained triumph. As seasoned market pros often advise, sometimes you need to hold your breath and plunge into the fray. Walmart is heating up and, given its strategic advancements, is set to get even hotter.
In this stock study we will look at the following metrics and indicators.
- Wall Street Analysts’ Estimates
- 52-week high and low boundaries
- The Best Case – Worst Case Scenarios
- Vantagepoint A.I. Predictive Blue Line
- Neural Network Forecast
- Daily Range Forecast
- Intermarket Analysis
- Our trading suggestion
We don’t base decisions on things like earnings or fundamental cash flow valuations. However, we do look at them to better understand the financial landscape that a company is operating under.
Wall Street Analysts’ Estimates
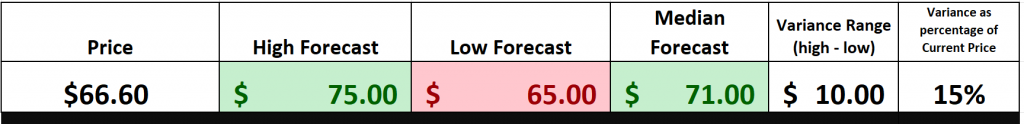
Let’s dive into the latest from Wall Street, folks. We’ve got 28 analysts who’ve been eyeing Walmart’s stock over the past quarter, and they’re putting some interesting numbers on the table. The consensus? An average price target of $71.00 on the stock. But hold on, it gets better. Some are even more bullish, stretching that target up to $75.00, while the more cautious voices are setting the floor at $65.00.
What we pay attention to is the variance between the most bullish and bearish voices to see what the expected volatility is for $WMT. You can see that this variance amounts to $10 or roughly 15% of the current price. This is very low volatility in comparison to the broader market.
52-Week high and low boundaries

Let’s zero in on the rollercoaster ride that is Walmart’s stock ($WMT) over the past year. This powerhouse has hit a high of $66.86 and dipped to a low of $49.50 —that’s a swing of $17.36. Cracking into these figures, we see Walmart has shown a historic annual volatility of 26%. Now, that’s pretty much in line with the broader market indexes. What’s the takeaway here? It tells us loud and clear that swings of about 26% up or down are totally on the table for Walmart in the coming year.
But here’s where it gets spicy: Walmart is trading at the 98th percentile of its 52-week range. That’s right, at the top end of its game, signaling a bullish sentiment that’s got investors leaning in.
Now, why should you care about a stock’s 52-week highs and lows? These aren’t just numbers, my friends—they’re the grades on the report card of the stock’s annual performance. They give us a crystal-clear view of the stock’s trajectory and are pivotal for spotting trends.
When you’ve got a stock like Walmart consistently making new highs, it’s not just moving—it’s signaling a bullish trend that can spell more gains. This kind of momentum often fuels itself, pushing the stock to even greater heights. But if it starts marking new lows? That’s when you’ve got to watch out because it might signal a downturn.
And remember, when a stock breaks above its 52-week high, it’s not just any signal—it’s a blazing green light that might just be pointing to a golden trading opportunity. Conversely, slipping below its 52-week low can flash a big red warning.
To all the traders out there, always keep an eye on those stocks hitting both new 52-week and 10-year highs—it’s a telltale sign that something significant is happening, something that’s overcoming historical barriers. Even if you’re not sure what’s driving the price, the market is clearly telling you this stock is one to watch closely.
Walmart stock has been making new 52-week highs and new 10-year highs simultaneously. For this reason alone, it deserves to be on your trading radar!
Best-Case Worst-Case Analysis
Let’s break down an essential tool for every trader’s kit—the balance between risk and reward. It’s straightforward: understanding this balance isn’t about getting lost in complex strategies. It’s about mapping out the best-case and worst-case scenarios. Think of it like navigating the stormy seas of the market—knowing the highs and lows of the past year can be your compass.
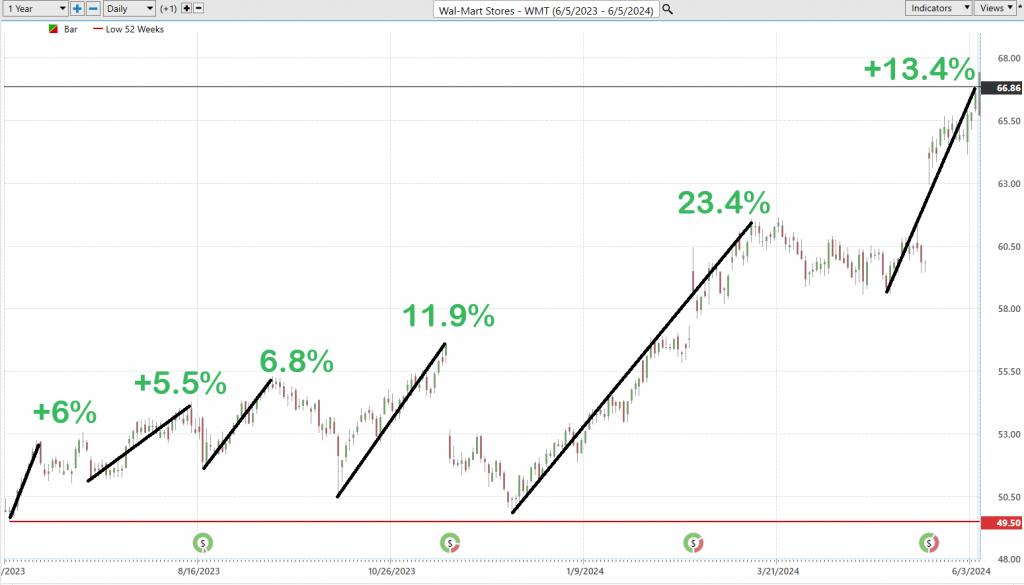
Imagine we’re charting the major rallies and declines of Walmart ($WMT) over the past year, like tracing the rise and fall of giant ocean waves. This isn’t just financial jargon; it’s about gaining deep insights into what risk and reward really mean for this stock. This simple, hands-on exercise quickly sheds light on what you could gain and what you could lose.
Here’s where it gets real: we need to weigh those impressive bullish rallies against the bearish downturns. It’s akin to steering through rough waters, where knowing the risk and volatility becomes crucial. This isn’t about fancy footwork; it’s strategic thinking. By examining both the peaks and valleys, we not only understand the stock’s potential but also come to grips with the inherent risks.
Don’t just glance over those charts—really dive into them. This approach isn’t just tactical; it’s about crafting a strategy that empowers you to make decisions that are not only informed but also savvy, helping you manage your exposure and build a trading plan that stands strong no matter the weather.
Why is this exercise so crucial? Because it’s grounded in practicality. Let’s assume the near future echoes the recent past. This assumption suggests we might see similar volatility ahead. Instead of floating in theoretical abstractions, we immediately get a real-world handle on risk and reward.
Now, let’s get into the details. From this vantage point, we can quickly size up the potential highs and lows for $WMT over the past year.
First, consider the best-case scenario:
Next, assess the worst-case scenario:
From this angle, we can clearly see the playing field—understanding both the potential rewards and risks over the past year for $WMT. The picture is clear: the bulls have the upper hand, with the declines being relatively tame compared to the gains.
Next, we compare $WMT to the broader stock market indexes. By doing so we can immediately see how impressive the gains in $WMT have been in comparison to any of the other stock market indexes.
A couple of important metrics which you can digest are that on a year-to-date basis the Dow Jones Industrials and the Russell 2000 Index are not keeping pace with inflation. While I can guess as to why that is occurring, my conclusion is that $WMT is doing well because it is attracting a wealthier clientele who see the effects of inflation on groceries and consumer goods.
Lastly, we now look at volatility of $WMT through an indicator called BETA which comparatively measures the VOLATILTY of $WMT to the broader stock market. The 5-year beta for Walmart (WMT) is approximately 0.49. This low beta value suggests that Walmart’s stock is 51% less volatile compared to the broader market. This is very appealing for investors who are trying to minimize risk.
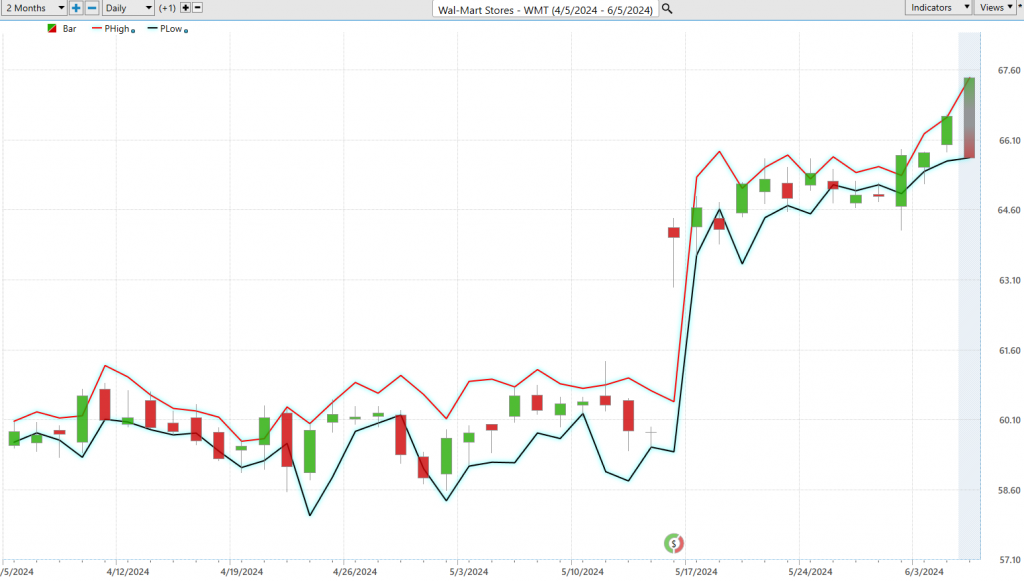
Vantagepoint A.I. Predictive Blue Line
Let’s break down the core principles that are shaping the way traders are trading Walmart ($WMT). Now, this is all about understanding the flow—the trajectory of what we at VantagePoint like to call the ‘predictive blue line.’ This isn’t just some fancy chart mark; it’s your map to where the stock might head next, guiding us through the market’s twists and turns.
Let’s lay out the game plan for tackling Walmart ($WMT) stock with some cutting-edge tools at our disposal:
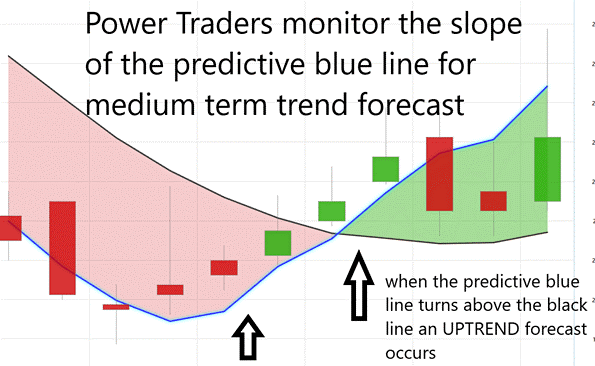
**Trend Analysis**: First up, we’ve got the predictive blue line. This isn’t just any line on a chart—it’s your insight into future market movements. A climbing blue line? That’s signaling a rally, a bullish push that suggests it’s time to consider getting in. On the flip side, if that line starts to dip, brace yourself for potential drops in WalMart’s stock price.
**Value Zone Identification**: Now, this is where the rubber meets the road. Around that predictive blue line lies what we call the ‘Value Zone.’ It’s all about timing here—buying right at or below this line when things are looking up, or selling when the stock peaks above it during a downswing. This is how traders aim to maximize gains and minimize risks.
**Market Positioning**: And let’s talk strategy when that blue line heads south. It’s a heads-up from the market, signaling possibly lower prices on the horizon. Savvy traders might take a step back, sitting out the turbulence, or they might hedge their positions to cushion any potential hits, keeping their portfolios safe while they navigate these choppy waters.
Thanks to advancements in artificial intelligence, like those powering the trend-forecasting capabilities we’re talking about, traders can now approach the market with a level of precision that was once unimaginable. This predictive blue line isn’t just a tool; it’s like a lighthouse guiding traders through the fog of daily stock fluctuations, pointing towards potentially profitable moves. Remember, in the high-stakes world of stock trading, being equipped with the right insights can mean the difference between sailing smoothly and getting lost at sea.
But here’s where it gets interesting: When that predictive blue line starts pointing down, it’s like a signal flare telling traders to brace for potentially lower prices. That’s your cue—either you sit this dance out or you hedge your bets.
Thanks to tools like VantagePoint Software, traders have got a secret weapon in their arsenal. This isn’t just another tool; it’s like having a financial GPS. Powered by artificial intelligence, it’s keeping an eye on that blue line for you, helping decipher whether you’re heading into a bull market or if it’s time to buckle up for a bear run.
Think of this blue line as your market compass, folks. When it’s climbing, that’s the market telling you it’s time to go bullish, to start thinking about buying. But when it dips, the market’s cooling off, maybe even warning you of a downturn, so it might just be the right moment to consider selling.
In today’s high-speed financial environment, having a tool that offers such clear insights into market trends? That’s not just useful; it’s gold. It’s about maximizing your potential for reward while tightly managing your risk. And in this game, being armed with the right tools isn’t just an advantage—it’s essential.
The predictive blue line from VantagePoint Software isn’t just another line on your screen—it’s a game-changer. This isn’t just about guiding—it’s about giving you a direct line to what’s happening in the markets. Real-time insights, folks, that’s what we’re talking about. This line, powered by some slick A.I. technology, lets you see the turns before they come, setting you up to ride the wave rather than getting swamped by it.
This A.I. isn’t just crunching numbers; it’s cracking the code on complex market relationships, forecasting shifts before they hit the mainstream. Imagine that—having a heads-up on market movements while everyone else is still looking at yesterday’s news. That’s the kind of edge VantagePoint gives you, letting you pinpoint the best spots to jump in or out, protecting your investments from sudden swings.
And it’s not just about flying solo with one indicator. No, sir. We look for confirmation, a second nod from other AI-driven tools to make sure we’re stepping into the right trades at the right times. That’s how you cut through the noise—with precision, confidence, and a whole lot of tech on your side.
Check out how this blue line has been slicing through the fog with Walmart ($WMT). It’s clear, it’s sharp, and it’s right on the money. That’s how you navigate these turbulent markets, not just with any tool, but with a powerhouse that anticipates the market’s every move.
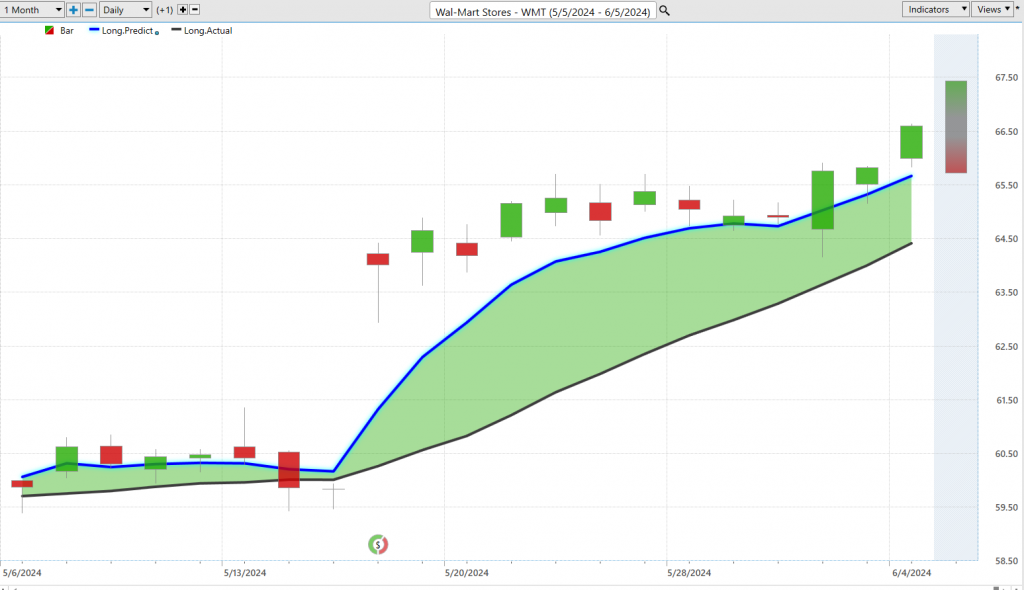
Neural Network Forecast (Machine Learning)
Let’s power up the conversation about neural networks, the high-tech marvels transforming the trading floors. Think of these as ultra-smart computational models—they’re like the human brain on steroids. These networks, with layers upon layers of nodes or ‘neurons,’ are crunching numbers and recognizing patterns just like our brains, but at a pace and precision that’s simply out of this world.
In the high-octane world of trading, neural networks are like having a superpower. They’re not just good—they’re exceptional at spotting complex patterns and relationships in market data that might slip past human traders or old-school methods. This is crucial because, let’s face it, the financial markets wait for no one. They’re fast, they’re furious, and they’re always changing.
The real game-changer here is how neural networks evolve. They learn from new data continuously, getting sharper and more effective. For traders, this means a toolkit supercharged with the ability to predict market trends, stepping up their decision-making game, tightening risk management, and potentially cranking up returns.
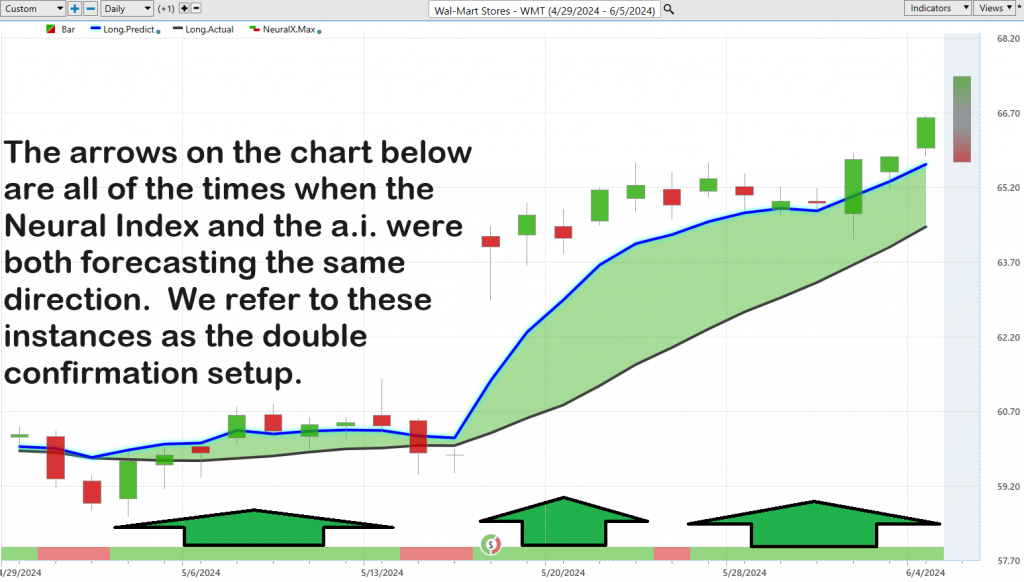
Take, for example, platforms like VantagePoint. Here, neural networks aren’t just another feature—they’re a strategic asset. They light up the charts, green when the market’s ripe for the picking, red when it’s time to back off. And when you pair these networks with traditional tools like the Predictive Blue Line? That’s when the magic happens. You get a ‘double confirmation’ signal—a two-punch combo of insights that not only points traders to goldmine opportunities but also helps slice through market complexity with unmatched precision.
Observe how you study the chart below how strategic the predictive blue line boundary is in defining value and the general trend.
This isn’t just advancement; it’s a revolution, elevating trading strategies onto a whole new level. For traders aiming to harness the cutting-edge of technology to dominate the markets, neural networks are indispensable. They’re not just changing the game; they’re rewriting the rules.
VantagePoint A.I. Daily Range Forecast
Let’s talk about one of the toughest nuts to crack in trading—knowing when to jump in and when to bail out. Market volatility can throw you for a loop, making those decisions even more challenging. For traders eyeing stocks like Walmart ($WMT), nailing the timing means understanding the ebb and flow of daily, weekly, and monthly trading ranges—and then putting that knowledge into action.
But here’s the kicker: it’s not just about having the data; it’s about turning that data into winning strategies. That’s where the big guns like A.I., machine learning, and neural networks come into play. These technologies aren’t just fancy buzzwords—they’re your roadmap through the stormy seas of the financial markets. They give you clear, actionable insights into market trends and pinpoint trading ranges with remarkable accuracy, slashing the guesswork from your trading decisions.
Now, let’s dive into what the volatility looked like for Walmart ($WMT) over the past year, broken down by daily, weekly, and monthly time frames. This is the kind of intel that can give you the edge in your trading game.
In the current climate of market volatility, the VantagePoint A.I. Daily Range Forecast stands out as an essential tool for traders. With its unparalleled accuracy and comprehensive analysis, this technology provides short-term swing traders with a notable edge, enabling them to navigate the market with confidence. The tool offers detailed insights into expected daily market movements, clearly outlining market trends and anticipated trading ranges.
Such granularity allows traders to carefully plan their entry and exit strategies, significantly boosting their confidence. By harnessing advanced analytics, traders can convert complex market data into actionable strategies, paving the way for substantial growth even in unpredictable financial environments. The precision provided by predictive analytics is crucial for traders aiming to capitalize on market dynamics, highlighting the critical role of advanced technological tools in modern trading.
Seasonal Analysis
Seasonal analysis in trading refers to the study of historical price patterns that recur at specific times of the year. This technique leverages the understanding that certain assets exhibit predictable behavior during particular seasons, driven by factors such as agricultural cycles, holiday spending, fiscal year-end adjustments, and weather conditions. By identifying these recurring patterns, traders can anticipate potential price movements and adjust their strategies accordingly. For example, retail stocks often see a surge in the fourth quarter due to holiday shopping, while energy stocks might rise in the winter months due to increased heating demands.
Calculating seasonal patterns involves analyzing historical price data over multiple years to identify consistent trends during specific times of the year. This data is then averaged to determine the typical price movement during a given season. Advanced tools and software can facilitate this process, providing traders with precise seasonal charts and indicators. By correlating these historical patterns with A.I.-driven forecasts, traders can enhance their return on investment (ROI). When the seasonal analysis aligns with the A.I. forecast, it reinforces the trader’s confidence in the predicted trend, leading to more informed and potentially profitable trading decisions. This synergy between historical patterns and advanced predictive analytics offers a robust framework for maximizing trading efficiency and success.
Intermarket Analysis
Intermarket analysis is a trading strategy that examines the correlations between different financial markets to forecast price movements and improve trading decisions. It involves analyzing the relationships between various asset classes, such as stocks, bonds, commodities, and currencies, to understand how movements in one market can influence another. By observing these intermarket connections, traders can gain insights into broader market trends, identify potential turning points, and develop more comprehensive trading strategies. This holistic approach helps traders anticipate price movements based on the interplay of different market forces, ultimately enhancing their profitability.
John Murphy and Lou Mendelsohn were instrumental in popularizing intermarket analysis. John Murphy, through his seminal works like “Intermarket Technical Analysis,” illustrated how intermarket relationships can be utilized to predict market movements. He demonstrated that understanding the dynamics between different markets could provide traders with a competitive edge. Lou Mendelsohn, a pioneer in the development of trading software, integrated intermarket analysis into the VantagePoint software. His work emphasized the importance of intermarket data and its role in improving the accuracy of trading forecasts. Together, their contributions have significantly advanced the acceptance and application of intermarket analysis among traders.
Studying the 31 key drivers of price can uncover hidden gems within the markets. These drivers include factors such as interest rates, economic indicators, geopolitical events, and commodity prices, among others. By analyzing these diverse elements, traders can detect underlying forces that may not be immediately apparent through traditional technical analysis alone. Identifying these hidden drivers allows traders to make more informed decisions and potentially discover undervalued opportunities. For example, a sudden change in crude oil prices might impact not only energy stocks but also transportation and manufacturing sectors. By understanding these intricate connections, traders can position themselves to capitalize on emerging trends and improve their overall profitability.
Our Suggestion
The next Walmart earnings call is scheduled for August 17, 2024. This earnings call is critical as it will either validate or challenge Walmart’s progress in breaking into Amazon’s e-commerce dominance. Traders and investors will be closely watching the company’s online sales figures, growth metrics, and strategic insights shared during the call. A strong performance in e-commerce could signal Walmart’s successful implementation of its omnichannel strategy, leveraging both its vast network of physical stores and its expanding online presence. This approach allows Walmart to cater to customer preferences for either in-store or online shopping, making it a formidable competitor in the retail space.
Throughout its history, Walmart has been a trailblazer in maintaining its status as a low-price leader. By leveraging economies of scale and pioneering innovations in IT supply chain management, the company has consistently grown its business and set industry standards.
As Walmart continues to evolve, it is essential for traders to practice diligent money management on all their trades. Adhering to the guidance provided by advanced AI forecasts can further enhance trading decisions and strategies. By combining these insights with sound financial principles, traders can navigate the complexities of the market and capitalize on emerging opportunities.
Let’s Be Careful Out There.
It’s Not Magic.
It’s Machine Learning.
Disclaimer: THERE IS A HIGH DEGREE OF RISK INVOLVED IN TRADING. IT IS NOT PRUDENT OR ADVISABLE TO MAKE TRADING DECISIONS THAT ARE BEYOND YOUR FINANCIAL MEANS OR INVOLVE TRADING CAPITAL THAT YOU ARE NOT WILLING AND CAPABLE OF LOSING.
VANTAGEPOINT’S MARKETING CAMPAIGNS, OF ANY KIND, DO NOT CONSTITUTE TRADING ADVICE OR AN ENDORSEMENT OR RECOMMENDATION BY VANTAGEPOINT AI OR ANY ASSOCIATED AFFILIATES OF ANY TRADING METHODS, PROGRAMS, SYSTEMS OR ROUTINES. VANTAGEPOINT’S PERSONNEL ARE NOT LICENSED BROKERS OR ADVISORS AND DO NOT OFFER TRADING ADVICE.