| This week’s stock analysis is Energy Sector Stocks |
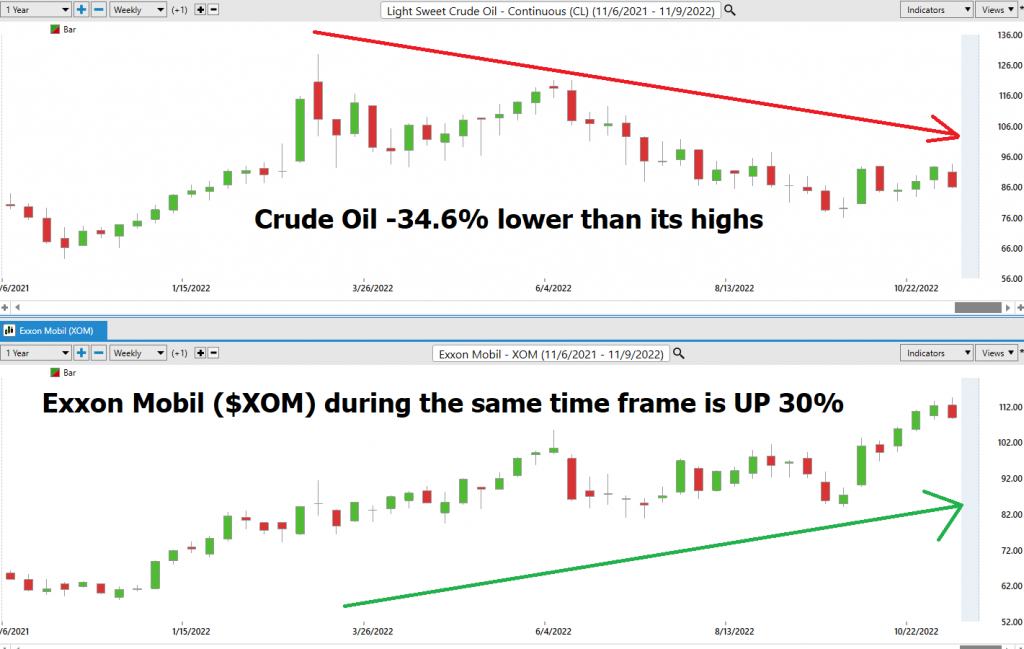
Two weeks ago, our Vantagepoint Stock of the Week was $XLE which is the Energy Sector SPDR. We purposely selected that ETF because of an anomaly we noticed in our charting. Essentially, ExxonMobil ($XOM) went to a new 52-week high while the Crude Oil market had dropped 40% from its all-time high.
At the time we stated:
“Sometimes when analyzing the markets, the best thing you can do is to look very closely at who is winning and who is losing. Success and failure leave huge footprints and the long-term price action of individual stocks and sectors of the marketplace provides very distinct clues as to where the money is flowing.”
We have been monitoring the energy sector very carefully over the past several weeks. It appears that the Energy sector stocks are acting like a safe haven from the troubles inherent in the rest of the financial marketplace. A safe haven asset is an investment that is expected to retain or increase in value during times of market stress or economic turmoil. You don’t have to guess what a safe haven asset is, it leaves a giant footprint that can be measured through its performance which is inverse to the broader financial complex.
I summarize the SAFE HAVEN ideology by simply asking the question: “WHO is WINNING?”
When tough markets arrive the most empowering question a trader can ask is, who is winning? Or what is working?
Traders might dislike the answers provided by the WHO IS WINNING question, but great trading is being very attuned to what is winning and what is losing. My experience has been that:
- Bad traders focus on what “SHOULD” happen.
- Great traders focus on what “IS” happening.
When “IS” and “Should’ meet, some pretty explosive things can happen and that is where we ultimately want to be as traders. But our focus has to be on what “IS” happening. Turn on the financial media today and their format is to draw parallels to previous episodes in market history in an attempt to draw technical similarities towards what is happening today. In my opinion, it is wishful thinking of the highest order. At the core of this financial programming is the messaging of what “should” happen next in the markets. It is analogous to praying to the ticker gods hoping they will bestow good fortune.
For their last quarter, Exxon Mobil (XOM) reported earnings of $4.45 per share, beating the pants off the Wall Street Estimate of $3.88 per share. This reflects a positive earnings surprise of 14.69%. Look out for XOM’s next earnings release expected on February 07, 2023. For the next earning release, Wall Street is expecting the company to report earnings of $3.21 per share, reflecting a year-over-year increase of 56.59%. These strong earnings provide a very distinct tailwind to the companies’ operations. It is quite logical to expect the entire energy sector to follow suit in this regard.
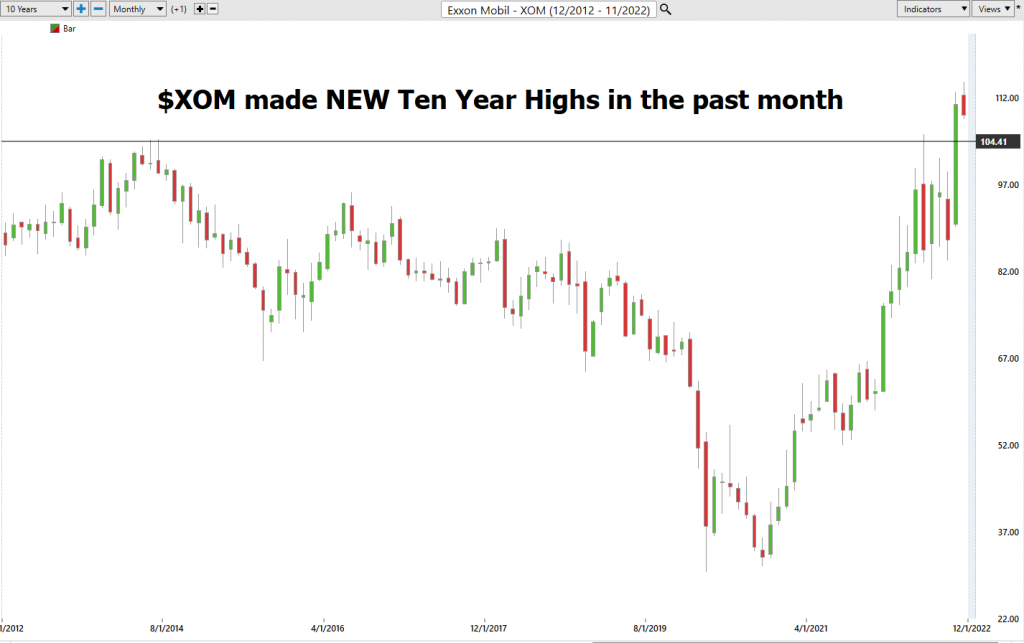
If I were to summarize this into one concise sentence it would be: PAY ATTENTION when a market is making new 10-year highs.
To provide a concrete example of this media phenomena, the financial news is absolutely obsessed about the Federal Reserve pivoting and changing their policy on interest rates. I view this type of programming as messaging of what SHOULD happen next. It can offer short-term comfort philosophically, but it is completely at odds with understanding where the money is being made.
Study the following table and you will quickly see how the performance of an asset completely vanquishes wishful thinking. These components of $XLE are clearly winning. Not only are they winning they are decimating the broader stock market indexes.
Instead of looking at these as financial instruments, I want you to think of them as employees of your portfolio. If you were going to hire three new employees for your portfolio, who would you try and recruit?
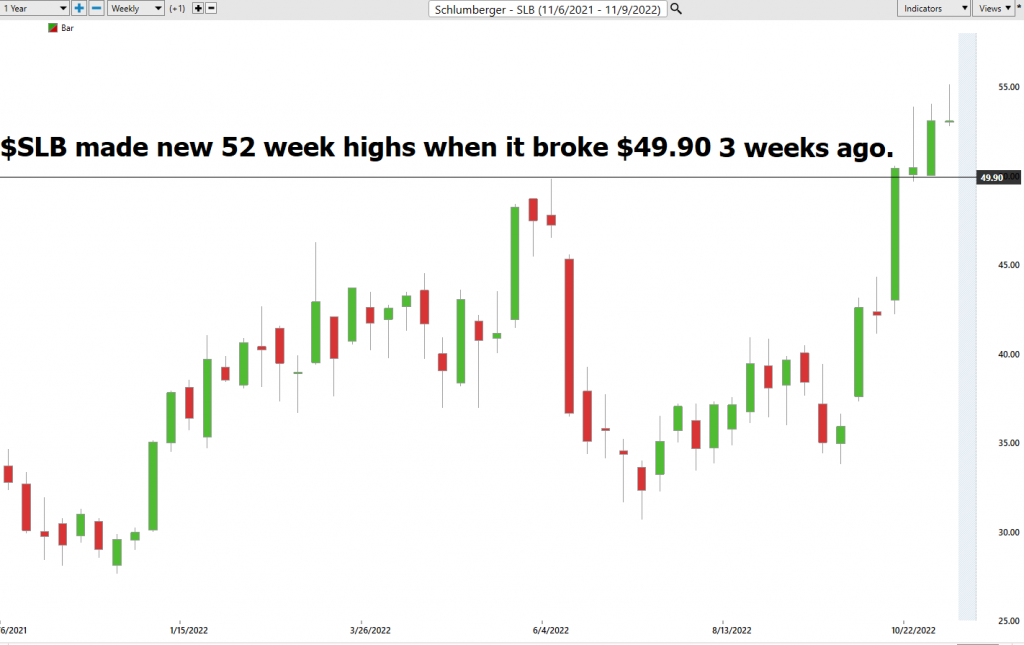
When I study the table below the choice is obvious . The clear-cut winners are $XOM, $COP, $SLB and $MRO. I would pay attention to their price action on any pullbacks and start scaling in LONG positions.
The laggards in this sector are $PXD, $EOG and $DVN.
The table below is worthy of your attention and study.
When you study the WINNERS, you come to appreciate that these SAFE HAVENS are very much in demand. As we often state: PAY ATTENTION. Many times, pullbacks in these assets are tremendous opportunities to participate in their longstanding UPTRENDS.
When you begin your analysis this way, you discover how easy it is to focus. That is primarily because you are in the markets where the MONEY is being made. By no means are these stocks risk-free. All of these companies have above average volatility. Top traders will put these stocks on their radar and use the artificial intelligence to fine tune their entries and exits.
All of these stocks are the components of the Energy Sector SPDR $XLE. By my way of thinking, my choice is to focus on the LEADERS as they will continue to LEAD.
We are going to do things a little differently in this analysis. We think the $XLE Energy Sector SPDR is a simple trading vehicle for traders who agree with our thesis. I would urge anyone to re-read our original $XLE analysis which can be found here. The two top holdings in the $XLE are $XOM and $CVX. Both of those companies have gone on to make new 52-week highs. However, the $XLE continues to test its 52-week high and pull back.
In this analysis, we will initially focus on $XLE for the sectors trend analysis, but then drill down into the leaders within the XLE ETF to locate specific trading opportunities within those market leaders. This bull market will have several meaningful pullbacks which will serve as wonderful long trading opportunities.
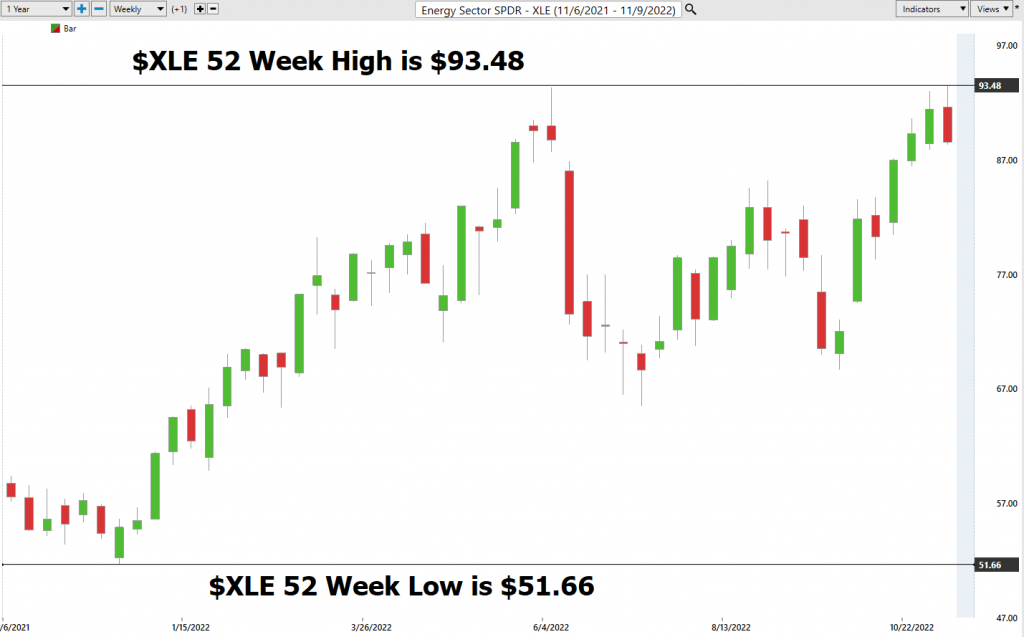
In fact, since our analysis 3 weeks ago, $XLE rallied from $87.423 to as high as $93.48 before correcting to $88.58. Whenever a stock or ETF makes a new 52 week high it is quite common for it to turn the old high into new support. Our opinion is that this is occurring at the present time. As we evaluate the entire sector, we think that after a brief consolidation, the UPTREND will resume, and this will result in much higher energy prices. The trigger will be when $XLE closes above $93.48. From there we expect that it will challenge the 10 years high.
Place these boundaries on your radar and pay attention. The probabilities favor that the energy sector will challenge its 52 weeks highs shortly and then move up to challenge its 10-year highs.
As the sector challenges its 10-year highs, great trading opportunities will result in the leading components of $XLE. Specifically, I am referring to $XOM, $CVX, $SLB and $MRO.
The declines in XLE have ranged from 11% and as much as 29.9%.
Market rallies ranged from 15.4% to 31.1%.
We expect this type of volatility to continue moving forward.
We expect the entire sector to be explosive when $XLE closes above its 52-week high at $93.48.
Follow The Leaders
The game “Follow the Leader” may seem trivial, but it actually teaches important trading and investing lessons. In this game, leaders set the pace and determine the direction, while followers blindly mimic their actions. In the financial markets, leaders can be represented by top performing stocks, industries, or even entire economies. As investors and traders, it is important to bet on strong leaders and follow their trends rather than chasing lagging stocks or markets. By doing so, we increase our chances of becoming winners like the leaders we emulate. On the flip side, blindly following poor leaders can result in losses and missed opportunities. As with the game Follow the Leader, it is crucial to choose our leaders wisely in investing, as they ultimately dictate whether we win or lose.
This principle is quite easy to detect by simply following the best performers in $XLE. You will often discover that the top performers in a sector are making new 52-week highs as well as new 10-year highs. While we agree that it requires great skill to be able to buy something at a 10 year high and make money, it is often much less risky than it sounds.
Winners Win.
Losers Lose.
Strong Trends Remain Strong Until They Become Weak.
This sounds simplistic until you do the homework and evaluate all of the charts in the sector and simply look at how they are performing in relation to the 52-week highs and 10-year highs.
Our analysis is simple in this regard. The Energy sector is acting like a safe haven. The leaders in this sector remain strong. Expect volatility but the probabilities favor a continuation of this UPTREND over the long term.
Vantagepoint A.I. Forecast (Predictive Blue Line)
On the following chart you will see the power of the VantagePoint Predictive blue line which determines the medium term trend price forecast.

The guidelines we abide by are as follows:
- The slope of the predictive blue line determines the trend and general direction of the trend.
- Ideally, the VALUE ZONE is determined to try and buy the asset at or below the predictive blue line.
Here is a snapshot of the last 6-8 weeks’ price action price action of these market leaders.
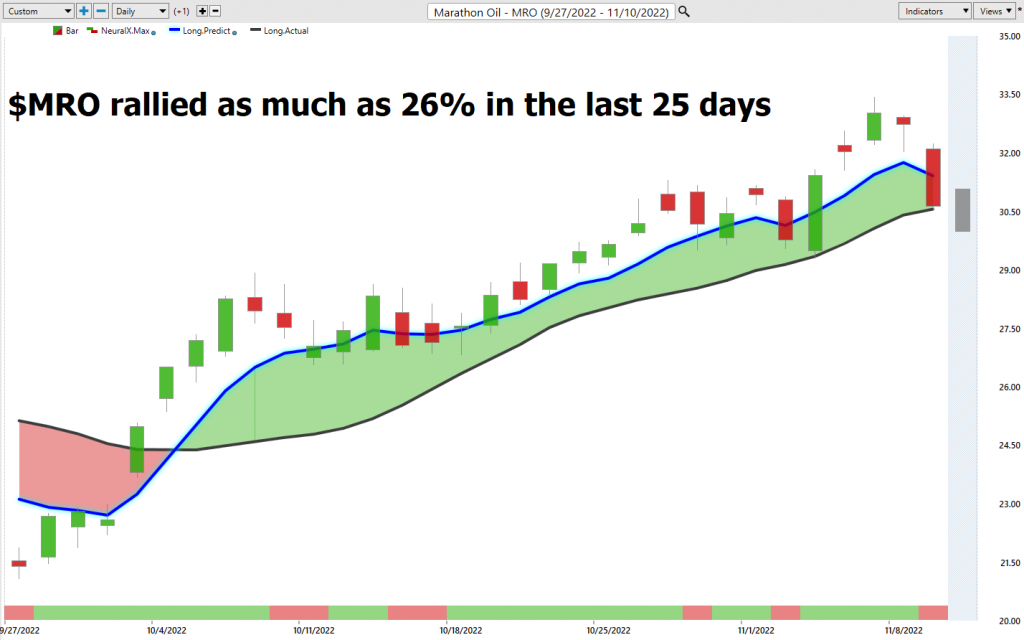

Fine Tuning Entries with The Neural Net Indicator
At the bottom of the chart is the Neural Network Indicator which predicts future short-term strength and/or weakness in the market. When the Neural Net Indicator is green it communicates strength. When the Neural Net is red it forecasts short-term weakness in the market.
A Neural Net is a computational learning system that uses a network of functions to understand and translate massive amounts of data into a desired output, consistently monitoring itself and improving its performance.
A neural network is a computer system modeled after the neural structure of the brain. This system is designed to recognize patterns and interpret data in a way that mimics the way humans learn. Neural networks are composed of interconnected neurons, which process information and relay it to other neurons in the network. The strength of the connections between neurons determines how well the network can learn from data. Neural networks were developed in the early 1950s, but only began to gain popularity in the 1990s with the advent of big data and machine learning. Today, neural networks are used in a variety of fields, including trading. Power traders use neural networks to help them make decisions based on large amounts of market data. The neural network’s ability to learn from data makes it an invaluable tool for traders who want to stay ahead of the market.
Whenever Power Traders are looking for statistically valid trading setups, they look for a DOUBLE confirmation signal. This signal occurs whenever the blue predictive line and the Neural Net at the bottom of the chart suggest the same future expected outcome.
We advocate that Power Traders cross reference the chart with the predictive blue line and neural network indicator to create optimal entry and exit points.
Traders look for confirmation on the Neural Net to position themselves LONG or SHORT in the market. In other words, when the A.I. forecast is green, and The Neural Net is green, that presents a buying opportunity.
Suggestion for Traders
Three weeks ago, we posed the question that $XOM was trading at 10-year highs, would the rest of the energy sector follow suit?
$XOM is the market leader in Energy. When the leaders lead our suggestion is to PAY ATTENTION.
$XOM is -77% correlated to the S&P 500 Index. It continues to move higher while the broader stock market languishes.
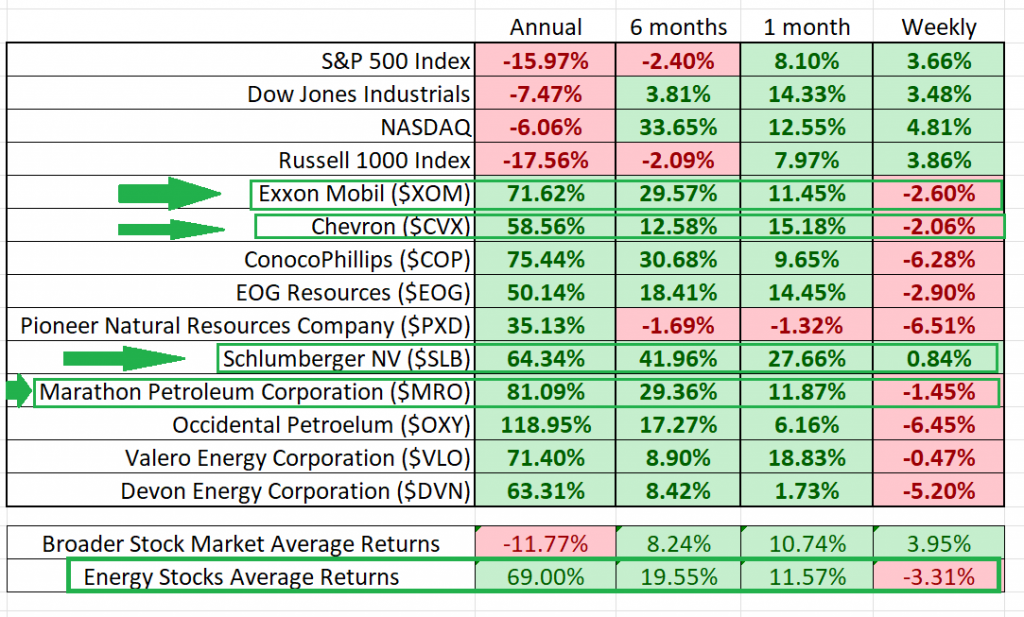
The following table illustrates that the Energy sector, which are the top 10 components of $XLE has massively outperformed the broader stock market indexes.
Energy is in a long-term bull market. We would recommend avoiding the laggards in this sector and placing a strong emphasis on the market leaders.
Power Traders should focus on the $XLE ETF for trend analysis and then drill down some of the more explosive components.
Use the following as guidance to fine tune your entries and exits.
- New 52-week high and low boundaries
- Vantagepoint A.I. Forecast (Predictive Blue Line)
- Neural Network Forecast
- Daily Range Forecast
Let’s Be Careful Out There!
Remember, It’s Not Magic.
It’s Machine Learning.
Disclaimer: THERE IS A HIGH DEGREE OF RISK INVOLVED IN TRADING. IT IS NOT PRUDENT OR ADVISABLE TO MAKE TRADING DECISIONS THAT ARE BEYOND YOUR FINANCIAL MEANS OR INVOLVE TRADING CAPITAL THAT YOU ARE NOT WILLING AND CAPABLE OF LOSING.
VANTAGEPOINT’S MARKETING CAMPAIGNS, OF ANY KIND, DO NOT CONSTITUTE TRADING ADVICE OR AN ENDORSEMENT OR RECOMMENDATION BY VANTAGEPOINT AI OR ANY ASSOCIATED AFFILIATES OF ANY TRADING METHODS, PROGRAMS, SYSTEMS OR ROUTINES. VANTAGEPOINT’S PERSONNEL ARE NOT LICENSED BROKERS OR ADVISORS AND DO NOT OFFER TRADING ADVICE.