| This week’s stock analysis is Pitney Bowes Corporation ($PBI) |
Pitney Bowes Corporation, listed under the ticker symbol $PBI on the New York Stock Exchange, is a global technology company and market leader in mailing, communications, and shipping solutions. Founded by Arthur Pitney & Walter Bowes as a mail meter stamping machine manufacturing business in 1920, they soon became pioneers in early mailing machines. Today they provide industry-leading machine-assisted solutions of e-commerce services with innovative software systems through artificial intelligence, data analysis and digital product offering. Pitney Bowes has almost 11,000 employees across 22 countries worldwide and revenue of close to 3 billion USD. Their ever-expanding range of products and services include connectivity solutions for businesses with metrics to measure performance, postage machines and mailing supplies such as envelopes, address labels, scales etc., while their B2C offerings contain virtual mailroom services along with home delivery solutions. With such extensive presence across industries today through their email flow management and audience segmentation tools allowing for marketing insight towards targeted audiences, it’s no surprise that over 1 million small businesses have trusted them for shipping funds since 1990. Pitney Bowes marks its centennial year in 2020 having come a long way since its inception! The company has a market cap of $643 million shares and trades on average 1.82 million shares a day.
In the European market, Pitney Bowes faces competition from several similar companies including Francotyp Postalia (FP), Neopost and Asendia. FP offers printing solutions for mail, parcels, and other items while Neopost provides hardware like postage meters, franking machines, and mail management software. Asendia is a joint venture between La Poste Group and Swiss Post International that specializes in international mail services. Pitney Bowes must also compete with major private global couriers such as FedEx and DHL for e-commerce services; both provide delivery options for online shoppers as well as pick-up/drop-off locations for customers looking for convenience. Finally, even though it isn’t a direct competitor, the US Postal Service should not be overlooked; it continues to offer low-cost mailing options that many consumers still find desirable. All of these companies provide direct competition to Pitney Bowes in terms of products, pricing, and service offerings. So, it’s important for Pitney Bowes to continuously monitor their competitors’ offerings to stay ahead of the game in this increasingly competitive digital marketplace.
In this weekly stock study, we will look at and analyze the following indicators and metrics which are our guidelines to dictate our behavior regarding any stock analysis.
- Wall Street Analysts’ Estimates
- 52-week high and low boundaries
- Vantagepoint A.I. Predictive Blue Line
- The Best Case – Worst Case Scenarios
- Neural Network Forecast
- Daily Range Forecast
- Intermarket Analysis
- Our trading suggestion
We don’t base our trading decisions on things like earnings or fundamental cash flow valuations. However, we do look at them to better understand the financial landscape that a company is operating under.
Wall Street Analysts’ Estimates
Because of the extremely low market cap of $PBI there are only a handful of analysts who actively cover the stock. The 4 analysts offering 12-month price forecasts for Pitney Bowes Inc have an average price target of $4.75 , with a high estimate of $6.00 and a low estimate of $3.50 . The average estimate represents a 31% increase from its most recent closing price of $3.63.
From this simple information we can determine two especially important things:
- There is a strong divergence of opinion.
- The broad consensus of analysts agree that $PBI is undervalued at current levels.
When you put these all together it is a recipe for great volatility.
52-Week High and Low Boundaries
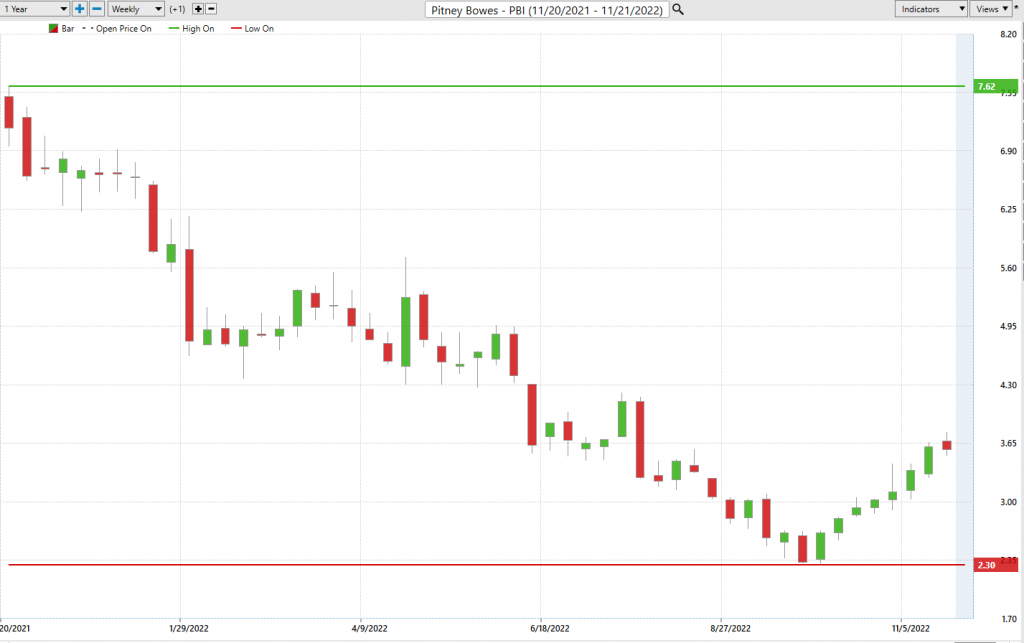
Looking at the Long-Term chart of $PBI provides us with the 52-week high and low boundaries.
Over the past year we have seen $$PBI trade as low as $2.30 and as high as $7.62. The annual trading range has been $5.32.
Currently the stock is trading at its 25 th percentile .
What we also like to do is to divide the current price by the annual trading range to get a measure of annualized volatility. This metric tells us what we can expect over the next 12 months should it be like the last 12 months. Currently the annualized volatility in $PBI is 146% which is exceptionally high.
Simply looking at the chart you can see the volatile journey it has been on.
This journey is further exaggerated when we study the 10-year monthly chart. By doing so we can see and determine that the 10-year low is $2.02 and that the stock had sold off over 90% from its highs. What this tells me is that searching for value amongst traders and investors is coming back in style. In an attempt to minimize risk, traders are looking at companies and charts that are historically undervalued as a means of minimizing risk. On the 10-year monthly chart you can easily see that $PBI has been trading in the bottom 15% of its trading range for the last 10 years.

Best Case – Worst Case Scenario
When we study the long term 52-week chart we can look at the best case and worst-case scenarios just to get an eyeball perspective of the risk and volatility of this asset. This is worth doing anytime you invest or trade to monetarily understand what the potential risks and rewards have been over the past year. All that we are looking to analyze is the distance and speed between highs and lows over a given year.
It is worth doing this type of baseline analysis because it allows you to visually ascertain how quickly a stock drops in comparison to the speed with which it moves higher.
First, we do the Best-Case analysis:
Followed by the WORST-CASE Analysis:
This initial analysis lets us see how quickly $PBI falls in comparison to its rallies. In this regard we can quickly see that the declines for the most part are larger than the rallies.
Next, we want to compare the performance of $PBI to the major broad market indexes.
So, in $PBI we have an asset which is much more volatile than the broader market and has massively underperformed the broader market. Over a weekly and monthly time frame it has done better than the stock market indexes.
Earnings dates have also been a key driver in $PBI price action. The next $PBI earnings call is slated for January 30, 2023.
Vantagepoint A.I. Forecast (Predictive Blue Line)
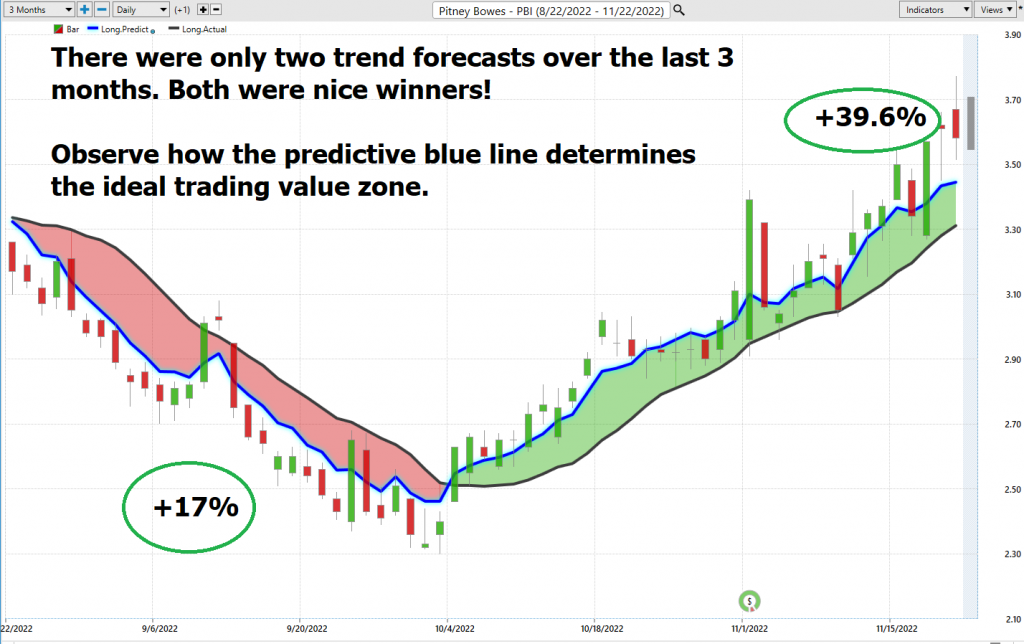
On the following chart you will see the power of the VantagePoint Predictive blue line which determines the medium term trend price forecast.

The guidelines we abide by are as follows:
- The slope of the predictive blue line determines the trend forecast and general direction of $PBI
- Ideally, the VALUE ZONE is determined to try and find buy opportunities at or below the predictive blue line, or to sell opportunities above the predictive blue line during a downtrend.
Naturally when the predictive blue line slopes lower traders would be anticipating lower prices and either moving to the sidelines or hedging their positions.
Using VantagePoint Software and the artificial intelligence, traders are alerted to trend forecasts by monitoring the slope of the predictive blue line.
The predictive blue line, however, utilizes the VantagePoint-patented Neural Network and Intermarket Analysis to arrive at its value. It looks at the strongest price drivers of an asset through artificial intelligence and statistical correlations to determine its value.
What is fascinating about the chart is that by simply estimating the chart we can see that the slope of the predictive blue line is like the NORTH STAR in providing directional guidance to traders. In other words, don’t fight the trend . The trading opportunities might last a few days or several weeks, but the focus is always to keep the trader on the right side of the right trend at the right time. The blue line ALWAYS determines the forecast and the best move forward.
The DOWN Move saw maximum gains of 17% and the UP Move has seen maximum gains of 39.6%.
Fine Tuning Entries with The Neural Net Indicator
At the bottom of the chart is the Neural Network Indicator which predicts future short-term strength and/or weakness in the market. When the Neural Net Indicator is green it communicates strength. When the Neural Net is Red it is forecasting short term weakness in the market. When it is yellow it is anticipating sideways prices.
A Neural Net is a computational learning system that uses a network of functions to understand and translate massive amounts of data into a desired output, consistently monitoring itself and improving its performance.
Neural networks in trading are artificial intelligence (AI) systems that use data to simulate the functioning of the human brain. These networks consist of nodes, or neurons, which are like individual components or “links” in the network. Each neuron communicates with other neurons in the network and learns from historical prices. The neurons then give feedback information which helps identify patterns and trends in financial markets. In more complex networks, usually used by large institutions such as hedge funds and banks, various layers of artificial intelligence can be deployed to make predictions about future market dynamics such as price movements, liquidity flows and overall economic shifts. Neural networks can also consider external factors like technical variables such as volume and volatility to form more accurate predictions on trading direction. As neural networks become increasingly sophisticated, they can help traders make better decisions more quickly over time without having to manually analyze huge amounts of data. Therefore, they are well-suited for both manual and automated trading strategies across various asset classes.
Neural Networks are essentially trainable algorithms that emulate aspects of the human brain. This means they can be trained based upon criteria for assessing risk and potential reward to determine the best move forward. This allows them to make high probability forecasts based on available historical information .
Neural networks are not as widely used as other types of trading. But they are likely to become more popular in the future.
We advocate that Power Traders cross reference the chart with the predictive blue line and neural network indicator to create optimal entry and exit points.
For the serious trader, neural networks are a next-generation trading tool that can detect subtle non-linear interdependencies and patterns that traditional methods of technical analysis are unable to uncover.
Traders look for confirmation on Neural Net to position themselves LONG or SHORT in the market. In other words, when the A.I. forecast is green, and The Neural Net is green, that presents a buying opportunity.
The inverse is also true, when the A.I. forecast is red and the Neural Net is red, that is a selling opportunity. The arrows on the chart below highlight the trading zones where Power Traders would’ve been using double confirmation to BUY in cross referencing the A.I. forecast with the NeuralNet.
Power Traders are always looking to apply both the Neural Network and A.I. to the markets to find statistically sound trading opportunities.
VantagePoint Software Daily Price Range Prediction
We will zoom in in on the last 3 months of price action so that you can see for yourself how the a.i. and machine learning combine to create a very accurate daily price range forecast that keeps traders focused on optimal trade placement.
One of the powerful features in the VantagePoint Software which Power Traders use daily is the Price Range prediction forecast.
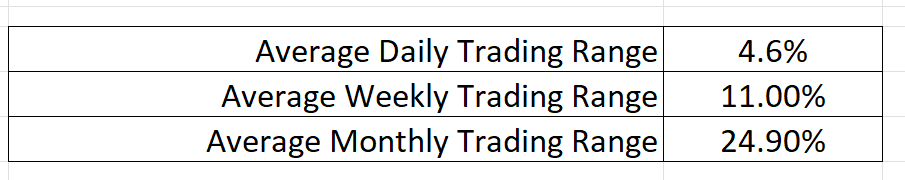
Here are the broad range of trading metrics over the past year.
These metrics tell you statistically what has occurred. What traders must always do is determine how to put this knowledge into action.
The Vantagepoint A.I. daily range forecast is what permits Power Traders to truly fine tune their entries and exits into the market.
Every day traders are faced with the anxiety and frustration of wondering where they should be looking to buy and sell the market. VantagePoint’s A.I. makes this decision super easy with the Daily Price Range Forecast.
This chart helps traders decide where stop placement should occur. Observe how placing protective sell stops below the dark line on the chart was a powerful way to minimize risk on this trade.
See how the upper and lower bands of the price range forecast for a very clear channel of trading activity as well. Swing traders are always looking for buying opportunities towards the bottom of the predicted channel and try to find selling opportunities above the top band.
Intermarket Analysis
Power lies in the way we respond to the truth we understand.
One of the supremely important questions in trading is what is driving the price? Headlines often create interesting narratives. But these “stories” only capture the imagination. Traders want and need to understand the cause and effect of price movement.
The only way to get an answer to this important question is through intermarket analysis which looks at statistical price correlations of assets.
We live in a global marketplace.
Everything is interconnected.
Intermarket analysis is a technique that can help traders identify relationships between financial markets and instruments, leading to potential trading opportunities. This process involves analyzing price movements of different asset classes across markets to gain insight into the market’s overall behavior. By understanding how different assets interact with one another, traders can recognize correlations between stocks, bonds, commodities, currencies, and other tradable securities. Furthermore, intermarket analysis gives traders valuable information about supply and demand in the global marketplace; this way, they are able to accurately gauge the key drivers of price for a given asset or instrument. Intermarket analysis also helps in decision-making by giving traders insight into both lagging and leading trends – such as current trading patterns versus correlations established over a longer period of time. Ultimately, Intermarket analysis provides traders with an on-going means of tracking relative value between markets for more consistent and profitable trades.
Analyzing intermarket relationships is a complex process that leaves no stone unturned.
Interest rates, Crude Oil Prices, and the volatility of the Dollar amongst thousands of other variables affect the decisions companies must make to flourish and prosper in these particularly challenging times. Trying to determine what these factors are is one of the huge problems facing investors and traders.
You always have a choice. You can tune in to the talking heads in the media who spin talking points which promote fear. Or you can rely on facts to base your decision making on.
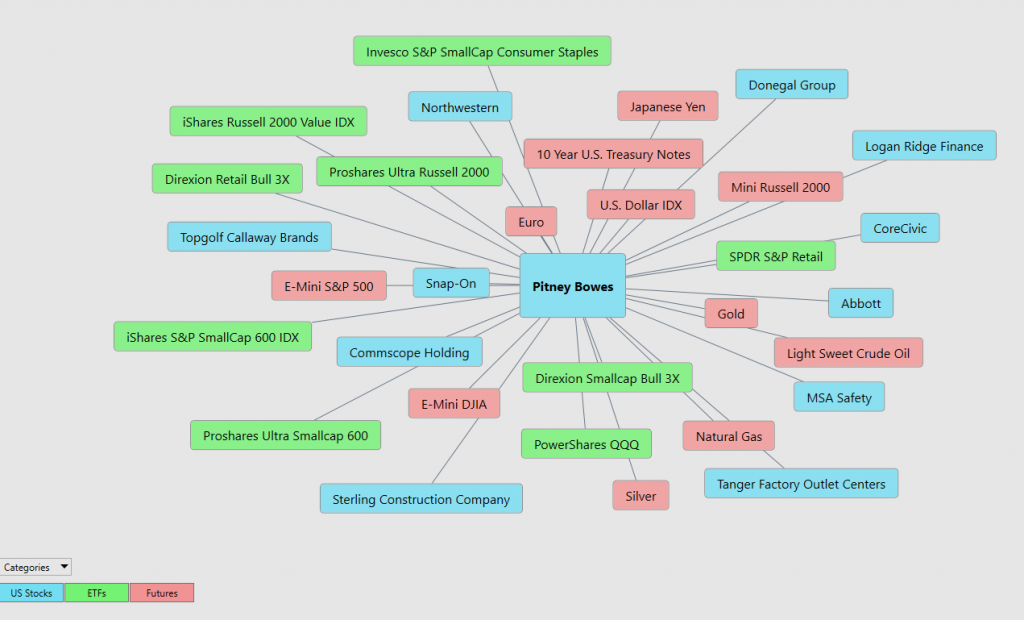
Within the following Intermarket Analysis graphic, you will see the 31 markets that are the key drivers to $PBI’s price. There is great value to be had in studying and understanding the key drivers of $PBI’s price action. This graphic provides a microcosmic view of what factors have been driving $PBI’s higher.
Suggestion for Traders
Charts are the footprints of money flows.
In an up market the footprint left on the chart is that the market is making higher high prices and higher lows.
In a down market the footprint on the chart is a series of lower highs and lower lows.
Using the Vantagepoint Software I can zoom in on this time frame and view the artificial intelligence and Neural Net forecast which confirms the predictive trend analysis.
We think PBI is a trading vehicle for short term swing trades.
Our explanation for its recent price action is that it has been one of the most beaten-up stocks of the past year. It solidly held its 52 week low and upon doing though it attracted value traders and investors looking for a quick rebound.
Moving forward, we like short swing trading opportunities in this asset focusing on the Vantagepoint A.I. Daily range forecast.

When we focus on the statistical averages on the daily, weekly, and monthly time frames there is massive opportunity, but it is accompanied by greater than normal risk.
Our recommendation is to follow the A.I. trend analysis as outlined in this stock study and practice good money management on all trades.
We will re-evaluate based upon:
- New Wall Street Analysts’ Estimates
- New 52-week high and low boundaries
- Vantagepoint A.I. Forecast (Predictive Blue Line)
- Neural Network Forecast
- Daily Range Forecast
The trend in $PBI is UP. We will look to the bottom of the daily range forecast to position ourselves LONG with tight stops for short-term trades.
Let’s Be Careful Out There!
Remember, It’s Not Magic.
It’s Machine Learning.
Disclaimer: THERE IS A HIGH DEGREE OF RISK INVOLVED IN TRADING. IT IS NOT PRUDENT OR ADVISABLE TO MAKE TRADING DECISIONS THAT ARE BEYOND YOUR FINANCIAL MEANS OR INVOLVE TRADING CAPITAL THAT YOU ARE NOT WILLING AND CAPABLE OF LOSING.
VANTAGEPOINT’S MARKETING CAMPAIGNS, OF ANY KIND, DO NOT CONSTITUTE TRADING ADVICE OR AN ENDORSEMENT OR RECOMMENDATION BY VANTAGEPOINT AI OR ANY ASSOCIATED AFFILIATES OF ANY TRADING METHODS, PROGRAMS, SYSTEMS OR ROUTINES. VANTAGEPOINT’S PERSONNEL ARE NOT LICENSED BROKERS OR ADVISORS AND DO NOT OFFER TRADING ADVICE.