| This week’s stock analysis is American Superconductor – ($AMSC) |
American Semiconductor is a global provider of power solutions and digital infrastructure-as-a-service. With a focus on low-carbon, sustainable power systems, $AMSC offers an array of products and services capable of addressing the daily energy needs of their customers and allowing them to transition to reliable green energy sources efficiently and affordably. Additionally, $AMSC provides innovative design support for companies worldwide, helping them develop agile digital infrastructures that can take advantage of technologies like cloud storage, machine learning, and artificial intelligence. Furthermore, AMSC works with leading technology providers – such as IBM and Intel – to ensure that their services are top quality every step of the way.
American Superconductor Corporation was founded in 1987 by Greg Yurek. For three decades, the Company has emphasized developing advanced technology in the areas of wind energy systems, power electronics, superconductors, and utility systems to help lead the move toward a global green economy. The enterprising spirit that drove Yurek has remained an integral part of American Superconductor Corporation ever since, continuing to drive innovation that supports strong long-term growth.
American Superconductor is based out of Devens, Massachusetts and employs just over 1,000 people. It is a growth-oriented technology company that specializes in innovative solutions for the energy industry. Through decades of development and investment, it has become an international provider of components, products and services for smarter and more efficient energy grids around the world. Its offerings span advanced software systems for remotely managing power grids to advanced electrical transmission equipment designed for stability and reliability – all backed by data-driven analytics that provide valuable insights into energy usage. With customers spanning from government entities to power companies, American Superconductor has established itself as one of the leading global providers in the growing business of smart grid solutions.
They find themselves in direct competition with some of the world’s largest corporations such as Siemens, General Electric, Caterpillar, and Mitsubishi Heavy Industries. Meanwhile, they also compete with smaller companies on a regional level such as China’s Guodian Technology & Environment Group Corporation Ltd., which specialize in electric power supply and energy efficiency projects. Additionally, there is also emerging competition from newer companies such as Taiwanese solar-cell maker Motech Industries Inc. With so many firms trying to reach their share of the growing market share for sustainable energy solutions, it promises to be an interesting battle going forward for American Superconductor ($AMSC).
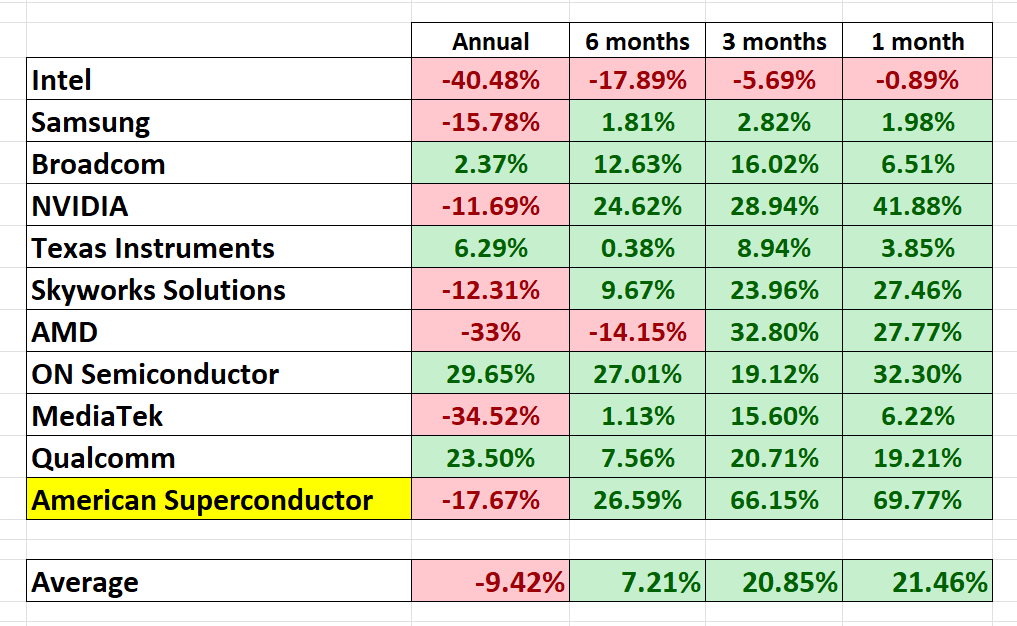
Look at the following grid of the 8 largest semiconductor companies in the world and their performance over multiple times frames. As you peruse the grid you can quickly see that 75% of the performance has been positive. The yearly metrics are overshadowing the recoveries that have occurred in the semiconductor niche over the past 6 months. Based upon this premise we started looking at bargains in this sector anticipating that Wall Street would buy them up quickly based upon their valuations.
The semiconductor stocks led the market lower in late 2021 due to supply chain bottlenecks. With a recovery in this sector underway there is much enthusiasm that this could spillover into the entire economy. We will wait and see. The annual performance figures still weigh heavily on these stocks.
From a fundamental perspective, revenue is forecasted to grow by 19.46% per year . However the company is not profitable at the present time and is not forecasted to become profitable over the next three years.
$AMSC is expected to grow earnings by 45.7% per year. Furthermore, the company has also diluted its shareholders. When a company decides to raise capital through the stock exchange, shareholders can experience a dilution of their shares. This is because new stock is issued, increasing the total number of shares outstanding and reducing the proportion of shares held by existing shareholders. The effect is like pouring more water into the same glass; each sip becomes slightly less concentrated than before. When a company issues new stock, not only does it increase the number of shares available, but it may also push down the price of each share since there is now more supply than demand for them. As a result, shareholders see their percentage ownership in a company shrink due to dilution.
$AMSC is a small cap company with a market capitalization of only $187.8 million dollars. This status means that it is very volatile, and we should anticipate great volatility in any investment or trading decisions we make on this asset.
In this weekly stock study, we will look at and analyze the following indicators and metrics which are our guidelines to dictate our behavior regarding any stock analysis.
- Wall Street Analysts’ Estimates
- 52-week high and low boundaries
- Vantagepoint A.I. Predictive Blue Line
- The Best Case – Worst Case Scenarios
- Neural Network Forecast
- Daily Range Forecast
- Intermarket Analysis
- Our trading suggestion
We don’t base decisions on things like earnings or fundamental cash flow valuations. However, we do look at them to better understand the financial landscape that a company is operating under.
Wall Street Analysts Ratings
The 4 analysts offering 12-month price forecasts for American Superconductor Corp have a median target of 10.00, with a high estimate of 13.00 and a low estimate of 7.00 . Since the most recent close on $AMSC is $6.57 we can conclude that all of the analysts consider the stock to be undervalued.
52 Week High and Low Boundaries
Over the last 52 weeks $AMSC has traded as high as $10.14 and as low as $3.20. This provides us with an annual trading range of $6.94.
We always pay attention to where we are in relation to the 52-week trading range. Currently, the market is trading at the 49 th percentile of its annual range.
We strongly advise that traders pay primary attention to where we are in the 52 week trading range whenever we look to trade a stock. $AMSC appears to have new long-term support at the most recent 52 week low.
When we zoom out and look at the 10-year chart we can see that $AMSC has suffered greatly. The stock had fallen in excess of 90% from its all-time high 18 months ago at $31.78.
The narrative on $AMSC supports the bargain-hunting thesis. On the 10-year chart the stock is still only trading at the 13 th percentile even after its impressive rally over the past 6 weeks.
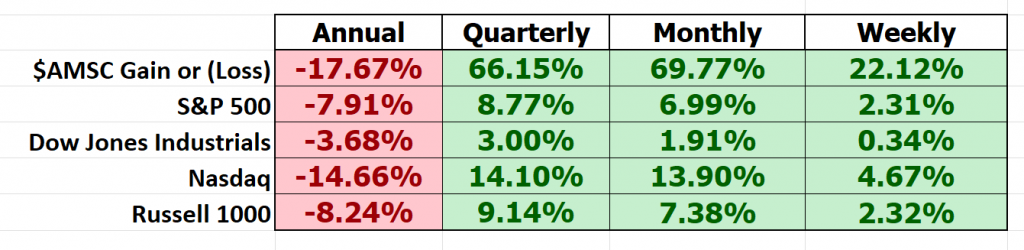
Lastly, we compare the performance of $AMSC to the broader stock market indexes.
This comparison allows us to see that $AMSC is much more volatile than the broader market indexes.
The VantagePoint Analysis
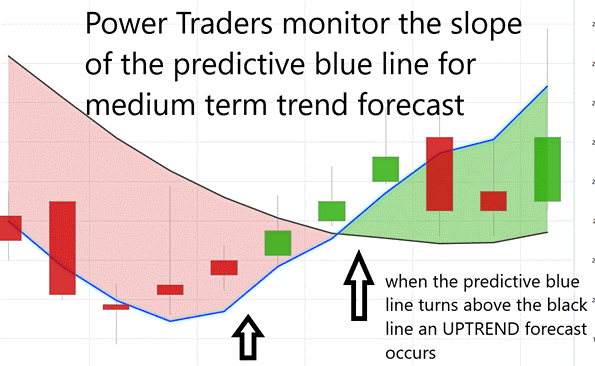
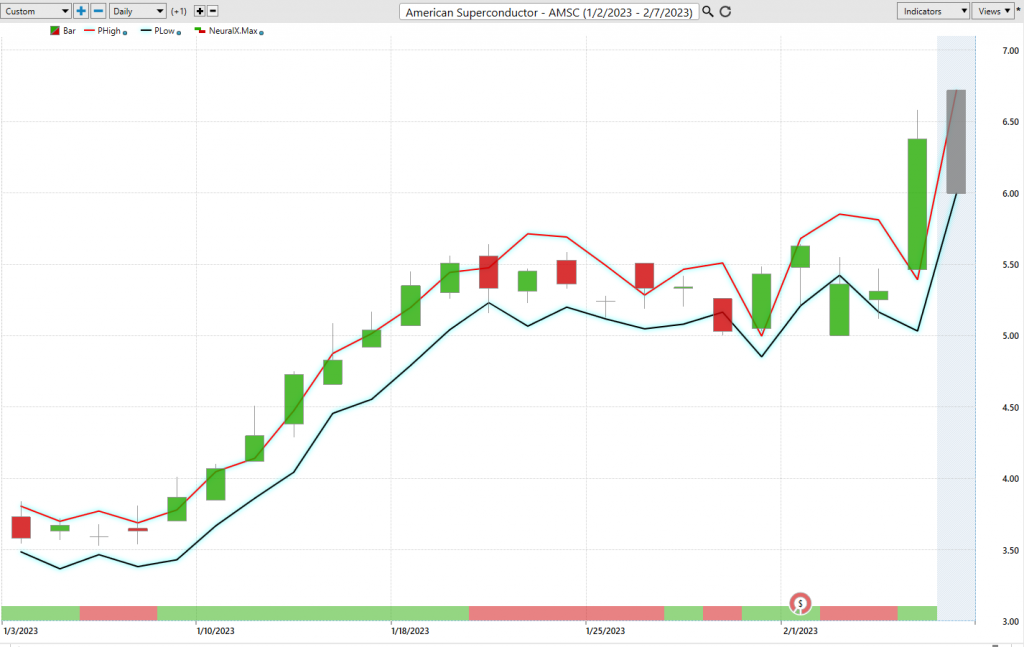
Using VantagePoint Software and the artificial intelligence, traders are alerted to trend forecasts by monitoring the slope of the predictive blue line. The black line is a simple 10-day moving average of prices which simply tells you what has occurred in the market. The predictive blue line also acts as a value zone where in uptrends traders try to purchase the asset at or below the blue line.
In studying the chart above pay close attention to the relationship between the black line and predictive blue line. The black line is just a simple 10 day moving average. It’s calculated by taking the closing prices of the last 10 days and dividing that sum by 10. All that the black line tells you is what has occurred. It tells you where prices have been and what the average price over the last ten days is.
The predictive blue line, on the other hand utilizes that VantagePoint patented Neural Network and Intermarket Analysis to arrive at its value. It looks at the strongest price drivers of an asset through artificial intelligence and statistical correlations to determine its value.
Whenever we see the predictive blue line move above the black line, we are presented with an UP entry opportunity.
Power traders use the predictive blue line to help to determine both the value zone as well as the trend direction.
Observe how the SLOPE of the predictive blue line started moving higher a few days previous to its moving above the black line.
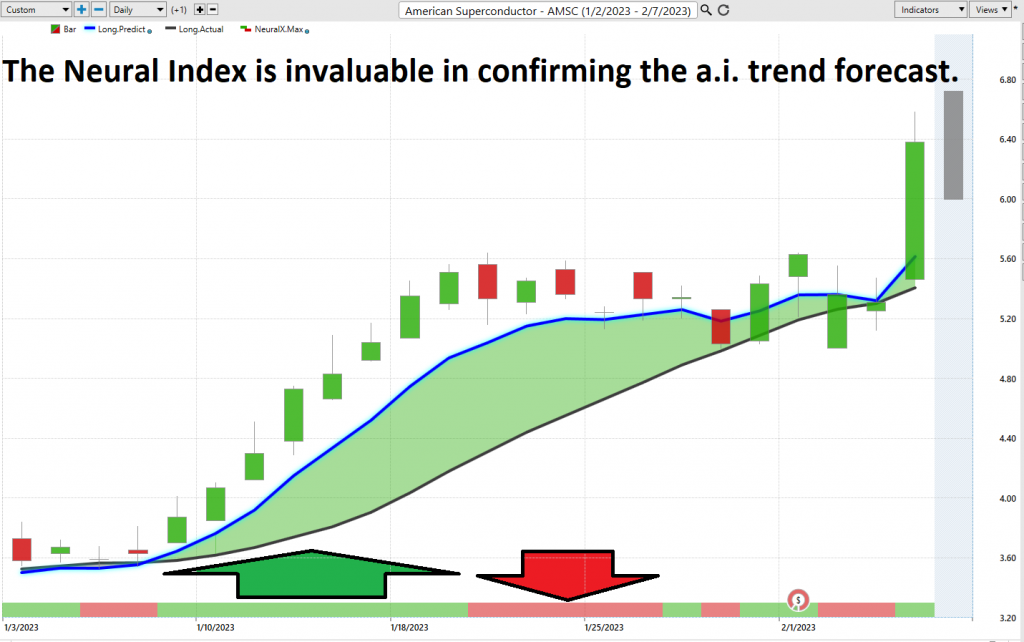
Fine Tuning Entries With The Neural Index Indicator
At the bottom of the chart is the Neural Network Indicator which predicts future strength and/or weakness in the market. When the Neural Net Indicator is Green, it communicates strength. When the Neural Net is Red it is forecasting short term weakness in the market.
Trading with neural networks can give investors much increased accuracy and efficiency. This is primarily because of the large amount of data they can effectively process and evaluate. A neural network is a form of artificial intelligence that models itself after the human brain: it takes in information, processes it, and forms new conclusions based on past patterns. The process of training a neural network is complex, but the resulting accuracy and insight in decision-making far outweighs any difficulty associated with its implementation into trading strategies. Neural networks have the potential to dramatically increase profits for both seasoned traders and beginners alike. By leveraging the power of a neural network, investors can gain an edge over even the most experienced market participants.
These models measure how strongly different factors influence one another, allowing traders to make decisions based on more than just intuitive guesses about where the markets will go. Neural networks provide data analysis features such as pattern recognition and anomaly detection, enabling traders to recognize trends in stocks and react swiftly to emerging opportunities. Ultimately, neural networks offer invaluable advantages to any trader looking to get ahead in trading.
We advocate that Power Traders cross reference the chart with the predictive blue line and neural network indicator to create optimal entry and exit points.
Power Traders are always looking to apply both the neural network and A.I. to the markets to find statistically sound trading opportunities.
VantagePoint Software Daily Price Range Prediction
One of the powerful features in the Vantagepoint A.I. Software which Power Traders use daily is the Daily Price Range prediction forecast.
This forecast is what permits Power Traders to truly fine tune their entries and exits into the market.
Here are the AVERAGE trading range metrics for $AMSC on the daily, weekly and monthly time frames.
You can quickly see and understand this $AMSC is a very volatile stock.
Here is the price chart of $AMSC during the most recent runup featuring the Daily Price Range forecast and the Neural Net Indicator.
In summary, the trend turned up. Prices have surged since that forecast and the trend remains firmly UP. Traders have had numerous opportunities to purchase $AMSC towards the lower end of the daily price forecast to fine tune their entries.
Observe how the predictive price low also provided numerous short term entry opportunities for traders to buy $AMSC as it was trending higher.
Intermarket Analysis
What makes Vantagepoint Software truly unique is its ability to perform Intermarket analysis and to locate those assets which are most interconnected that are responsible for driving the price of $AMSC higher or lower.
Intermarket analysis in trading is the process of analyzing market relationships between various financial markets. In most cases, this type of analysis focuses on stocks, bonds, commodities, and currencies. By tracking the correlations and divergences between these financial markets, traders can gain important insights into which asset classes are outperforming others, allowing them to better gauge overall trends in the broader economic environment and anticipate potential opportunities for investing. Intermarket analysis also helps traders interpret the dynamics of these markets relative to each other – a key factor in uncovering trends and making better trading decisions.
Intermarket analysis is a powerful strategy for traders to gain insight into correlations between different asset classes that could be influential in trading decisions. By understanding correlations between markets, traders can get a better sense of key price drivers and identify opportunities that would otherwise be invisible by looking at just one market at a time. With intermarket analysis, traders can develop more comprehensive strategies to capitalize on correlations between markets while hedge against potential losses. Ultimately, this approach to trading offers greater insight into the driving forces of different markets and provides the potential for improved returns over time.
Studying the charts can always provide objective realities in terms of locating support and resistance levels which become truly clear on a chart. But we live in a global marketplace. Everything is interconnected. The billion dollar question for traders is always what are the key drivers of price for the underlying asset that I am trading?
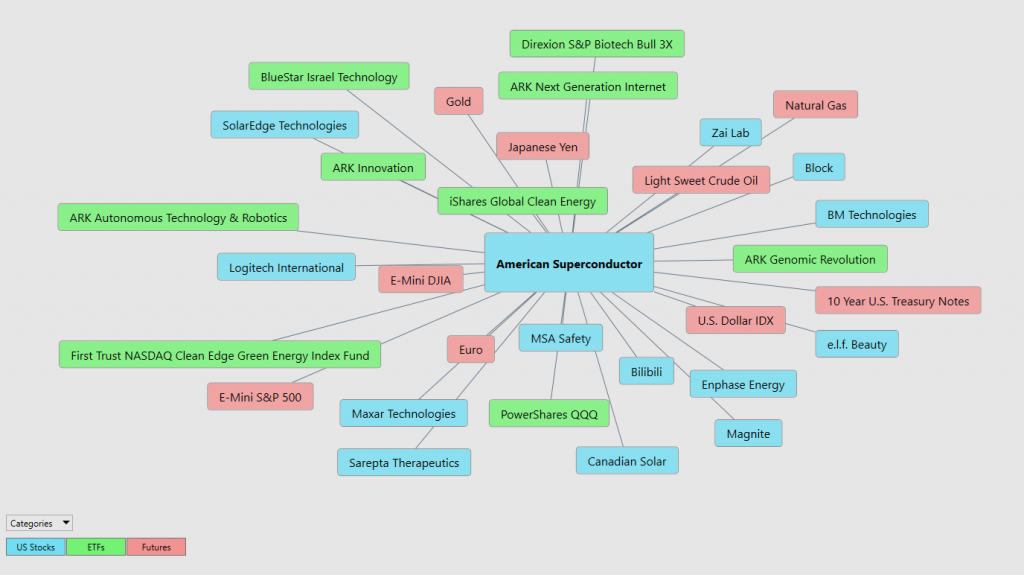
These intangibles are invisible to the naked eye yet show very high statistical correlations.
$$AMSC is inversely -72% correlated to the U.S. Dollar on a weekly basis. This means that as the U.S. dollar falls the probability favors a price increase in $AMSC, and vice versa.
Small changes in Interest rates, Crude Oil Prices, and the Volatility of the dollar amongst thousands of other variables affect the decisions companies must make to survive in these challenging times. Trying to determine what these factors are is one of the huge problems facing investors and traders.
When evaluating a stock like $AMSC for trading purposes, correlations should be an important area of consideration. Volatility correlations can provide insight into how the stock is likely to behave relative to other assets. To go further, it is also important to understand the key price drivers that cause the stock to move, as this will help reveal opportunities to capitalize on upcoming changes in price. The most effective way to evaluate a stock involves understanding correlations and being intimately familiar with the key price drivers behind it.
There is great value to be had in studying and understanding the key drivers of $AMSC price action.
By doing so you can often see which ETF’s are most likely to acquire $AMSC as well as uncovering other industries which affect $AMSC price movement.
Conclusion
$AMSC is undervalued at the present time and the trend is firmly up. The consensus of analysts opinions shows that $AMSC is fairly valued around $10.
Swing trading is a strategy that involves buying and selling stocks or other assets over various intervals for relatively short periods of time. In this stock study we have focused our attention on fundamental valuations, volatility and the a.i. trend analysis and daily trading range forecast.
By attempting to capture changes in market trends over shorter time frames, swing traders can often achieve greater returns than what could be gained through long-term investing alone. In addition, swing trading can help limit risk exposure by allowing traders time to assess the potential downsides of any given trade whilst also potentially being able to capitalize on numerous trading opportunities within a single day. For these reasons, swing trading should certainly be a viable strategy for anyone looking to maximize their trades in the stock market.
$AMSC could be a great swing trading stock. Tremendous volatility. Our major concern and warning for traders is trading involves risk and recognizing that it is a small cap stock and liquidity and potential large price spreads are an issue in trading these types of assets.
The trend is UP.
Volatility is HIGH. Trading $AMSC is not for the uninitiated.
Our advice: Follow the A.I. trend analysis and practice good money management on all of your trades.
$AMSC deserves to be on your trading radar.
Let’s Be Careful Out There!
Remember, It’s Not Magic.
It’s Machine Learning.
Disclaimer: THERE IS A HIGH DEGREE OF RISK INVOLVED IN TRADING. IT IS NOT PRUDENT OR ADVISABLE TO MAKE TRADING DECISIONS THAT ARE BEYOND YOUR FINANCIAL MEANS OR INVOLVE TRADING CAPITAL THAT YOU ARE NOT WILLING AND CAPABLE OF LOSING.
VANTAGEPOINT’S MARKETING CAMPAIGNS, OF ANY KIND, DO NOT CONSTITUTE TRADING ADVICE OR AN ENDORSEMENT OR RECOMMENDATION BY VANTAGEPOINT AI OR ANY ASSOCIATED AFFILIATES OF ANY TRADING METHODS, PROGRAMS, SYSTEMS OR ROUTINES. VANTAGEPOINT’S PERSONNEL ARE NOT LICENSED BROKERS OR ADVISORS AND DO NOT OFFER TRADING ADVICE.