This week’s stock analysis is Netflix – ($NFLX)
Netflix ($NFLX), the renowned entertainment company dominating the online streaming industry, continues to captivate audiences worldwide with its extensive library of movies, TV shows, documentaries, and digital media content. Operating as a subscription-based streaming platform, Netflix generates revenue through membership fees paid by its devoted users.
Founded in 1997 by Reed Hastings and Marc Randolph, Netflix initially gained popularity as a DVD-by-mail service, revolutionizing the way customers rented and received DVDs conveniently at their doorstep. However, in a pivotal move that would redefine the company’s trajectory, Netflix introduced its streaming service in 2007, ushering in a new era in the entertainment industry. With streaming taking center stage, DVD rentals gradually took a back seat in most regions.
At present, Netflix boasts a global workforce of approximately 9,000 employees who contribute to the company’s continued success. However, the streaming industry is fiercely competitive, with several notable rivals vying for market share. Among the key contenders are Amazon Prime Video, Disney+, Hulu, and HBO Max, all offering subscription-based streaming services and investing in original content to entice and retain users.
For Netflix, the biggest opportunity lies in its global expansion and its ability to acquire and produce high-quality content. As streaming services surge in popularity worldwide, Netflix can seize new markets and cultivate a broader user base. Furthermore, by investing in original programming and striking deals with renowned content creators, Netflix can set itself apart from competitors and maintain a loyal subscriber base.
Nevertheless, Netflix faces certain risks associated with its business model. One significant risk is the intensifying competition within the streaming industry. As more companies enter the market, the battle for subscribers and exclusive content rights escalates, potentially leading to higher costs and diminished profitability. Additionally, Netflix heavily relies on licensed content, which exposes it to the risk of losing popular shows and movies as content providers opt to launch their own streaming platforms.
In the stock market, Netflix has experienced remarkable growth, with its stock surging by 150% since its low point in June last year and rising by 47% in 2023. The resurgence in the stock price can be attributed to two strategic moves by Netflix: the introduction of the Standard with Ads tier and the successful handling of password-sharing issues.
The introduction of the Standard with Ads tier, priced at $6.99 per month, has been a resounding success, attracting nearly 5 million monthly active users worldwide. This solution has been hailed as brilliant by analysts because it attracted users to Netflix at a lower price point but on those subscriptions, Netflix monetizes the content by showing advertising. The engagement levels of subscribers on this tier are comparable to plans without advertising, highlighting its effectiveness. While the company has not disclosed specific details about its ad revenue, the triumph of the ad-supported tier suggests solid progress in this area.
Another factor contributing to the stock’s rise is Netflix’s ability to curtail password-sharing better than expected which is a testament to the company’s initiative-taking measures. These strategic moves have not only bolstered investor confidence but have also propelled Netflix’s stock to new heights.
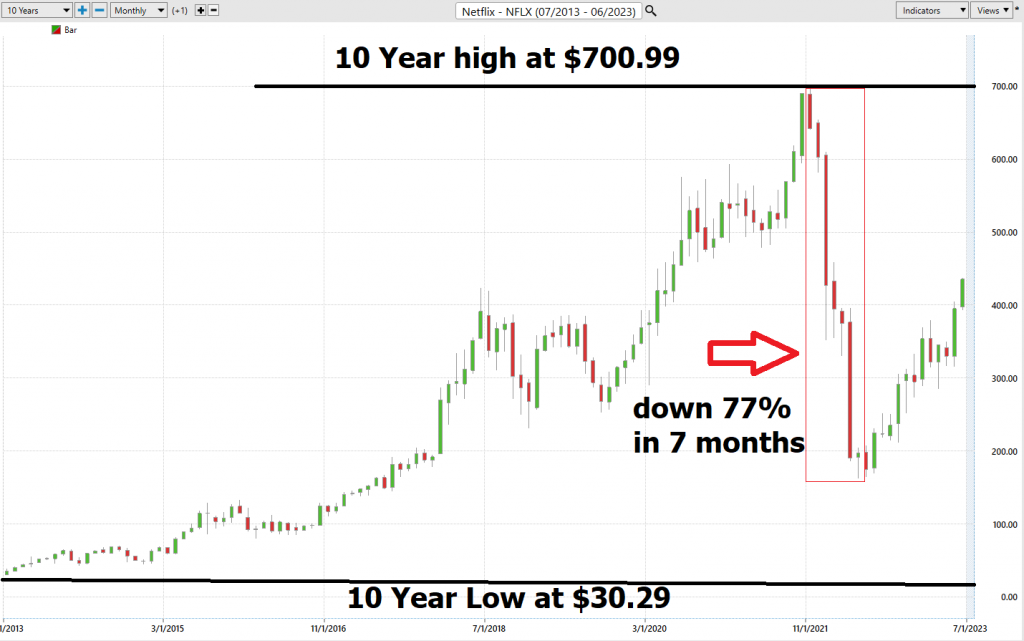
In 2022, Netflix stock was down as much as 77% from its all-time highs. Many on Wall Street had written off the stock as a fad and suggested it should be removed from the popular $FAANNG Index. (Facebook, Apple, Amazon, Netflix, Nvidia, Google.)
Netflix’s content portfolio encompasses a diverse range of offerings, including original TV series, films, documentaries, and stand-up comedy specials. Furthermore, the company is making notable strides in the sports streaming sector, which could potentially become a significant revenue source in the future.
Amidst a volatile market environment, Netflix has managed to maintain a strong position, playing a key role in driving the S&P 500 to new highs in 2023. This success can be attributed to its influential status as a leader in the streaming industry, achieved through its substantial market share, early adoption of the streaming model, expansive content library, and fruitful production of original content.
While Netflix’s financials present a mixed picture, with a market capitalization of $188.47 billion and a P/E ratio of 45.53, the company has shown modest revenue growth of 6.46% over the past year and a more substantial growth rate of 16.43% over the past three years. However, the company’s earnings growth has experienced a setback, showing a negative rate of -16.41%. With total debt amounting to approximately $16.93 billion and total assets valued at around $48.59 billion, Netflix faces a complex financial landscape.
In terms of earnings, Netflix has demonstrated a history of surpassing estimates in recent quarters. For instance, in Q1 2023, the company reported earnings of $2.88 per share, slightly exceeding the estimated $2.86. However, the company’s Q4 2022 earnings fell significantly below estimates, with earnings of $0.12 per share compared to the estimated $0.55.
Analysts’ opinions on Netflix are divided. Bulls acknowledge the company’s competitive advantages, such as its sophisticated recommendation software and vast subscriber base, while also recognizing the potential for international expansion. Conversely, bears emphasize concerns over Netflix’s ongoing cash burn for content creation and the growing level of competition both domestically and internationally.
As traders and investors eagerly await the upcoming earnings report on July 18, 2023, the market will be laser-focused on any hints that reveal Netflix’s growth potential for the remainder of the year. The report’s insights will undoubtedly play a pivotal role in shaping the market’s perception of Netflix and determining its trajectory in the months ahead.
We have featured $NFLX numerous times this year in our Hot Stocks Outlook. Here are a handful of links with the a.i. forecast at that time:
Netflix A.I. Forecast 6/9/23
Netflix A.I. Forecast 3/3/23
As you watch those YouTube links understand that our only loyalty is to the trend because we are short-term swing traders.
In this weekly stock study, we will look at and analyze the following indicators and metrics which are our guidelines which dictate our behavior in deciding whether to look for opportunities to buy, sell, or stand aside on a particular stock.
- Wall Street Analysts’ Estimates
- 52-week high and low boundaries
- Vantagepoint A.I. Forecast (Predictive Blue Line)
- The Best Case – Worst Case Scenarios
- Neural Network Forecast
- Daily Range Forecast
- Intermarket Analysis
- Our trading suggestion
We don’t base our trading decisions on things like earnings or fundamental cash flow valuations. However, we do look at them to better understand the financial landscape that a company is operating under.
Wall Street Analysts’ Estimates
The 35 analysts offering 12-month price forecasts for Netflix Inc have a median target of 380.00, with a high estimate of 535.00 and a low estimate of 215.00. The median estimate represents a -10.98% decrease from the last price of 435.73.
52-Week High and Low Boundaries
Looking at the Long-Term chart of $NFLX provides us with the 52-week high and low boundaries.
Over the past year we have seen $NFLX trade as low as $168.53 and as high as $443.98. This represents an annualized statistical volatility of 61.7% which is high. But it is these high volatility markets where the a.i. excels in both keeping traders on the right side of the trend at the right time. The volatility # is calculated by dividing the closing price by the closing price by the annual trading range. This value tells us that it would be perfectly normal based upon current market conditions for $NFLX to trade as much as 61.7% higher and lower than the current price.
We like to study the 52-week chart before doing anything else just so that we can get a feel for how the company has performed over the past year and compare that to other opportunities and the broader market indexes.
Place these boundaries on your radar and pay attention. We always want to focus our time, energy, and money by analyzing those stocks that are making new 52-week highs. This simple metric tells us who is winning in the competitive financial market landscape.
When we zoom out on the chart and look at the longer term 10-year monthly chart we get a clear picture of the longer-term growth trajectory of Netflix and how difficult a year 2022 was for the company.
Best Case – Worst Case Scenario $$NFLX
The chart below shows the numerous sharp declines that $NFLX had over the past year.
Earlier we mentioned that the annualized volatility in $$NFLX is 61,7%.
Before entering into any trade we want to assess the volatility landscape and compare the best rallies the market has had over the past 12 months to the worst declines. By so doing we can get a real-world, real-time perspective of the volatility that $NFLX has had.
First, we start with the worst-case analysis.
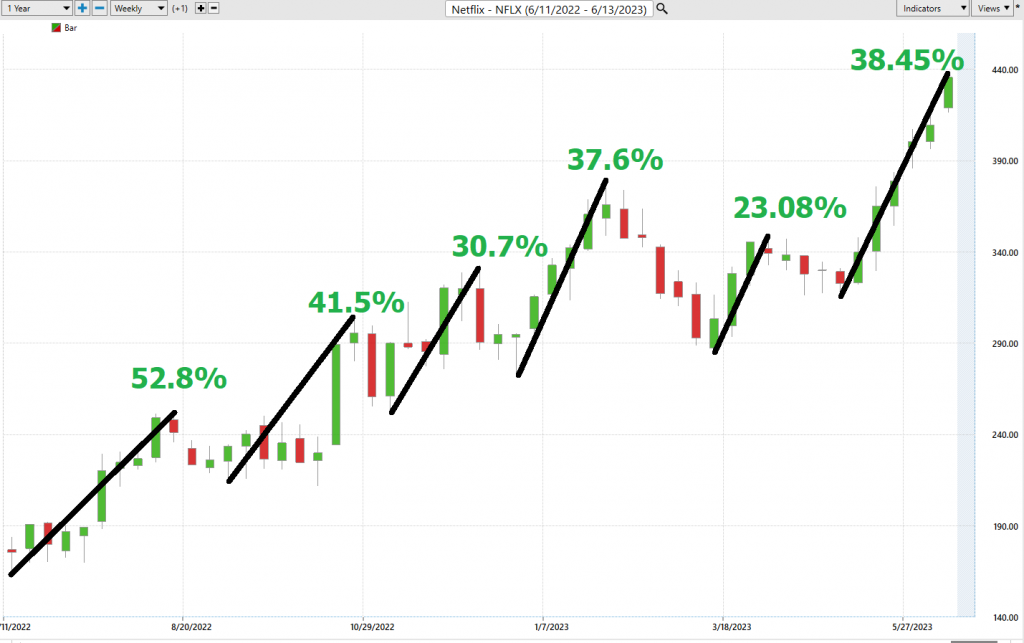
Next, we compare those declines to the best rallies. We call this the best-case analysis:
We can clearly see that the declines were relatively shallow in comparison to the rallies. The worst decline was -24.2% over 6 weeks. The best rally was 52.8% over a period of 10 weeks.
Next, we compare $$NFLX to the performance of the broader stock market indexes.
You can see that in spite of all the bad press Netflix received in 2022 when its stock was decimated, the company has outperformed the broader stock market indexes on a massive basis across all time frames.
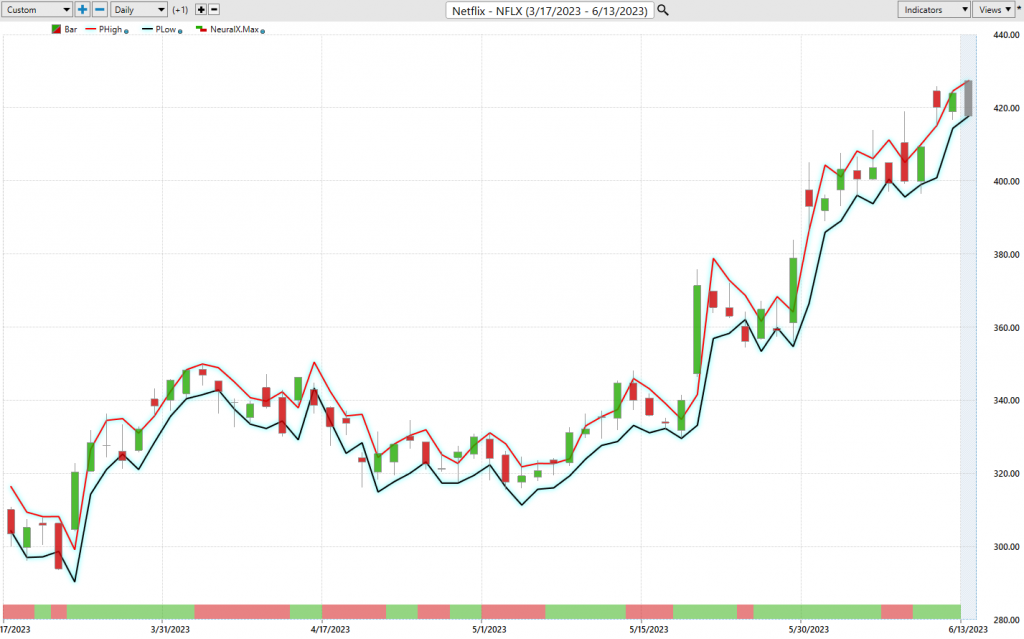
Vantagepoint A.I. Forecast (Predictive Blue Line)
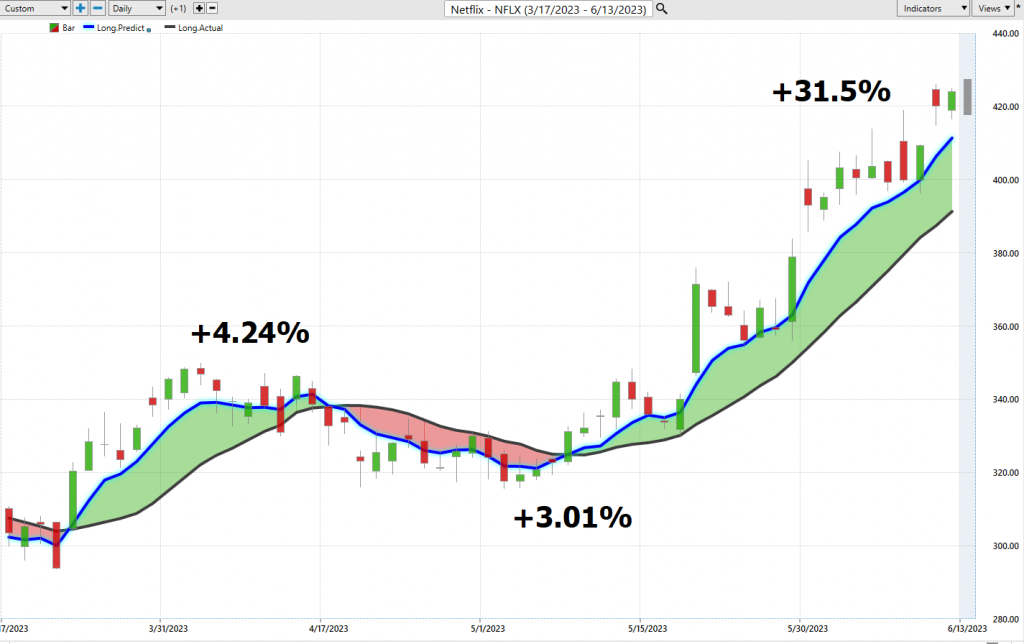
On the following chart, you will see the power of the VantagePoint Predictive blue line which determines the medium-term trend price forecast.
The guidelines we abide by are as follows:
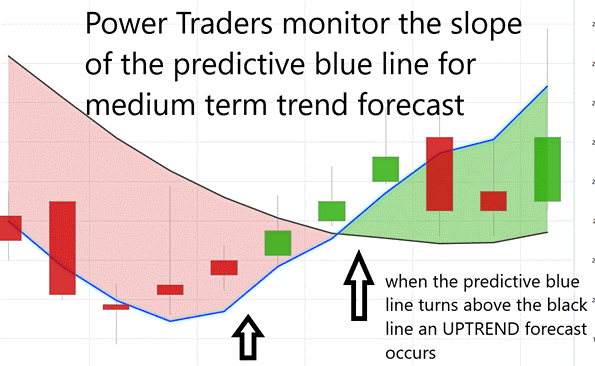
- The slope of the predictive blue line determines the trend and general direction of $NFLX
- Ideally, the VALUE ZONE is determined to try and buy the asset at or below the predictive blue line.
Delving into the chart below, a close examination of the blue line’s slope is of paramount importance. Powered by Vantagepoint’s innovative Neural Network and Intermarket Analysis, this predictive blue line holds the key to unlocking valuable insights. By leveraging artificial intelligence and statistical correlations to dissect the most influential price drivers of an asset, the blue line possesses the unique ability to identify prevailing price trends.
To gain a deeper understanding of $NFLX’s behavior, let us harness the power of artificial intelligence and analyze the stock’s recent price action. The slope of the predictive blue line emerges as the pivotal factor in discerning the prevailing price trend.
Traders who rely on VantagePoint Software utilize artificial intelligence to detect trend forecasts by meticulously monitoring the slope of the predictive blue line. Representing a simple 10-day moving average of price, the black line offers a glimpse into past market performance. On the other hand, the predictive blue line functions as a value zone, guiding traders to aim for purchasing the asset at or below this lines value during uptrends.
When scrutinizing the chart, traders place significant emphasis on the relationship between the black and predictive blue lines. The predictive blue line’s determination relies on VantagePoint’s groundbreaking Neural Network and Intermarket Analysis, which meticulously considers the asset’s most influential price drivers and statistical correlations to establish its value.
An upward movement of the predictive blue line surpassing the black line presents an opportunity for an up-forecast entry, while a descent below the black line signifies a downward forecast. This empowers traders to identify the prevailing trend and value zone without any guesswork.
Seasoned traders skillfully leverage the predictive blue line to ascertain the value zone and the direction of the prevailing trend. Two consecutive closes above the predictive blue line mark the threshold for an uptrend forecast. As the slope of the predictive blue line escalates, it serves as a telltale sign of an impending change in price direction. A robust trend is evident when prices consistently close above the predictive blue line, as demonstrated in the chart.
To summarize, the slope of the predictive blue line wields formidable influence in identifying trends within $NFLX. Armed with this powerful tool, traders can make informed decisions about the optimal timing for buying or selling, avoiding any uncertainty that might impede their success. Over the past 3 months, there were three trend forecasts.
#1 generated gains of 4.24% on the long side.
#2 generated gains of 3.01% on the short side.
#3 generated gains of 31.5% on the long side.
Neural Network Indicator (Machine Learning)
The chart presents the Neural Network Indicator, a powerful tool for predicting short-term market strength or weakness. When the indicator is green, it signifies market strength, while a red indicator suggests short-term weakness. The Neural Network itself is a computational learning system that utilizes a network of functions to process extensive data and generate desired outputs. Continuously self-monitoring and improving, the Neural Network plays a crucial role in forecasting market trends.
Power Traders, seeking statistically valid trading setups, rely on a DOUBLE confirmation signal. This occurs when both the blue predictive line and the Neural Network indicator align, indicating a consistent expectation of future outcomes. We strongly advocate that Power Traders leverage this double confirmation by cross-referencing the chart, the predictive blue line, and the neural network indicator to pinpoint optimal entry and exit points.
Traders carefully observe the Neural Network indicator for confirmation when positioning themselves in the market, either LONG or SHORT. Specifically, a buying opportunity arises when the A.I. forecast is UP (green) and the Neural Network indicator is also green, suggesting market strength. Conversely, a selling opportunity presents itself when both the A.I. forecast and the Neural Network indicator turn red, signaling market weakness. The chart’s arrows highlight the trading zones where Power Traders would have utilized double confirmation to strategically enter the market by cross-referencing the A.I. forecast with the Neural Network.
Power Traders consistently seek to integrate both the Neural Network and A.I. capabilities into their market analysis to identify statistically sound trading opportunities. By leveraging these advanced tools, traders can gain an edge in their decision-making processes and enhance their chances of success in the ever-evolving financial landscape.
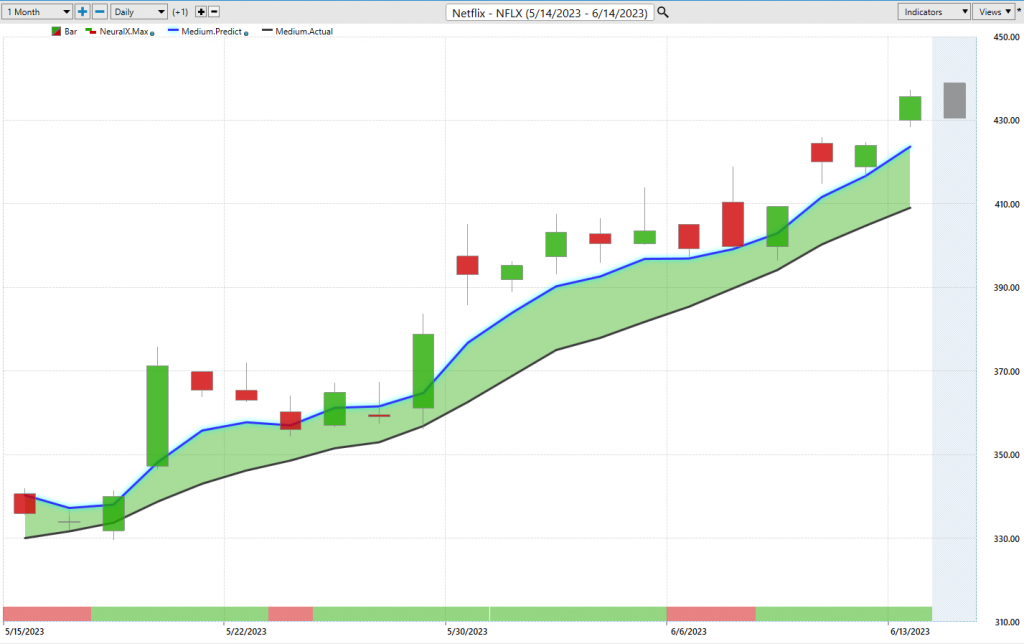
VantagePoint Software Daily Price Range Prediction
The Vantagepoint A.I. Software offers Power Traders a remarkable tool known as the Daily Price Range prediction forecast, which has become an indispensable feature in their daily trading activities. This forecast empowers Power Traders to finely tune their market entries and exits, providing them with a competitive edge in the short-term swing trading arena.
In the quest for an advantage over their peers, short-term swing traders consistently seek profitable entry and exit points. While many traders grapple with defining value, the Vantagepoint Daily Range forecast simplifies the process with a single click, offering unparalleled precision.
To better understand the level of volatility when trading $NFLX stock, let’s examine the average trading ranges over monthly, weekly, and daily time frames.
Displayed below is the price chart of $NFLX during its recent rally, featuring the Daily Price Range forecast and the Neural Net Indicator. Take note of how clearly the daily range is delineated, enabling traders to stay on the right side of the prevailing trend at the opportune moment.
Power Traders strategically employ a protective sell stop below the predictive low price as a precautionary measure in case of a sudden market reversal.
The Vantagepoint A.I. Software’s Daily Price Range forecast has revolutionized the way Power Traders navigate the market, allowing them to optimize their trading decisions based on precise price ranges. With this invaluable tool at their disposal, Power Traders gain a significant advantage in capitalizing on short-term market movements with enhanced accuracy and confidence.
Intermarket Analysis
Power lies in the way we respond to the truth we understand.
The Vantagepoint Software sets itself apart through its exceptional ability to perform Intermarket analysis, allowing for the identification of statistically interconnected assets that drive price movements. While studying charts can assist in identifying support and resistance levels, it is essential to recognize that the global marketplace operates on interconnectivity, with numerous variables influencing companies’ decisions for survival. Understanding the key drivers of an asset’s price presents a significant challenge for traders and investors.
Intermarket analysis involves exploring correlations and relationships between different financial markets to uncover opportunities and comprehend the interactions and influences among various asset classes. By analyzing these intermarket relationships, traders can identify emerging trends, potential opportunities, and risks. The Intermarket Analysis graphic featuring the 31 markets provides insights into the primary drivers of $AAPL’s price, offering valuable information to traders seeking a comprehensive understanding of these relationships.
This information proves invaluable as it enables traders to identify other opportunities and discover potential trading prospects in their early stages. Recognizing correlated assets and understanding the ETFs that are also buyers of $NFLX provides traders with a wider perspective and uncovers hidden opportunities.
In the world of investing and trading, differentiating between facts and opinions can be challenging. However, Vantagepoint Software’s prowess lies in its ability to conduct Intermarket analysis, which aids in identifying assets closely correlated with the price of $NFLX and driving its movements.
Utilizing intermarket analysis allows traders to pinpoint highly correlated assets that serve as key drivers of $NFLX’s price. This becomes particularly valuable during periods when broader market stock indexes experience declines, as it helps identify stocks or assets that move counter to major stock trends.
While chart analysis offers insights into support and resistance levels, it is crucial to acknowledge the intricate web of interconnectedness within the global marketplace. Making sound investment decisions requires a deep understanding of the key drivers behind an asset’s price. Although these drivers may not be apparent at first glance, they exhibit strong statistical correlations. Even minor fluctuations in interest rates, crude oil prices, currency volatility, and countless other variables can significantly impact a company’s decision-making process. Identifying these key drivers poses a significant challenge for investors and traders alike.
Suggestion for Traders
When I track any asset, I pay attention to changes. Those changes force me to re-evaluate my opinion and look at the data in a new unit of time.
Currently, Wall Street analysts are revising their estimates upwards.
As we navigate the financial landscape of 2023, Netflix ($NFLX) presents an intriguing case for traders.
Following a temporary setback in Q2 2022, marked by a decline in paid subscribers, Netflix demonstrated resilience by not only recouping these losses but also stabilizing its revenue growth trajectory. This recovery effectively quelled concerns about the company’s potential stagnation in the face of mounting competition from formidable rivals such as Disney, Amazon, Warner Bros. Discovery, and Paramount.
A cornerstone of Netflix’s success is its robust content pipeline. The company’s substantial investment in content creation and acquisition has proven instrumental in driving subscriber growth. Its strategy of consistent content refreshment serves to entice new subscribers while ensuring the loyalty of its existing user base.
In terms of valuation, Netflix holds its own against other FAANNG stocks, despite its inherent volatility. This assessment is grounded in the company’s forward price-to-earnings ratio.
However, it’s worth noting that Netflix’s aggressive content investment strategy is financed by accruing debt. While this approach has fueled growth, it simultaneously escalates the company’s financial risk profile. A significant uptick in interest rates could inflate Netflix’s interest expenses, thereby exerting downward pressure on its profitability.
Opportunities abound for Netflix, with the streaming market poised for substantial growth. As a dominant player in this space, Netflix is well-positioned to leverage its extensive content library and global reach. Furthermore, its successful international expansion strategy underscores the potential for further growth in overseas markets. The company’s commitment to original content creation, a key success factor, continues to attract and retain subscribers.
Nevertheless, risks persist. The streaming market is increasingly competitive, with industry giants like Disney, Amazon, and Apple vying for market share. This could potentially impede Netflix’s subscriber growth and profitability. Additionally, escalating content costs could erode Netflix’s margins if it fails to transfer these costs to consumers. As Netflix broadens its global footprint, it also grapples with regulatory risks across different markets, which could impact its operations and profitability.
Now, $NFLX appears to be overextended. We recommend waiting for a pullback into the value zone, as indicated by the predictive blue line, before considering a long position.
Our guiding principle remains the insights gleaned from artificial intelligence. We will continue to utilize the predictive blue line with the neural index to identify short-term trading opportunities. The trend and momentum for $NFLX are both upwards. Traders should remain vigilant during market pullbacks, which we anticipate will be brief.
Our recommendation is to follow the A.I. trend analysis as outlined in this stock study and practice good money management on all trades.
We will re-evaluate based upon:
- New Wall Street Analysts’ Estimates
- New 52-week high and low boundaries
- Vantagepoint A.I. Forecast (Predictive Blue Line)
- Neural Network Forecast
- Daily Range Forecast
Let’s Be Careful Out There!
It’s Not Magic.
It’s Machine Learning.
Disclaimer: THERE IS A HIGH DEGREE OF RISK INVOLVED IN TRADING. IT IS NOT PRUDENT OR ADVISABLE TO MAKE TRADING DECISIONS THAT ARE BEYOND YOUR FINANCIAL MEANS OR INVOLVE TRADING CAPITAL THAT YOU ARE NOT WILLING AND CAPABLE OF LOSING.
VANTAGEPOINT’S MARKETING CAMPAIGNS, OF ANY KIND, DO NOT CONSTITUTE TRADING ADVICE OR AN ENDORSEMENT OR RECOMMENDATION BY VANTAGEPOINT AI OR ANY ASSOCIATED AFFILIATES OF ANY TRADING METHODS, PROGRAMS, SYSTEMS OR ROUTINES. VANTAGEPOINT’S PERSONNEL ARE NOT LICENSED BROKERS OR ADVISORS AND DO NOT OFFER TRADING ADVICE.