| This week’s stock analysis is Northrop Grumman ($NOC) |
Northrop Grumman Corporation ($NOC), a leading American aerospace and defense behemoth, stands tall as one of the globe’s premier defense contractors. With its headquarters nestled in Falls Church, Virginia, the company’s vast reach is felt across various sectors of the defense industry.
A significant chunk of Northrop Grumman’s revenue reservoir flows from government coffers, with the U.S. Department of Defense being a primary benefactor. The company’s diversified portfolio spans aerospace systems, mission-centric solutions, and avant-garde technology services. This includes innovative offerings like cybersecurity tools, state-of-the-art unmanned aircraft, and missile defense apparatus.
The defense titan boasted a formidable workforce of approximately 90,000. The company’s genesis can be traced back to the merger of two industry stalwarts: Northrop, founded in 1939 by Jack Northrop, and Grumman, established in 1930 under the aegis of Leroy Grumman and his associates.
In the competitive arena of defense and aerospace, Northrop Grumman squares off against industry heavyweights such as Lockheed Martin, Boeing, Raytheon Technologies, and General Dynamics.
The evolving technological landscape presents an excellent opportunity for Northrop Grumman to pioneer advancements in artificial intelligence, cybersecurity, and unmanned systems. Moreover, escalating global tensions and surging defense budgets worldwide could translate to a windfall of contracts for the company.
However, the road isn’t devoid of pitfalls. The company’s heavy reliance on government contracts is a double-edged sword, with potential defense budget cuts posing a threat. Additionally, the rapid pace of technological evolution necessitates relentless R&D endeavors, and global geopolitical shifts can sway defense contract dynamics.
From cybersecurity infrastructure to satellite systems and from unmanned aerial vehicles to advanced radar mechanisms, Northrop Grumman’s product suite is vast. Among its iconic creations are the B-2 Spirit stealth bomber and the Global Hawk unmanned reconnaissance aircraft.
The financial corridors of Wall Street have traditionally lauded Northrop Grumman, attributing its commendations to the company’s robust stance in the defense sector and its unwavering performance metrics. Yet, as with any corporate entity, opinions oscillate based on prevailing market sentiments, fiscal health, and global events.
In the specialized domains of aerospace, defense, and cybersecurity, Northrop Grumman emerges as a frontrunner. Its rich legacy of innovation and a comprehensive product lineup underscore its dominant industry stature.
To encapsulate, Northrop Grumman remains an indomitable force in the global defense and aerospace matrix, blending its illustrious past with a vision for the future, even as it navigates the intricate maze of global challenges and opportunities.
$NOC pays a dependable 1.71% dividend.
In this stock analysis, we will evaluate the following metrics and indicators to determine what the best course of action is regarding $NOC stock trading.
- Wall Street Analysts’ Estimates
- 52-week high and low boundaries
- Vantagepoint A.I. Forecast (Triple Cross)
- Neural Network Forecast
- Daily Range Forecast
- Intermarket Analysis
- Our Suggestion
We don’t base decisions on things like earnings or fundamental cash flow valuations. However, we do look at them to better understand the financial landscape that a company is operating under.
Analysts Ratings
The very first thing we like to do in our analysis is to take a quick look at what the Wall Street Analysts are thinking about $NOC.
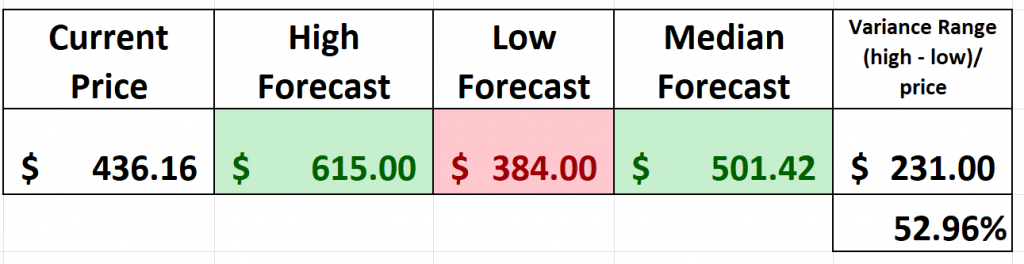
Based on 12 Wall Street analysts offering 12-month price targets for Northrop in the last 3 months. The average price target is $501.42 with a high forecast of $615.00 and a low forecast of $384.00. The average price target represents a 16.56% change from the last price of $430.17.
This tells us that the brightest minds on Wall Street which watch the stock full time think that $NOC has analysts believing it is marginally undervalued.
However, we can also get an estimate of future expected volatility by subtracting the low estimate ($384) from the high estimate ($615 ) and dividing that value ($231) into the current price ($436.16). This practical exercise tells us that Wall Street Analysts have a variance of opinion which amounts to 52.96% of the current price.
A good rule of thumb to follow is that the higher the variance among Wall Street Analysts the greater the volatility of an asset. Volatility is what creates movement. As traders we must respect and understand that movement cuts in both directions. What we can quickly see from the Wall Street Analysts forecasts is that there is a variance of 52.96% between the most bullish and bearish analysts. This metric provides us with the expectations of future volatility.
52-week High-Low Chart
Next, we want to see where we are trading in relation to the 52-week range.
Over the last 52 weeks, $NOC has traded as high as $556.27 and as low as $421.73. This provides us with an annual trading range of $134.54. It is currently trading down against its 52-week low. The 52-week low price boundary isn’t just a random figure on the charts – it’s a crucial touchstone that seasoned traders have on their radar, and for a multitude of compelling reasons.
The 52-week high and low of an asset’s price stands out as a beacon for market navigators. This metric, often cited in financial newsrooms and analyst reports, holds more than just numerical value; it’s a psychological barometer of market sentiment and a strategic tool for traders.
The 52-week range offers a practical and analytical view of an asset’s performance over the past year. A stock hovering near its 52-week high might be perceived as having strong momentum, signaling bullish sentiment. Conversely, one nearing its 52-week low could be seen as undervalued or facing headwinds, potentially indicating bearish sentiment. This ebb and flow of prices provide traders with insights into the collective mood of the market.
Beyond the cold hard numbers, the 52-week range taps into the psychological underpinnings of the market. Breaking past a 52-week high can trigger a surge of optimism, potentially driving the asset even higher. Similarly, dipping below a 52-week low can exacerbate fears, leading to further declines. Traders, ever vigilant of these psychological shifts, use the 52-week markers to gauge potential breakouts or breakdowns.
In the comparative world of finance, the 52-week range offers a relative measure of an asset’s performance against its peers. An asset consistently trading near its 52-week high in a sector where peers are languishing could indicate sectoral outperformance, spotlighting potential leaders in the pack.
In conclusion, the 52-week range isn’t just a pair of numbers; it’s a dynamic metric, a pulse of the market’s heart. For traders, it’s an indispensable tool, a compass guiding them through the tumultuous seas of Wall Street, helping chart a course towards potential profits. As the market continues its dance, the 52-week range will remain a key tune to which traders sway.
Additionally, what we often like to do as well is to divide the annual trading range ($134.54) by the current price ($436.16) to provide us with a basic and generic calculation of $NOC’s statistical volatility over the past year. Currently the statistical annualized volatility for $NOC is 30.8%.
What this number tells us is that we can define NORMAL for the next year that $NOC could trade in a range 30.8% higher and or lower than the current price.
We always advise traders to pay attention to the 52-week high boundary and to view it in relation to what is happening in the broader market.
Our experience has been that buying high quality stocks when they are trading near their 52-week lows, when guided by artificial intelligence is quite often a prudent trading decision.
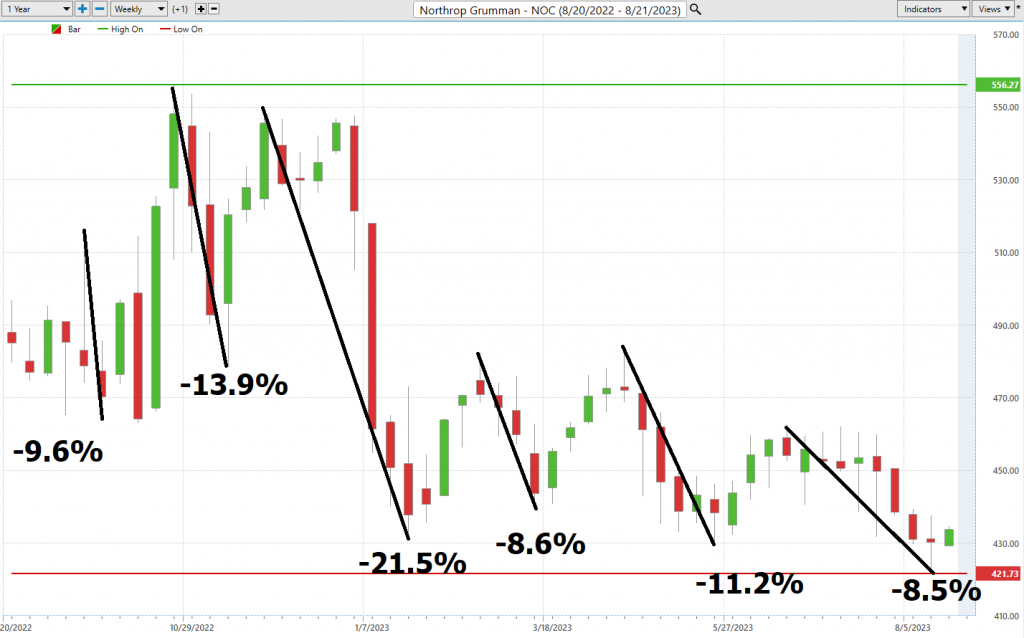
Here is the 52-week chart of $NOC.
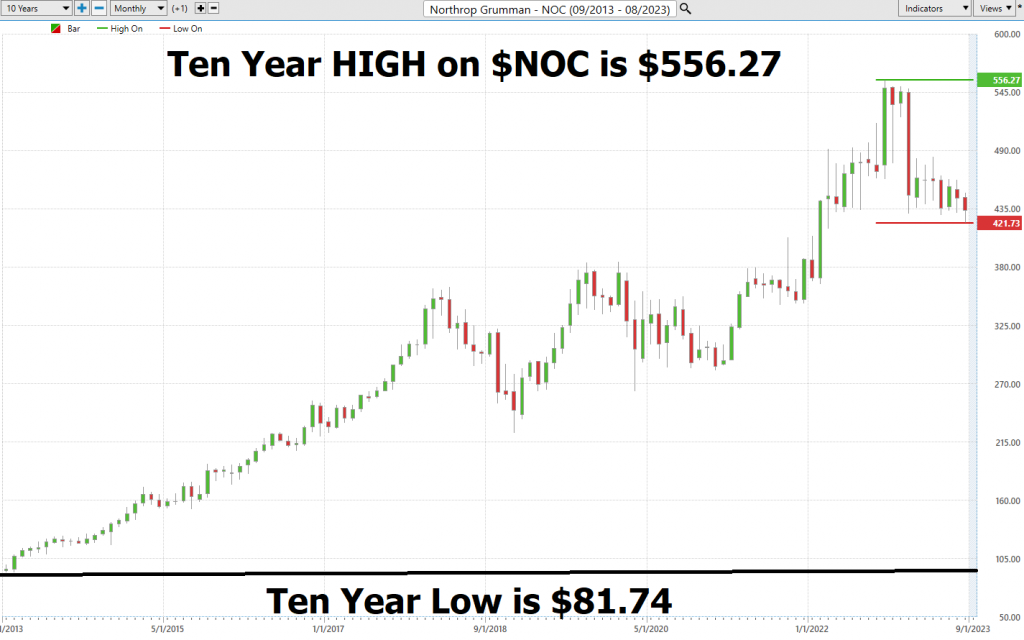
Here is the 10 Year Chart on $NOC.
Best Case – Worst-Case Scenarios
Over the last 52 weeks, $NOC is DOWN 9.52%
Over the last 5 years, $NOC shares are up 46.59%
Over the last 10 years, $NOC shares are up 355.3%
Over the last 40 years, $NOC shares are up a staggering 3018%
When we study the 52-week chart we can look at the best case and worst-case scenarios just to get an eyeball perspective of the risk and volatility of this asset. We juxtapose this real-world volatility against the estimates from Wall Street Analysts (52.96%) as well as the statistical volatility estimates (30.8%).
This is worth doing anytime you invest or trade to monetarily understand what the potential risks and rewards have been over the past year.
This exercise provides a snapshot of the best rallies and worst drawdowns that $NOC has experienced over the past year measured on a percentage basis.
Here is the best-case analysis on $NOC.
Followed by the worst-case analysis:
It’s worth doing this type of baseline analysis because it allows you to quickly understand the real risk and opportunity associated when trading $NOC.
The strongest trough-to-peak rally over the short term was 19.7%.
The worst decline from peak to trough over the short term was 21.5%
Next, we compare $NOC to the major broad market indexes. By doing this we can easily see that $NOC has outperformed the broader market but has done so with significantly more volatility. Traders refer to this as BETA. The beta (β) of a stock is a measure of its volatility in relation to the overall market, typically a broad market index like the S&P 500. In essence, beta represents the stock’s sensitivity to market movements.
Here’s a simple way to understand what BETA means:
Beta = 1: The stock’s price is expected to move in line with the market. For example, if the market goes up by 5%, a stock with a beta of 1 is also expected to go up by 5%.
Beta > 1**: The stock is more volatile than the market. A beta of 1.5, for instance, suggests that the stock is 50% more volatile than the market. So, if the market goes up by 5%, the stock might go up by 7.5% (and vice versa).
Beta < 1**: The stock is less volatile than the market . A beta of 0.5 indicates that the stock is 50% less volatile than the market. If the market goes up by 5%, the stock might go up by only 2.5%.
The BETA on $NOC is .76 and is measured on a 5-year monthly basis.
Beta is based on past data, and past performance is not always indicative of future results. A high beta does not necessarily mean high returns. It simply indicates higher volatility and, therefore, potentially higher risk.
Investors use beta to understand and measure the risk of a particular stock relative to the risk of the broader market. It helps in constructing portfolios that align with an investor’s risk tolerance and investment objectives.
So, in $NOC have an asset which has underperformed the broader stock market indexes.
Historically, measured by any comparative performance metric, $NOC has been a solid and stellar performer, but the past year has been troublesome. Our trading thesis is to pay attention to star performers when they bounce off their 52-week lows and we are guided by the artificial intelligence. This setup is forming at the present time.
Based upon all of our analysis so far, we would place it firmly on your trading radar as stocks like this will offer numerous trading opportunities in the coming year.
The Vantagepoint A.I. Triple Cross Indicator
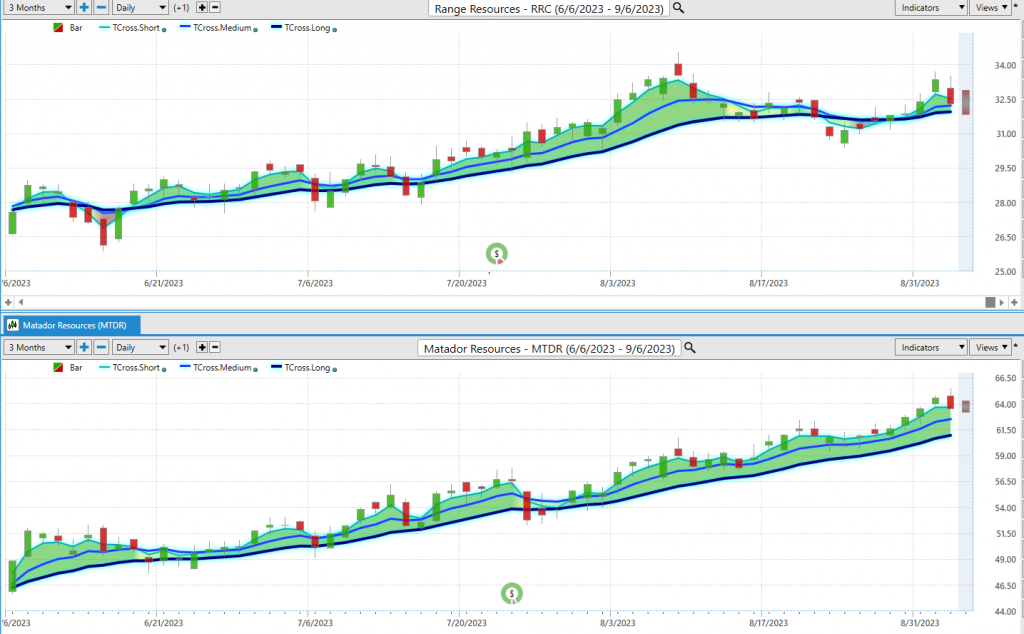
Within the intricate tapestry of the financial markets, one name emerges as a true trailblazer: the Vantagepoint A.I. Triple Cross indicator. Departing from the traditional confines of dual moving averages, this innovation introduces a triumvirate of predictive moving averages, poised to revolutionize market analysis. Encompassing a 3-day, an 8-day, and an 18-day predictive moving average, this ensemble caters to the intricacies of short-term, medium-term, and long-term market dynamics.
The brilliance underlying this innovation lies in its measured approach. Much like a connoisseur savors morning coffee, the Triple Cross patiently observes numerical intricacies, biding its time. A market overture is sounded when the short-term average elegantly surpasses its longer-term counterpart – a mere whisper of the opening bell, alluding to potential market shifts. Yet, the true crescendo arrives as the medium-term gracefully eclipses the long-term average. This heralds a confirmed shift in trends, the harmonious convergence of these three averages setting the stage for the unfolding of a solid trend.
The Triple Cross indicator’s magnificence truly shines in its trifecta of predictive insights, furnishing traders with an edge honed to a keen edge. It acts as a shield, safeguarding against rash decisions and deceptive market ploys.
the Triple Cross Indicator shines, adept at spotting the early signs of a trend change, backed by the supporting roles of its three moving averages. It promises not just more trades, but smarter ones, elevating the art of trading to a masterful performance.
Fine Tuning Entries with The Neural Net Indicator
In the financial charts, the Neural Network Indicator forecasts market momentum. Green indicates strength; red suggests short-term market weakness. Essentially, a Neural Net is a sophisticated computational system that interprets vast data, refining its performance over time.
Originating from 1950s research at institutions like Cornell and Carnegie Mellon, these computer algorithms identify asset price trends to predict market movements. Imagine you’re training a super-smart robot to make really good decisions about buying and selling things in a store. This robot has a special brain called a “neural network” that helps it learn how to make these decisions.
Now, think of the neural network like a bunch of connected dots, kind of like a spider web. Each dot represents a tiny decision that the robot can make. These dots are connected by lines, and the strength of these connections helps the robot figure out what to do. At first, the robot’s brain is like a blank slate. It doesn’t know much about buying and selling. So, you give it a bunch of examples. You tell it, “Hey robot, when the price is low, it’s usually a good time to buy. And when the price is high, it’s often better to sell.”
The robot looks at all these examples and starts to see patterns. It notices that when the price is low and it buys, things usually turn out well. And when the price is high and it sells, it often makes a profit. As the robot keeps practicing with more examples, those connections between the dots get stronger. It becomes better at understanding when to buy and when to sell. Over time, the robot’s brain gets really good at making these decisions, almost like it’s using its own intuition.
So, a neural network for trading is like a smart robot’s brain that learns from examples to make the best choices about buying and selling things, just like how you learn from experience to make better choices in games or other things you do.
Using AI and machine learning, neural networks are invaluable for predicting stock prices, analyzing vast financial data, and spotting anomalies. Power Traders combine neural network insights with AI for reliable trading opportunities.
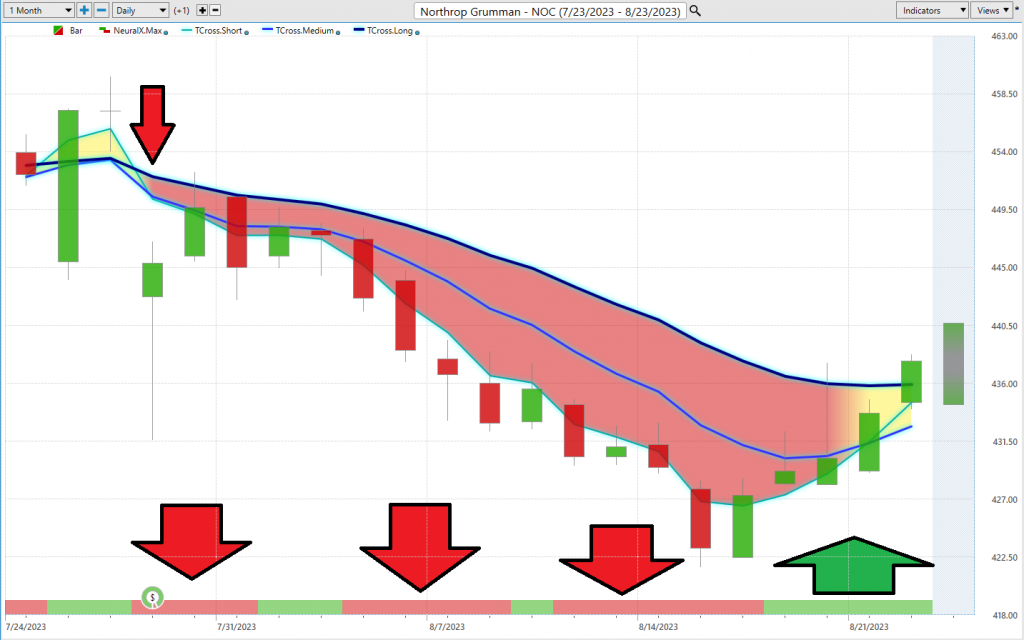
We advise Power Traders to cross reference the predictive blue line with the Neural Net for the best entry opportunities.
You can see in the chart above how the arrows reflect when the Neural Index and the artificial intelligence were both aligned and forecasting similar price action trends.
VantagePoint Software Daily Price Range Prediction
The purpose of all these indicators so far is to help traders stay on the right side of the right trend at the right time.
One of the powerful features in the Vantagepoint A.I. Software which Power Traders use daily is the Daily Price Range prediction forecast.
This forecast is what permits Power Traders to truly fine tune their entries and exits into the market, often looking for smaller time frames and more granular trading opportunities.
Over the past year this following graphic shows what the average trading ranges for $NOC have been on a daily, weekly, and monthly basis. This is a measurement of what has occurred. It also provides a guide to what short-term swing traders can expect over a given time frame.
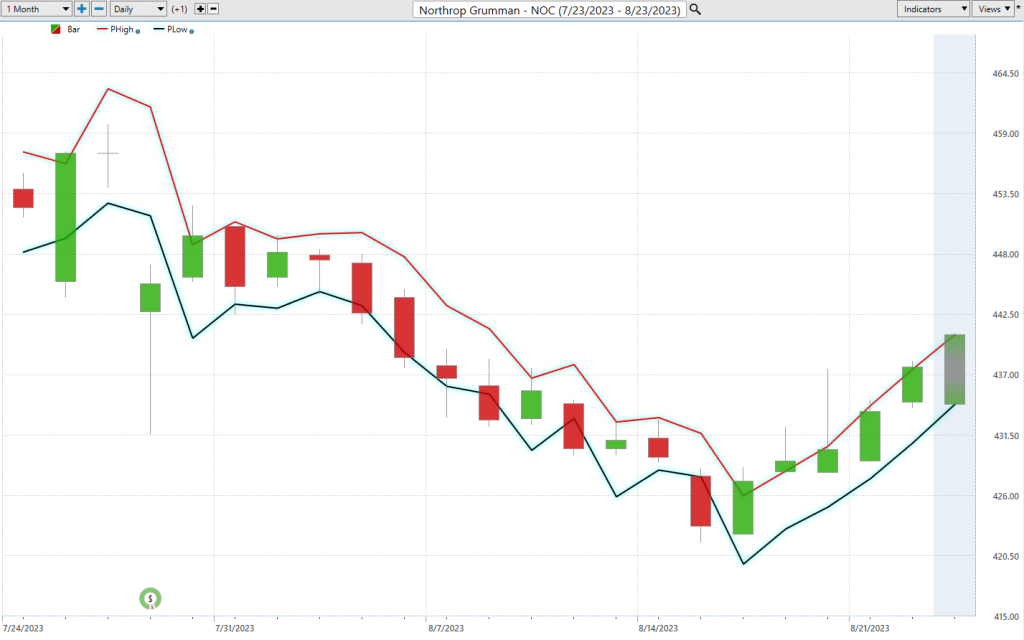
In the high-stakes world of trading, pinpointing value and discerning entry and exit points are paramount. Enter Vantagepoint A.I.’s Daily Range forecast, a tool that delivers this intel with surgical precision. Harnessing AI, machine learning, and neural networks, it crafts a daily forecast for each trading session, guiding traders to strategically navigate market trends.
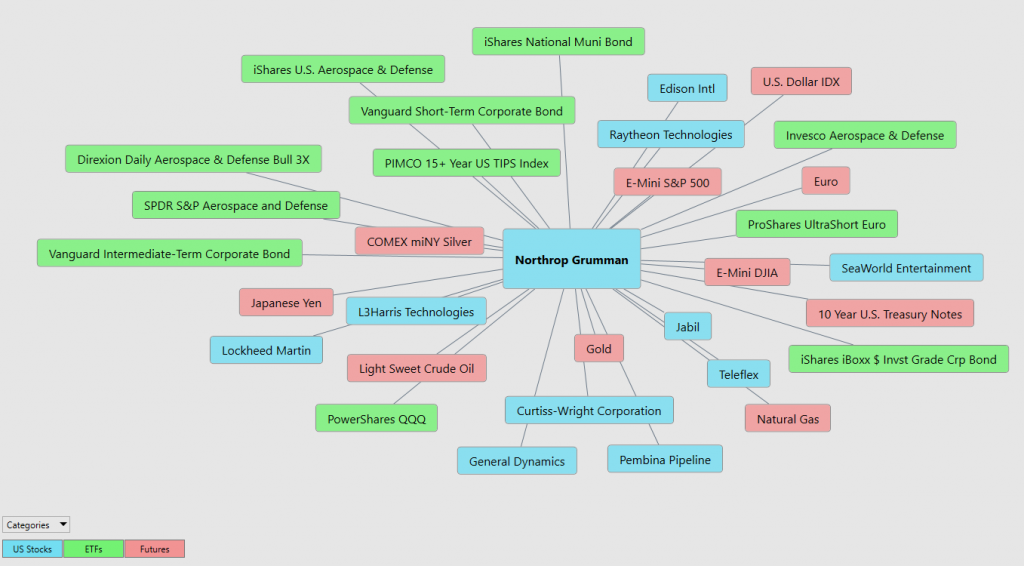
Intermarket Analysis
What makes the Vantagepoint Software unique is its ability to perform Intermarket analysis and to locate those assets which are most interconnected that are responsible for driving the price of $NOC higher or lower.
Studying the charts can always provide objective realities in terms of locating support and resistance levels which become clear on a chart. But we live in a global marketplace. Everything is interconnected. The billion-dollar question for traders is always what are the key drivers of price for the underlying asset that I am trading?
These intangibles are invisible to the naked eye yet show extremely high statistical correlations.
The concept of intermarket analysis was first introduced by renowned economists like Jacob Frenkel, Alfred Chandler, and Robert Shiller who believed that the interaction among different markets could impact aggregate economic performance. In financial trading this type of research was pioneered by Vantagepoint A.I. founder, Lou Mendelsohn.
Let me explain intermarket analysis this way: Imagine you’re planning your outfit for a big event. You’ve got your favorite shirt, pants, shoes, and accessories. Each piece of clothing is like a different market in the financial world. Now, the way your shirt looks might affect which pants you choose, and the shoes you wear might depend on both the shirt and the pants. Everything is interconnected. Intermarket analysis is like figuring out how each piece of your outfit (or market) affects the others. In the financial world, experts look at different markets, like the stock market, the gold market, the currency market, and the bond market, to see how a change in one might affect the others.
For example, if gold prices go up, it might mean that people are worried about the economy and are buying gold as a safe place for their money. This could affect stock prices, which might go down because people are taking their money out of stocks and putting it into gold.
So, just like you’d pay attention to how your shirt and pants match, traders use intermarket analysis to see how different markets “match” or influence each other. By understanding these connections, they can make better decisions about where to put their money.
There is immense value to be had in studying and understanding the key drivers of $NOC price action.
By doing so you can often see which ETFs are most likely acquiring $NOC as well as uncovering other industries, commodities, forex which affect $NOC price movement.
Here is a graphic worthy of your further study. It displays the top 31 drivers of $NOC’s price action.
Our Suggestion
$NOC is on our trading radar because it recently bounced off the 52-week low. This caught our attention and moved us to dig deeper on the opportunities for this stock.
Fundamentally the company continues to be awarded massive government contracts in A.I., cybersecurity, defense, and aerospace.
Some analysts on Wall Street believe that the company is fundamentally fairly valued at $528 based upon a free cash flow to equity analysis. While we are not fundamental traders, we are following the ai for guidance and believe that the next big move in NOC will be to the upside. NOC is a blue chip of military contractors.
We urge all traders to practice good money management and allow the artificial intelligence to guide your decision-making process.
As mentioned earlier in this analysis, whenever a high-quality stock bounces off its 52-week low, pay attention. You need to place it on your radar as it is communicating to the world that it is growing and overcoming all obstacles related to its business model.
Pay attention to $NOC.
Let’s Be Careful Out There!
Remember, It’s Not Magic.
It’s Machine Learning.
Disclaimer: THERE IS A HIGH DEGREE OF RISK INVOLVED IN TRADING. IT IS NOT PRUDENT OR ADVISABLE TO MAKE TRADING DECISIONS THAT ARE BEYOND YOUR FINANCIAL MEANS OR INVOLVE TRADING CAPITAL THAT YOU ARE NOT WILLING AND CAPABLE OF LOSING.
VANTAGEPOINT’S MARKETING CAMPAIGNS, OF ANY KIND, DO NOT CONSTITUTE TRADING ADVICE OR AN ENDORSEMENT OR RECOMMENDATION BY VANTAGEPOINT AI OR ANY ASSOCIATED AFFILIATES OF ANY TRADING METHODS, PROGRAMS, SYSTEMS OR ROUTINES. VANTAGEPOINT’S PERSONNEL ARE NOT LICENSED BROKERS OR ADVISORS AND DO NOT OFFER TRADING ADVICE.