| This week’s stock analysis is a follow up on iRobot ($IRBT and a full analysis on EXELIXIS ($EXEL) |

Traditionally our format for the Stock Study of the Week is we pick one stock that the a.i. has been focusing on and show traders how artificial intelligence, machine learning, and neural networks can greatly improve traders’ decision-making processes.
Back on June 23rd, we featured iRobot (IRBT). In that analysis we pointed out two especially important details, iRobot was struggling financially in spite of the fact that Amazon had recently made a $61 buyout offer for the company.
In that analysis we warned:
“ The narrative which has driven $IRBT over the past week is that AMAZON is seeking to acquire the company at $61.00 per share. That has been responsible for the sudden price increase based upon the announcement that regulators in the United Kingdom gave the deal a stamp of approval.
From a pure valuation perspective, $IRBT offers a very confusing perspective. They had a horrible 2022 and have only had 1 quarter of positive growth over the past year. Revenue fell by 45% over the most recent quarter and the company posted an operating loss of $81 million.
For traders who think the Amazon acquisition will occur there could still be a 20% upside. However, should the deal fall through for any reason the risk is greater than 20%.
Since there is not broad analyst coverage on the stock current and future price movements will be very much dictated on whether Amazon proceeds with the deal. The company’s next earnings date is August 4 th , 2023. $IRBT is currently trading at 1.3 times sales. Amazon may look at a better valuation since their initial offer was 10 months ago and the company has not done well financially since then.”
Since that writing $IRBT had rallied to a high of $51.49 and has since fallen to a low of $36.65. Amazon has revised their acquisition offer to $51.75. The entire deal is still under scrutiny from regulators.
A deep dive into iRobot’s financials reveals a concerning trajectory. Over the past three fiscal years, the company has seen a decline in both revenue and margins. While 2020 showed promise, by 2022, the company’s revenues had dipped, and gross profit margins shrunk from 47% to a mere 29.5%. Operating expenses, on the other hand, have been on the rise, leading to a net loss for the company. Once boasting a net income of nearly $150 million, iRobot now faces a loss nearing $300 million.
The company’s cash flow paints a similar picture. Once positive, the cash from operations has dwindled, leaving iRobot with negative free cash flow. This lack of liquidity has forced the company to take on debt of $200 million for the first time, a move that coincided with Amazon’s reduced acquisition offer.
The potential Amazon acquisition offers a glimmer of hope for investors. If the deal goes through at the proposed $51.75 per share, it could mean a 30-35% gain for those holding iRobot stocks. However, this potential reward doesn’t come without risks. Regulatory hurdles, especially from antitrust entities, could jeopardize the deal. Moreover, the competitive landscape of the robot vacuum market, despite iRobot’s recognizable Roomba brand, means the company’s recovery is uncertain without Amazon’s backing.
In conclusion, while the Amazon acquisition offers a potential lifeline for iRobot, the company’s declining financial health poses significant risks for investors. As the regulatory scrutiny intensifies, stakeholders are left to weigh the potential rewards against the inherent risks of this merger.
As we often discuss in our stock of the week analysis, we rely on artificial intelligence for guidance. Currently, the Vantagepoint A.i. Triple Cross is beginning to form an UP forecast within the next few days. As short-term traders we have $IRBT firmly on our trading radar and are looking at short-term swing trading opportunities.
Here is the chart of the TRIPLE Cross indicator.
Our initial suggestion to Power Traders is to review the $IRBT stock Study from 6/23/23 and continue to use the a.i. for guidance. Based upon recent market volatility $IRBT offers weekly volatility of roughly 6% and the stock will present numerous short-term trading setups.
Analysts are convinced that regulators will decide the fate of $IRBT before December 2023. The lowered buyout price is $51.75 per share. $IRBT has acquired $200 million in financing from the Carlisle Group. The stock is trading roughly 33% under the expected buyout price. Our enthusiasm rests not on the prospective buyout but on the fact that the a.i. is setting up another short-term UP forecast after a substantial decline.
=============================================================================================================================
EXELIXIS Stock Study Analysis
Let’s dive into Exelixis, Inc. It’s a company that, at its core, is all about battling the big ‘C’ – cancer. With its razor-sharp focus on the discovery, development, and delivery of innovative cancer drugs in America, Exelixis is playing its part in this relentless fight.
Here’s the financial breakdown: Most of the company’s dollar signs come from its pharmaceutical arm, especially those drugs fighting against cancer. It’s not small potatoes either. With a hefty market cap north of $7 billion, it’s clear this California-based outfit has made its mark since its birth in 1994, thanks to its founder Dr. George A. Scangos.
But, and there’s always a ‘but’ in business, Exelixis is not alone on this battlefield. The biotech world is teeming with heavy hitters, names you know like Pfizer, Bristol Myers Squibb, and Roche, all vying for a piece of the oncology pie. The stakes? High. The competition? Fierce.
What intrigues me is this ever-evolving dance between biotech and oncology. The rapid strides in research are opening doors every day, and companies like Exelixis are poised to step through pioneering treatments that could fill gaps in our medical arsenal. Think about it: Innovative therapies? Check. Collaborative efforts with big pharma to expedite progress? Double check. But let me tell you, as much as this landscape brims with potential, it’s also riddled with pitfalls. The biotech world is not for the faint-hearted. Skyrocketing R&D costs, regulatory minefields, cutthroat competition – it’s all par for the course. And always, always that lurking question: Will the next drug pass the muster of clinical trials or face the dreaded FDA rejection?
All eyes are on Exelixis’ headline drugs: CABOMETYX, raking in an impressive $403.3 million annually, and COMETRIQ, pulling its weight with $25.3 million. But in this industry, it’s not just about the here and now. It’s about the next breakthrough, the next partnership, the next risk.
So, where does that leave us? Watching, waiting, and always, always rooting for those who are pushing boundaries in the pursuit of a cancer-free world. Stay tuned, folks. The story of Exelixis is one we’ll be tracking closely.
In this weekly stock study, we will look at and analyze the following indicators and metrics which are our guidelines to dictate our behavior regarding any stock analysis.
- Wall Street Analysts’ Estimates
- 52-week high and low boundaries
- Vantagepoint A.I. Triple Cross Indicator
- The Best Case – Worst Case Scenarios
- Neural Network Forecast
- Daily Range Forecast
- Intermarket Analysis
- Our trading suggestion
We don’t base our trading decisions on things like earnings or fundamental cash flow valuations. However, we do look at them to better understand the financial landscape that a company is operating under.
Wall Street Analysts’ Estimates
The 16 analysts offering 12-month price forecasts for Exelixis Inc have a median target of $25.50, with a high estimate of $32.00 and a low estimate of $18.00. The median estimate represents a +13.36% increase from the last price of $22.50.
What is fascinating for us to acknowledge is the VARIANCE range between the most bullish and bearish analysts on Wall Street. We calculate this number by subtracting the low forecast ($18) from the high forecast (432) and dividing that value by the current price of $22.50. This variance is 62.22% and it tells us what the expected volatility is based upon Wall Street Analysts.
52-Week High and Low Boundaries
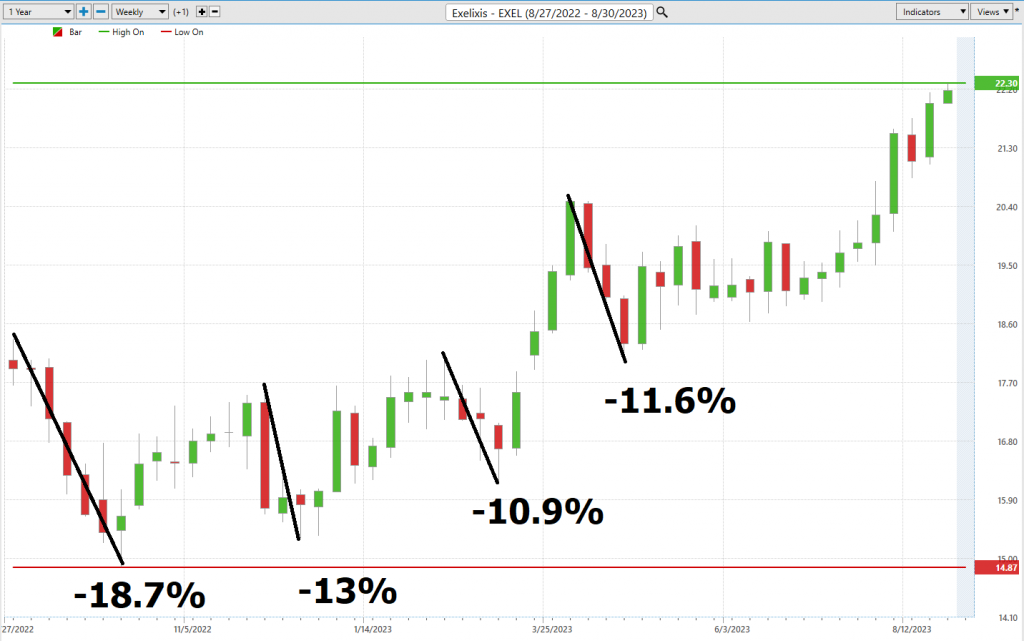
Over the past year we have seen Exelixis ($EXEL) trade as low as $14.87 and as high as $22.64. This tells us that the annual trading range is $7.77.
We would also like to divide the annual trading range of $7.77 into the current price of $22.50 to get a broad-based estimate of trading volatility. This tells us that the volatility of Exelixis ($EXEL) over the past year has been 34.5%. This value also provides us with a basic estimate in letting us know that if the future is like the recent past, it would be normal for $$IRBT to trade in a range that is 34.5% higher and/or lower than the current price over the next year.
More importantly we have two important estimates of volatility from our analysis so far.
Wall Street analysts tell us that they expect a variance of 62.2% around the current price of $22.50. Meanwhile the price history of the last year tells us that the statistical volatility of the past year is 34.5%. We would expect that over the next 12 months the volatility will be between these two levels.
Here is the annual 52-week chart of Exelixis ($EXEL) so that you can see the powerful price journey it has taken over the last few months.
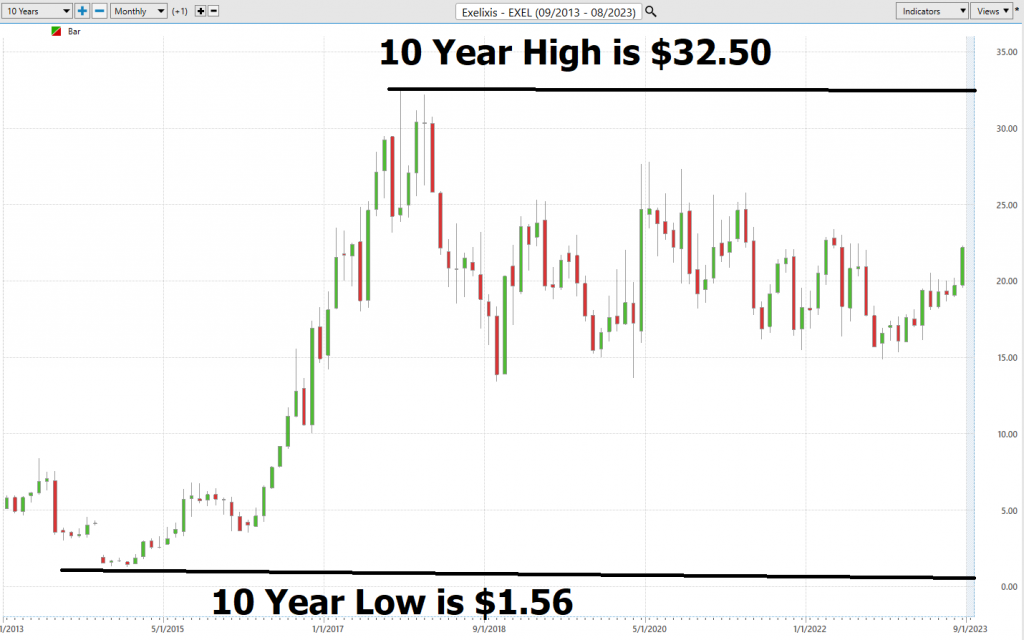
What is also very constructive is to look and examine the longer term 10 year monthly chart for Exelixis ($EXEL).
In the fast-paced world of Wall Street, the 52-week low price level serves as a pivotal beacon for the seasoned trader. It’s more than just a number; it’s a compass guiding them toward a security’s ‘fair value.’ When a stock flirts with this benchmark, trading considerably beneath its Wall Street estimates, it signals a potential bargain buying opportunity. The veterans in the trading floors often have an eagle eye on this, scouting for hints of a stock’s price bottoming out. Such a trend suggests that the stock might soon ride the bullish wave, making the 52-week low an indispensable tool in a trader’s analytical arsenal.
But here’s the rub: A stock skirting its 52-week low often rings alarm bells in the market. And if it continues its slide, setting a new 52-week low, the sentiment darkens further. However, seasoned investors know that it’s those very troughs, when tested and unbroken multiple times, that can precede monumental rallies. Case in point: Exelixis ($EXEL). The stock’s resilience at its 52-week low paved the way for a staggering 46% surge in a mere 7 MONTHS.
More importantly over the past 5 weeks Exelixis ($EXEL) has continued to make 52 week highs every week. Long time readers of our blog know that one of our all time favorite indicators and filters for finding great trading candidates is stocks that are making new 52 week highs.
To complete the picture, a deeper dive into Exelixis ($EXEL)’s decade-long monthly chart would be insightful. It’s these long-term trajectories that provide the broader context, so crucial in this world of highs and lows.
Best Case – Worst Case Scenario $EXEL
When appraising a potential trade or long-term asset commitment, it’s paramount to delve into the innate dynamics of the asset. One discerning method involves juxtaposing the asset’s peak rallies against its most pronounced declines, shedding light on its intrinsic volatility. Moreover, aligning the asset’s returns with the broad market indices furnishes an objective perspective.
One can’t mention risk without acknowledging the annualized volatility metric – a gauge that crystallizes the fluctuation amplitude of a stock’s price over time. Essentially, it represents the projected standard deviation observed amid regular market interactions. While raw numbers have their merit, our preference leans towards a more visual representation, adopting a best-case to worst-case scenario analysis. This dual-pronged approach bestows a deeper comprehension of what underlying volatility might mean for future returns.
At the core of proficient trading lies an astute grasp of potential asset volatility. In this high-stakes world, we’re chasing MOMENTUM. Yet, momentum walks a tightrope; a keen preliminary analysis can discern if an asset holds its ground after a rally. An essential marker: Exelixis ($EXEL) boasts an annualized volatility rate of 34.5%. In layman’s terms, over the impending 12 months, a 34.5% oscillation in either direction is within its typical behavior bandwidth.
Best-Case Scenario Analysis
Worst-Case Scenario Analysis
Lastly, drawing a parallel between $IRBT’s performance major stock market indices offers a holistic perspective.
We can quickly see with this type of analysis that Exelixis ($EXEL) has outperformed the broader market, but it has done so with significantly more volatility.
The Vantagepoint A.I. Triple Cross Indicator
The predictive triple cross indicator is the initial indicator which Power Traders use to monitor and navigate the trend. In financial analysis, the Vantagepoint A.I. Triple Cross indicator represents a noteworthy advancement. Diverging from the conventional two moving averages approach, it incorporates three predictive moving averages: a 3-day, an 8-day, and an 18-day. These have been structured to encompass short-term, medium-term, and long-term market fluctuations.
The methodology behind the Triple Cross is deliberate. When the short-term average surpasses the medium-term, it might suggest a potential shift in market dynamics. The more definitive indication arises when the medium-term average surpasses the long-term one, indicating a possible confirmed trend reversal. The combination of these three averages is what provides insight into market behavior.
The Triple Cross indicator, by virtue of its three-tiered predictive data, affords traders enhanced precision. It aims to mitigate extraneous market noise, caution traders against premature decisions, and warn against the erratic swings of an unstable market.
In the context of trading tools, the Triple Cross Indicator has positioned itself as a pivotal resource, proficient in detecting early market shifts, complemented by the three moving averages. The goal is to facilitate not just increased trades, but also more informed ones.
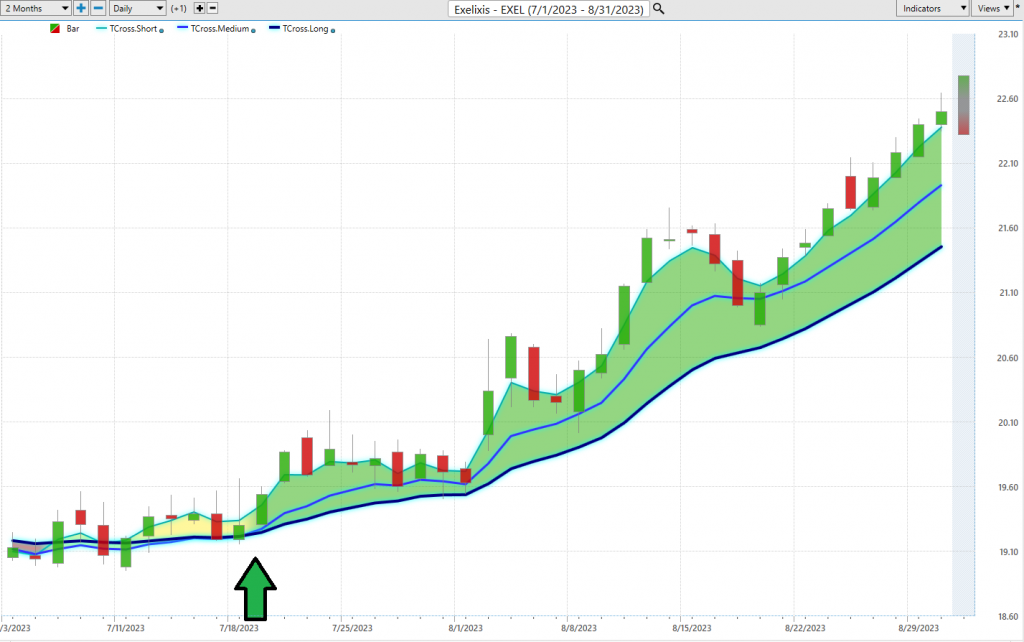
Let us now evaluate the recent performance metrics of Exelixis ($EXEL).
Next traders cross-reference this signal with the historical pattern recognition available with machine learning and the Neural Index.
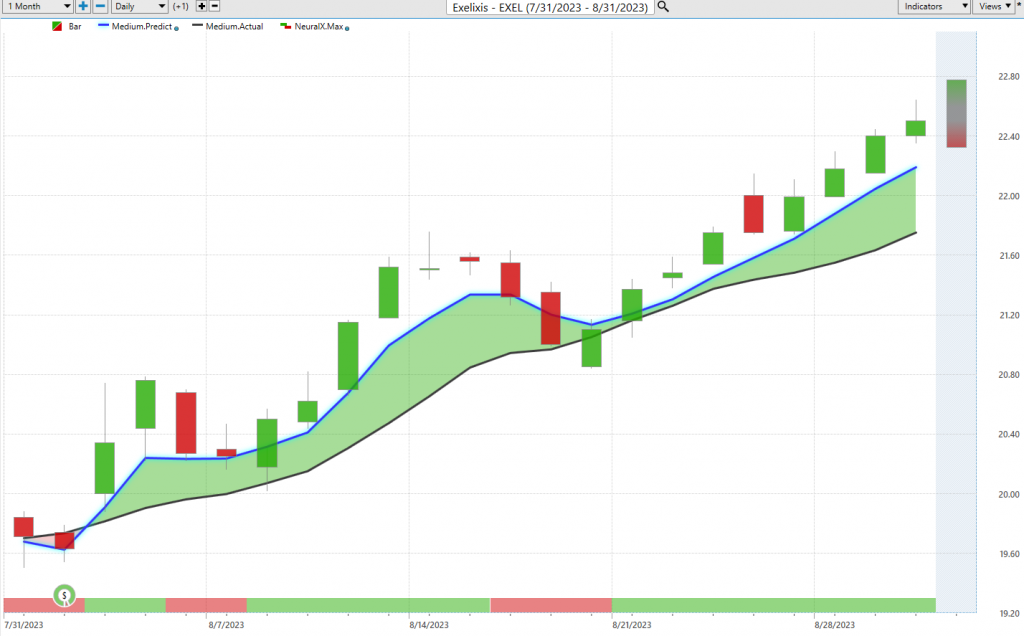
Neural Network Indicator (Machine Learning)
Let’s talk about the Neural Network Indicator you see at the bottom of the chart. Let’s break it down. Right at the bottom of our chart, you’ll spot something called the Neural Index Indicator. When you see a splash of green there, it’s telling you the market’s got some pep in its step. But when it flashes red, it’s hinting we might be heading for a little bit of downside price action.
Now, let’s pull back the curtain on this. Imagine a computer system fashioned after our own brain – it takes in information, processes it internally, and sends it out, all in the blink of an eye. Think of it as Wall Street’s own supercomputer, always learning, always evolving.
What’s it doing for traders? Well, it’s like giving them a pair of X-ray glasses. Neural networks sift through mounds of data, picking up patterns the naked eye might miss. They’re using history, current conditions, and some sophisticated algorithms to make sharp, precise market predictions. Simply put, they’re the secret weapon in a trader’s arsenal, offering an edge and helping them navigate the market’s choppy waters.
The pros, the Power Traders as we call them, are on the lookout for a DOUBLE confirmation signal. It’s like having two expert analysts nodding in agreement. If both the blue predictive line and that Neural Net are hinting at the same future trend, it’s like the market’s giving you a wink and a nudge.
We always tell Power Traders: Sync up the chart with that blue line and the Neural Network Indicator. That’s your map to pinpointing the perfect moments to jump in or bow out. If both the A.I. forecast and the Neural Net are flashing green – bingo! You’ve got a buying opportunity. If they’re both signaling red, well, it might be time to take a step back.

Take a look at the chart, and those arrows will show you where the stars aligned, where the A.I. synchronized up with the Neural Net, presenting those excellent opportunities. Power Traders, they live for this. They’re leveraging both these tools, the Neural Network and A.I., to spot the best bets in the market.
Power Traders are always looking to apply both the Neural Network and A.I. to the markets to find statistically sound trading opportunities.
VantagePoint Software Daily Price Range Prediction
Here are the average trading range metrics for Exelixis ($EXEL) over the past year on a daily, weekly, and monthly basis.
For those Power Traders who religiously swear by VantagePoint Software, there’s a feature they often turn to, like clockwork: the Vantagepoint Daily Price Range forecast. It’s as if this tool has become their market compass, guiding them through the tricky terrains of buying and selling.
Now, for any trader out there, the daily dilemma – and trust me, it’s an agonizing one – is pinpointing the exact moments to make a move in the market. But with VantagePoint’s A.I. and this Daily Price Range Forecast, it’s like having a seasoned mentor whispering wisdom in your ear.
That brings us to the three cornerstones of trading: volatility, opportunity, and risk. Think of volatility as the heartbeat of the market. It’s dynamic, it’s pulsating, but it also comes with its share of palpitations. For all its potential windfalls, volatility can be a double-edged sword, slashing your investments if you’re not careful. So, the savvy trader has a game plan, armed with risk mitigation tactics like stop-loss orders, a sprinkle of diversification, and a constant pulse check on how much risk they can stomach.
Enter the VantagePoint A.I.’s daily range forecast. Imagine if you could get a hint, a nudge, about where the market might venture next. By catching opportunities at the low end of the predicted range and potential exits at the peak, traders can potentially turn the tide in their favor, all while keeping risks on a tight leash.
But here’s the kicker: the stock market’s daily price isn’t just swayed by boardroom decisions or quarterly reports. Anything from a tweet to a tempest can tip the scales. So, forecasting? It’s no child’s play. But VantagePoint A.I. seems to have found a sweet spot, blending A.I., neural wizardry, and machine learning, all in the pursuit of that elusive, perfect forecast.
Here is the chart of Exelixis ($EXEL) with the Vantagepoint A.I. Daily Range forecast over the past few months.
Observe how clearly the trading channel is delineated with exacting precision.
Intermarket Analysis
In the trading world, there’s an old saying: it’s not just what you know, but how you act on what you know. Traders, like sleuths, are always seeking out the why behind stock price movements. Because while headlines might captivate the masses, traders are digging deeper, hungry for the true forces at play.
Enter Intermarket analysis. Think of it as the backstage pass to the financial concert. It’s peering into the intricate dance between stocks, bonds, commodities, and currencies. It’s understood that when one asset struts its stuff, another might just take a back seat.
Let me paint a clearer picture: say you’re examining the drivers behind the stock Exelixis ($EXEL). While most may settle for a cursory glance, those in the know would be examining the top 31 catalysts pushing and pulling its price.
But what is this intermarket analysis all about? At its core, it’s recognizing the delicate domino effect within global markets. A surge in oil prices might not just mean pricier gas for your car; it might hint at spiraling costs for companies, potentially deflating their stock values. Or a shift in bond yields could suddenly make other assets more (or less) alluring, shaking up where investments flow and even jolting currency values.
For the uninitiated, John J. Murphy wrote the playbook on this strategy with “Intermarket Technical Analysis.” It’s a deep dive into how markets are intertwined in a dance of trends and signals. Then, you’ve got folks like Lou Mendelsohn of Vantagepoint Software, leading the pack in fine-tuning these market relationships, making them digestible for traders.
So, to all the traders out there: next time you’re puzzling over a stock’s rise or fall, remember the broader symphony at play. Because understanding these intermarket relationships? That’s where the real music happens.
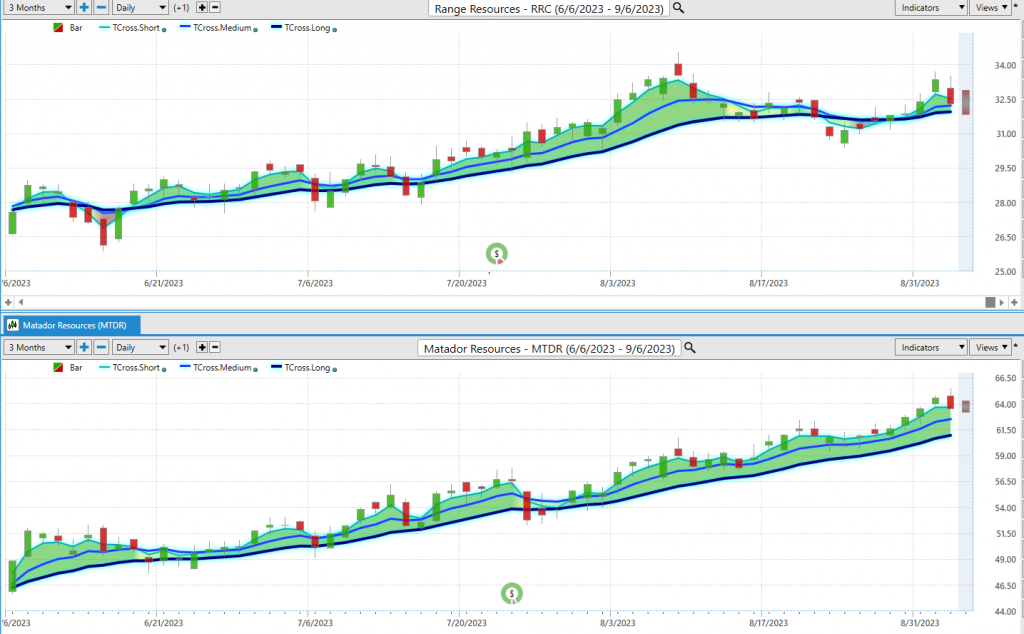
Here is the Intermarket Analysis graphic for Exelixis:
Intermarket analysis helps traders understand price movement by identifying intermarket relationships that influence market behavior. For instance, a rise in oil prices may lead to higher production costs for companies, impacting their stock prices and potentially weakening the broader stock market. Similarly, changes in bond yields can affect the attractiveness of different asset classes, triggering shifts in investment flows and impacting currency exchange rates.
By analyzing these intermarket relationships, traders can anticipate potential shifts in market conditions, identify trends across related markets, and make more accurate predictions about price movements. This understanding enables traders to adjust their trading strategies accordingly, exploit opportunities arising from intermarket correlations, and minimize potential risks associated with interconnected markets.
We live in a global marketplace.
Everything is interconnected.
Interest rates, Crude Oil Prices, and the volatility of the Dollar amongst thousands of other variables affect the decisions companies must make to flourish and prosper in these challenging times. Trying to determine what these factors are is one of the huge problems facing investors and traders.
Our Suggestion
In the competitive world of pharmaceuticals, Exelixis is making waves, primarily thanks to its star player, the cancer drug Cabometyx. Medicine isn’t just another name in the vast oncology market; it’s a breakthrough. It claimed the coveted distinction of being the FDA-approved treatment for renal cell carcinoma (RCC) with proven clinical results. We’re talking about tangible benefits like prolonged survival, delay in symptom progression, and a clear response in a significant percentage of patients.
This kind of success doesn’t go unnoticed. If you’ve been keeping an eye on the market, Exelixis’ upward trajectory has been hard to miss. Some may argue that in these turbulent times, healthcare firms like Exelixis naturally have a buffer against economic downturns. But it’s not just the market optimism; the numbers behind Cabometyx are doing the talking.
Yet, every astute business knows it’s risky to hinge hopes on one star product. Recognizing this, Exelixis is looking ahead, venturing into new avenues. They’ve kick-started a phase 3 clinical trial for XL092, aiming to tackle metastatic colorectal cancer – a disease that ranks high on the list of America’s most lethal cancers, especially when it’s caught late.
So, while Cabometyx may be today’s headline, Exelixis is ensuring it’s not tomorrow’s history. The pursuit for the next breakthrough continues, and for patients and investors alike, that’s promising news.
Analysts believe that earnings are set to grow by 25.7% per year. After the most recent rally INSIDERS at Exelixis ($EXEL) have started to sell stock so caution is advised. Expect some serious volatility here.
Regardless, this stock deserves to be on your trading radar as it will provide numerous trading opportunities in the coming 12 months.
We will continue to use the a.i. to guide our positioning.
Practice solid money management on all your trades.
We will re-evaluate based upon:
- New Wall Street Analysts’ Estimates
- New 52-week high and low boundaries
- Vantagepoint A.I. Forecast (Predictive Blue Line)
- Neural Network Forecast
- Daily Range Forecast
Let’s Be Careful Out There!
It’s Not Magic.
It’s Machine Learning.
Disclaimer: THERE IS A HIGH DEGREE OF RISK INVOLVED IN TRADING. IT IS NOT PRUDENT OR ADVISABLE TO MAKE TRADING DECISIONS THAT ARE BEYOND YOUR FINANCIAL MEANS OR INVOLVE TRADING CAPITAL THAT YOU ARE NOT WILLING AND CAPABLE OF LOSING.
VANTAGEPOINT’S MARKETING CAMPAIGNS, OF ANY KIND, DO NOT CONSTITUTE TRADING ADVICE OR AN ENDORSEMENT OR RECOMMENDATION BY VANTAGEPOINT AI OR ANY ASSOCIATED AFFILIATES OF ANY TRADING METHODS, PROGRAMS, SYSTEMS OR ROUTINES. VANTAGEPOINT’S PERSONNEL ARE NOT LICENSED BROKERS OR ADVISORS AND DO NOT OFFER TRADING ADVICE.