| This week’s stock analysis of Crude Oil, Range Resources Corporation and Matador Resources. |
Crude oil, often referred to as “black gold,” is undeniably one of the most essential commodities in the world. This moniker is not merely a reflection of its dark, viscous appearance but more significantly, an acknowledgment of its immense value and influence. Just as gold has historically been a standard for wealth and economic stability, crude oil represents the lifeblood of modern industrialized nations. It powers our vehicles, heats our homes, and is the raw material for countless products, from plastics to pharmaceuticals. In essence, energy derived from oil is the driving force that keeps the wheels of the global economy turning.
The analogy of crude oil to gold extends beyond its economic value. Just as nations once vied for control of gold mines and trade routes, today’s geopolitical landscape is significantly shaped by the quest for oil reserves. Countries with abundant oil reserves, such as Saudi Arabia, Russia, and Venezuela, wield considerable influence on the global stage, often using their oil production and pricing strategies as tools of diplomacy or leverage. Conversely, nations without domestic oil sources find themselves intricately tied, and sometimes beholden, to those that do.
The importance of crude oil in geopolitics is evident in various historical and contemporary events. The 1973 oil embargo by OPEC nations against the U.S. and its allies was not just an economic move but a political response to the West’s support of Israel during the Yom Kippur War. This embargo led to widespread fuel shortages, soaring prices, and underscored the West’s vulnerability to oil supply disruptions. More recently, disputes in the South China Sea can be traced back to the vast untapped oil and gas reserves in the region, with multiple countries staking territorial claims.
The price of crude oil plays a crucial role in the global economy, and its fluctuations can have direct and indirect impacts on inflation. Here’s how the two are often intertwined:
1. Direct Impact on Consumer Goods: Crude oil is the primary raw material for gasoline and heating oil. When its price rises, the cost of these fuels typically increases for consumers. This direct price increase contributes to the overall rise in the Consumer Price Index (CPI), a key measure of inflation. For many households, especially in car-dependent societies, gasoline is a significant expenditure, and any increase in its price can strain household budgets.
2. Indirect Impact through Production Costs: Crude oil is not just a source of fuel; it’s also a raw material for a wide range of products, from plastics to chemicals. When crude oil prices surge, the production costs for many goods rise. Manufacturers, facing increased costs, often pass these on to consumers in the form of higher prices, leading to cost-push inflation.
3. Transportation Costs: Almost all goods, at some point in their lifecycle, need to be transported. Whether raw materials being shipped to factories or finished products being delivered to retailers, transportation is a key component of the global supply chain. As crude oil prices rise, so do transportation costs, given the direct relationship with fuel prices. This, in turn, can elevate the prices of goods, adding to inflationary pressures.
4. Expectation-driven Inflation: Inflation is not just driven by actual cost increases but also by expectations. If businesses expect that oil prices will continue to rise, they might preemptively raise prices. Similarly, if workers expect higher living costs due to rising oil prices, they might demand higher wages, which can then push costs up further. This cycle of expectation and response can exacerbate inflationary trends.
5. Monetary Policy Response: Central banks closely monitor inflation. If they perceive that rising oil prices are driving inflation beyond their target range, they often respond by adjusting monetary policy, often by raising interest rates. While this can dampen inflation, it can also have broader economic impacts, potentially slowing down economic growth.
In conclusion, while many factors influence inflation, the price of crude oil is undeniably a significant contributor. Its pervasive role in the global economy means that sharp increases in its price can ripple through various sectors, driving up costs and prices, and thereby exerting inflationary pressures. Central Bankers cannot print more crude oil! Crude oil’s significance extends far beyond its role as a source of energy. It is a pivotal element in the geopolitical chessboard, influencing international relations, shaping alliances, and often being at the heart of conflicts. As the world grapples with the challenges of climate change and a shift towards renewable energy, the role of crude oil may evolve, but its influence as “black gold” in the annals of global politics and economy is indelible.
In this stock study, we will focus on the recent breakout on the charts of the Crude Oil price and two smaller cap oil and gas producers who we think could be long-term beneficiaries. They are Range Resources Corporation ($RRC) and Matador Resources ($MTDR).
First off let’s look at the price of Crude Oil year to date.
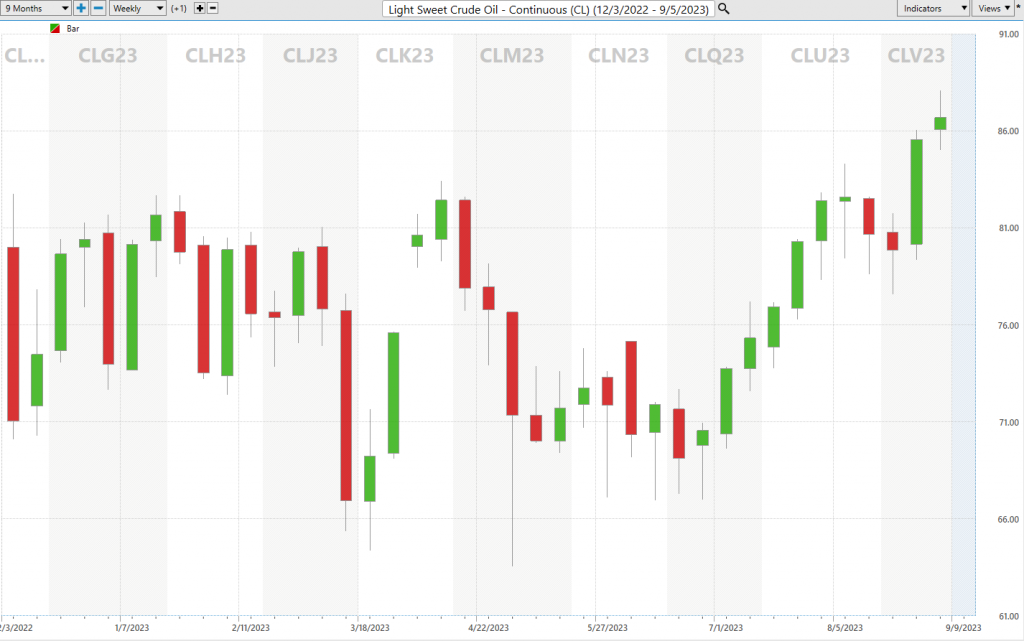
Crude Oil has broken out for a lengthy consolidation pattern. This is noteworthy because higher Crude Oil prices do not bode well for the broader market historically.
Benjamin Graham, often hailed as the “father of value investing,” laid the foundation for an investment philosophy that has deeply influenced some of the world’s most successful investors, including Warren Buffett. At the core of Graham’s approach was the principle of seeking intrinsic value. He believed that the stock market frequently mispriced stocks, driven by emotional factors like fear and greed rather than rational analysis. This mispricing presented opportunities for astute investors to buy undervalued stocks at a discount to their true worth, providing a margin of safety.
Central to Graham’s value approach was the emphasis on the Price-to-Earnings (P/E) ratio, a tool he used to identify undervalued companies. He often sought companies trading at low P/E ratios, indicating that the stock price was low relative to the company’s earnings. This approach was rooted in his belief in rigorous analysis and a clear distinction between “investing” and “speculating.” For Graham, investing was about assessing the fundamentals of a company, such as its earnings, dividends, and overall financial health, and then comparing these fundamentals to its current market price. If the stock was trading at a significant discount to its intrinsic value, as indicated by metrics like the P/E ratio, it represented a potential investment opportunity.
Warren Buffett, a student of Graham, internalized these principles and adapted them to his own investment style. While Buffett expanded on Graham’s teachings, incorporating qualitative factors like the quality of company management, the essence of seeking undervalued companies and emphasizing a margin of safety remains central to his approach. In essence, Graham’s philosophy of rational, value-driven investing laid the groundwork for Buffett’s legendary investment career, emphasizing the importance of understanding what one is buying, and at what price. Value investing, as championed by Benjamin Graham, focuses on identifying and purchasing stocks below their intrinsic value, emphasizing long-term growth and company fundamentals. In contrast, trading capitalizes on short-term stock price movements, often using technical analysis and market trends. While value investors seek undervalued companies for long-term gains, traders aim for quick profits from market fluctuations.
Traditionally VALUE investing often takes a back seat to trading particularly when the going is good, and the economy is booming. However, in tougher economic environments, value investors often shine. By simply exploring the price to earnings ratios of some smaller cap oil and gas exploration companies we can see that the entire sector is dramatically undervalued.
As a datum for comparison, the p/e multiple of the S&P 500 Index is 23.46 to 1. The p/e multiple of the Magnificent 7, (Microsoft, META, Apple, Tesla, Amazon, Nvidia, Alphabet) is 112 to 1. These oil and gas exploration companies could currently be considered a “value investor’s dream .”
There are three factors in the broader markets that are concerning. Earnings are down 5% year over year. Interest rates are up massively, and stocks are up 16% year to date. These elements do not align. Companies are making less money. The cost of capital is higher. Yet, stock prices have surged. Now with Crude Oil breaking out we anticipate a return of inflationary pressures.
In this weekly stock study, we will look at and analyze the following indicators and metrics for $RRC and $MTDR which are our guidelines to dictate our behavior regarding any stock analysis.
- Wall Street Analysts’ Estimates
- 52-week high and low boundaries
- Vantagepoint A.I. Triple Cross Indicator
- Neural Network Forecast
- Daily Range Forecast
- Intermarket Analysis
- Our trading suggestion
We don’t base our trading decisions on things like earnings or fundamental cash flow valuations. However, we do look at them to better understand the financial landscape that a company is operating under.
Analysts Ratings
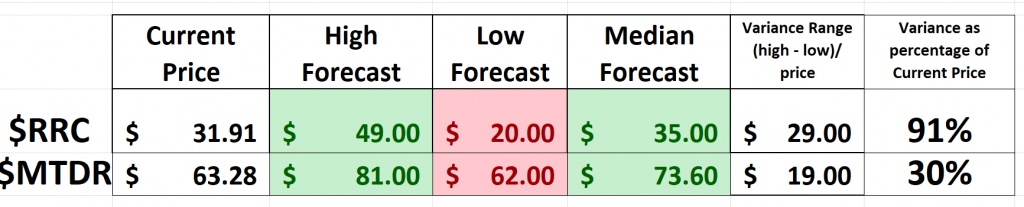
The 25 analysts offering 12-month price forecasts for Range Resources Corp have a median target of 35.00 , with a high estimate of 49.00 and a low estimate of 20.00. The median estimate represents a +8.46% increase from the last price of 32.27.
Based on 6 Wall Street analysts offering 12-month price targets for Matador Resources in the last 3 months. The average price target is $73.60 with a high forecast of $81.00 and a low forecast of $62.00 . The average price target represents a 19.48% change from the last price of $61.60.
By simply subtracting the low forecast from the high forecast we can get an estimate of what potential volatility will be for these stocks over the coming 12 months. Quickly, you can see that $RRC has a variance of 91% which is extremely high when you compare wall street analysts estimates. This means volatility is baked in and these assets will present great trading opportunities as well.
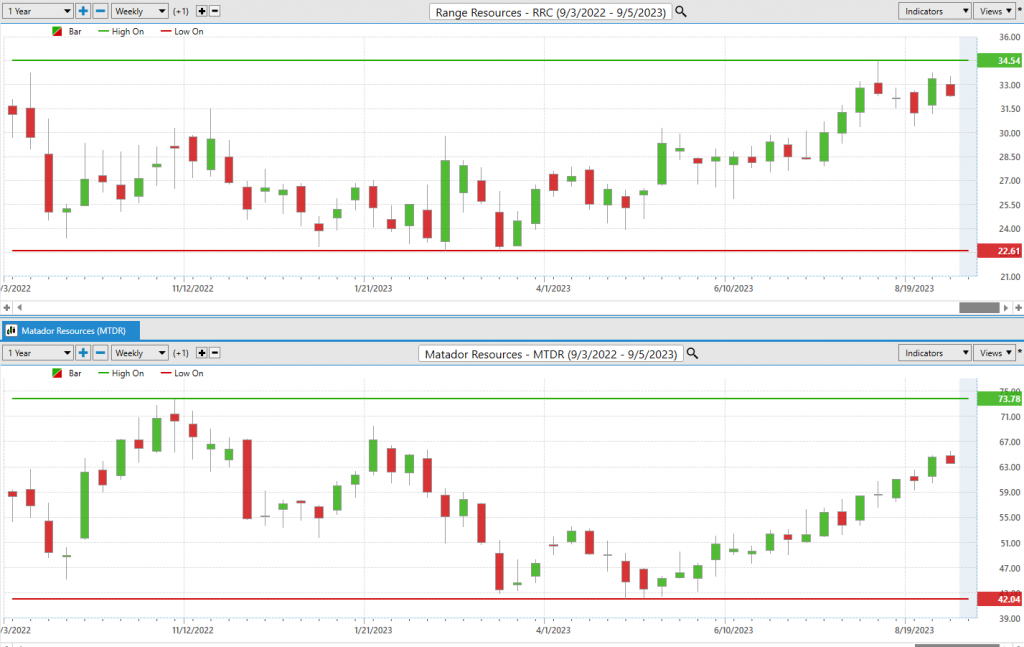
52-week High-Low Boundaries
One of our favorite metrics is looking at the past volatility of the most recent 52 weeks. We can do this by dividing the annual range by the current price. This calculation gives us a number which we refer to as statistical volatility . This value is always expressed as a percentage and tells us the expected variance we should expect to see around the current price over the next 12 months based upon past history.
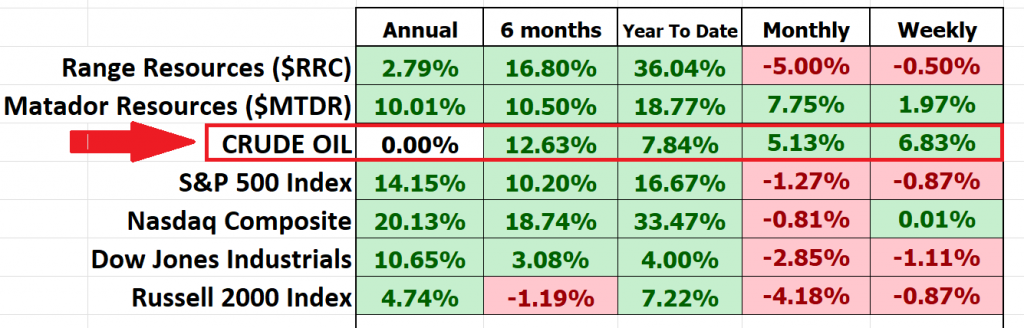
This simple perspective tells us that we should expect Range Resources $RRC to trade 33.5% higher and or lower than its current price over the coming year. $MTDR should be expected to trade 50% higher and or lower than its current price over the following year.
You can see from the charts that both $RRC and $MTDR are testing their 52-week highs. When we evaluate these two oil and gas exploration companies, we can see that for the most part they are performing comparable to the broader market and this reality is mostly unnoticed by traders and investors.
The Vantagepoint A.I. Triple Cross Indicator
Power Traders are setting their sights on the Triple Cross indicator as their go-to tool to gauge and steer through market trends. Now, here’s where it gets interesting: Vantagepoint A.I. has taken a leap forward with this Triple Cross indicator. Instead of the usual duo of moving averages, they’ve thrown in a third, capturing the short, medium, and long-term market vibes with a 3-day, 8-day, and 18-day predictive average.
So, how does this all play out? Well, when the short-term average edges out the medium-term, traders, you might want to sit up – the market could be hinting at a change. But the real ‘aha’ moment? That’s when the medium-term average outpaces the long-term, signaling a potential trend flip.
The genius of the Triple Cross is its three-pronged approach, giving traders that extra edge. It’s designed to cut through the market chatter, urging traders to hold their horses before making a move and to stay wary of those wild market mood swings.
Bottom line? The Triple Cross Indicator isn’t just another tool in the trader’s toolbox. With its trio of moving averages, it’s on the front line, spotting those early market moves. The aim? Smarter, sharper trades.
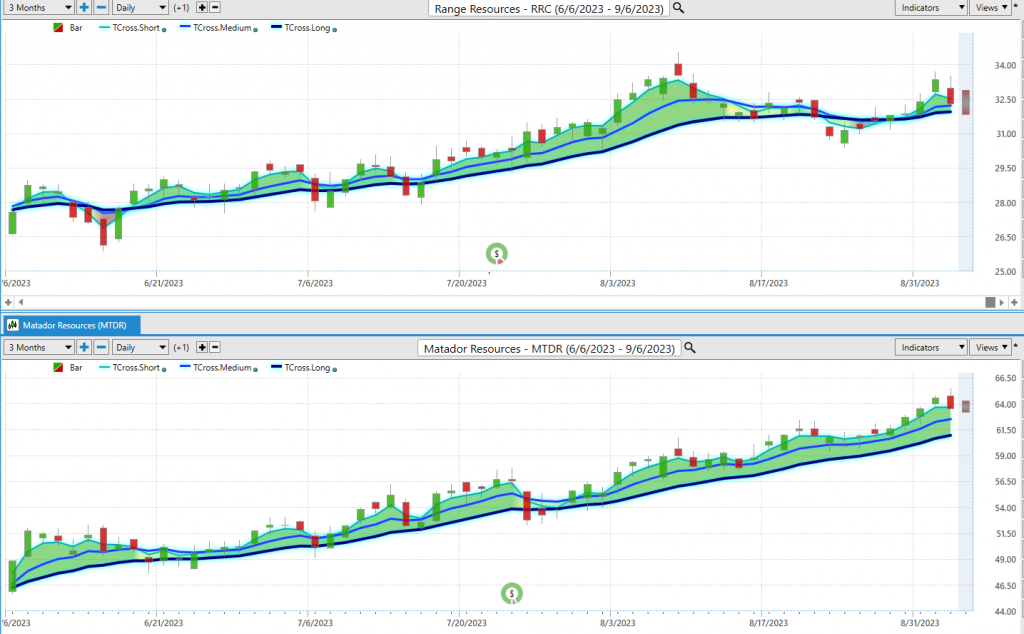
When we apply the Triple Cross to $RRC and $MTDR you can quickly see its effectiveness in navigating the longer-term trend.
Fine Tuning Entries with the Neural Index Indicator (Machine Learning)
Shifting our focus to the chart’s base, the Neural Network Indicator emerges as a key player. This tool, represented by green and red flashes, serves as a barometer for market momentum. A green hue suggests bullish sentiments, while a red implies potential bearish trends.
Delving deeper, envision a digital architecture mirroring the human brain’s intricacies. This high-tech system rapidly assimilates, processes, and disseminates data, akin to Wall Street’s evolving computational prodigy.
For traders, this translates to unparalleled market clarity. Neural networks meticulously analyze vast datasets, identifying subtle patterns often overlooked. By amalgamating historical data, prevailing market conditions, and advanced algorithms, they craft astute market forecasts. In essence, they’ve become an indispensable tool, granting traders a distinct advantage amidst the market’s unpredictable ebbs and flows.
Seasoned traders, often termed ‘Power Traders’, ardently seek a dual confirmation signal. It’s the financial equivalent of two seasoned analysts concurring on a prognosis. When the Triple Cross and the Neural Network converge on a similar trajectory, it’s akin to the market offering tacit guidance.
The mantra for Power Traders remains consistent: Align your strategies with the blue predictive line and the Neural Network Indicator. This combination serves as a compass, highlighting opportune moments for market entry or exit. A concurrent green signal from both the A.I. forecast and the Neural Network suggests a prime buying window. Conversely, dual red signals might warrant a more cautious approach.
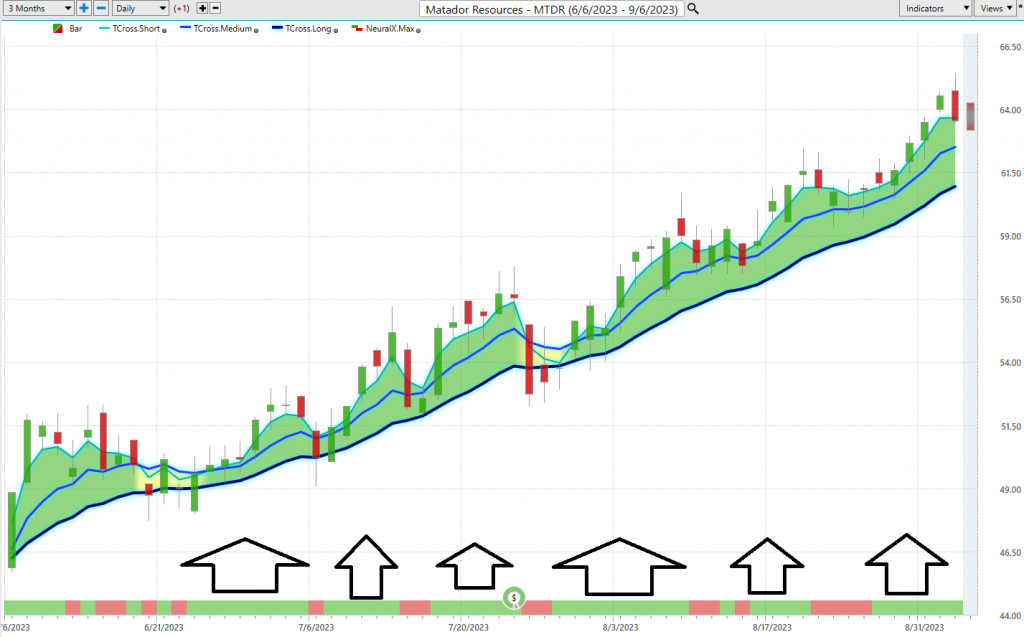
Examining the $RRC and $MTDR charts with VantagePoint A.I.’s Neural Index Forecast, the arrows demarcate instances where the A.I. and Neural Network harmoniously signaled prime market opportunities. For Power Traders, this synergy is paramount. They harness the combined prowess of Neural Networks and A.I. to pinpoint the market’s most promising ventures.
In summation, Power Traders consistently leverage the dual might of Neural Networks and A.I., aiming to unearth the most statistically robust market opportunities.
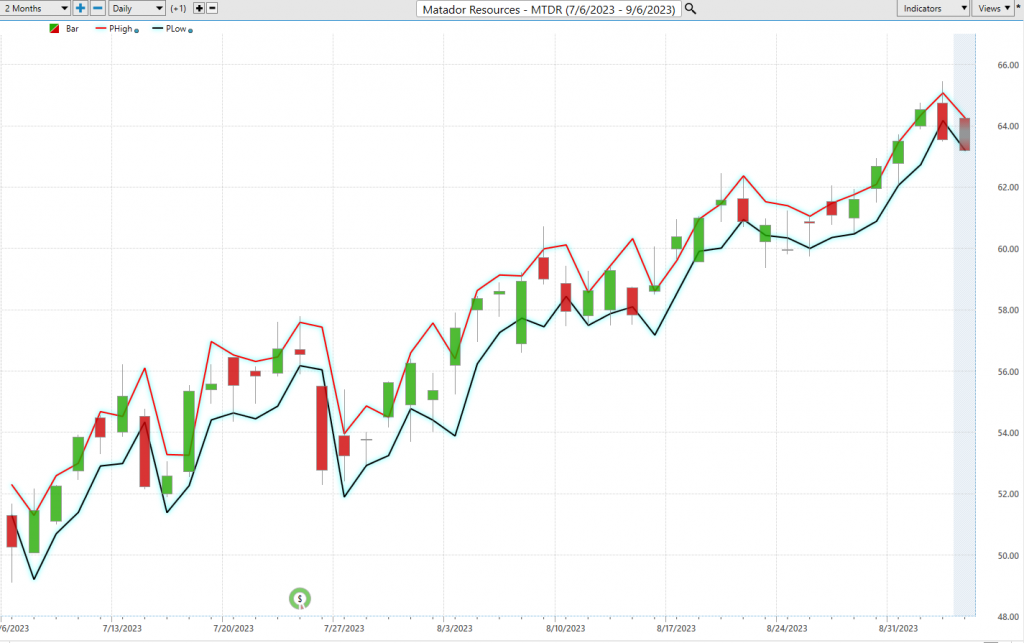
The Vantagepoint A.I. Daily Range Forecast
For those Power Traders who’ve made VantagePoint Software their go-to, there’s one feature they’re checking out every morning: the Vantagepoint Daily Price Range forecast. It’s become their North Star, guiding them through the market’s twists and turns.
Every trader I’ve spoken to grapples with the same question daily: When’s the right moment to jump into the market? But here’s the game-changer: with VantagePoint’s A.I. and that Daily Price Range Forecast, it’s like having a Wall Street veteran right by your side, giving you the inside scoop.
Now, let’s talk about the big three in trading: volatility, opportunity, and risk. Volatility? Think of it as the market’s heartbeat. It’s alive, it’s kicking, but boy, can it throw you for a loop. And while it promises big rewards, it can also be a trader’s worst nightmare if you’re not on your toes. That’s why the pros have a strategy, equipped with tools like stop-loss orders, a diversified portfolio, and a clear sense of their risk appetite.
This is where VantagePoint A.I.’s daily range forecast comes into play. Imagine getting a heads-up on the market’s next move. By seizing opportunities at the forecast’s lower end and spotting exits at its zenith, traders have a shot at steering the ship their way, all while keeping risks in check.
But here’s something to chew on: stock prices aren’t just about earnings calls or mergers. From a tweetstorm to global events, anything can shake things up. Predicting the market? It’s an art and a science. Yet, VantagePoint A.I. seems to have cracked the code, melding A.I., neural tech, and machine learning, all chasing that golden forecast.
Here are the charts for $RRC and $MTDR, respectively. Observe how the Vantagepoint A.I. Daily Range forecast clearly delineates the trend and provides a very precise exacting analysis daily with immense precision.
Intermarket Analysis
In the intricate world of financial markets, Vantagepoint Software stands out with its adeptness in Intermarket analysis, pinpointing the intertwined assets that influence an assets price trajectory. While chart analysis offers a clear lens into support and resistance levels, the globalized nature of today’s markets demands a broader perspective. For traders, the perennial challenge isn’t just gathering knowledge but effectively leveraging it. Beyond the headlines, they’re delving into the underlying dynamics steering stock prices.
Enter the realm of Intermarket analysis, the financial world’s equivalent of having a behind-the-scenes tour. It’s an exploration of the nuanced interplay among stocks, bonds, commodities, and currencies. When one asset takes the spotlight, another might recede into the shadows.
While a superficial analysis might suffice for many, the discerning eye would probe the 31 pivotal factors influencing its price. Intermarket analysis, at its essence, deciphers the ripple effects coursing through global markets. A spike in oil prices might resonate beyond the pump, potentially impacting corporate bottom lines and stock valuations. Similarly, a fluctuation in bond yields could redirect investment currents, even influencing currency valuations.
For those unfamiliar, John J. Murphy’s “Intermarket Technical Analysis” is the seminal guide on this approach, elucidating the interwoven tapestry of market trends. Innovators like Lou Mendelsohn of Vantagepoint Software are at the forefront, refining these market interrelations for trader consumption.
So, a word to traders: When dissecting a stock’s performance, tune into the broader orchestration. Grasping these intermarket ties is where the magic truly unfolds. These subtle influences, often elusive to the untrained eye, exhibit strong statistical correlations. Factors like interest rate tweaks, crude oil price shifts, and dollar volatility, among myriad others, shape corporate strategies in today’s volatile landscape. Deciphering these elements remains a colossal task for investors and traders alike.
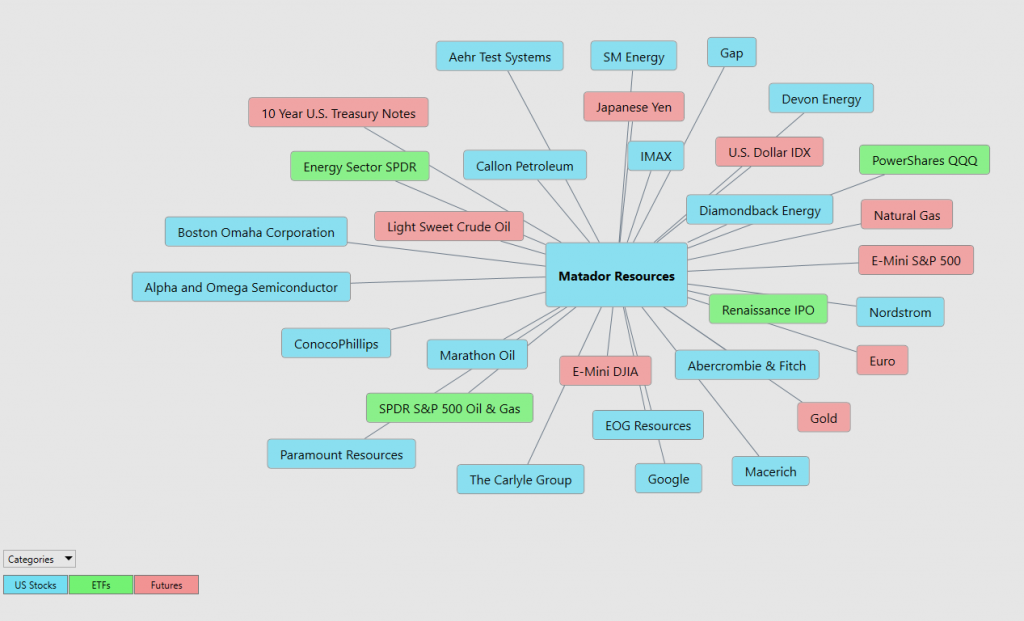
There’s immense insight to glean from dissecting the primary drivers of $RRC and $MTDR’s price movements. Such an analysis can illuminate which ETFs might be gravitating towards $RRC and $MTDR, and spotlight other sectors influencing their price trajectory. Often, industry stalwarts emerge, unveiling a trove of potential trading avenues worth pursuing.
Our Suggestion
Inflation, often dubbed the “silent eroder of wealth,” wreaks havoc on companies’ balance sheets, earnings, and valuations. As prices rise, the purchasing power of cash reserves diminishes, and the real value of debt can escalate, putting strain on a company’s financial health. Moreover, as input costs surge, profit margins can be squeezed, leading to subdued earnings. This, in turn, can distort valuation metrics, making companies appear overvalued even if their operational performance remains robust.
In such turbulent financial waters, VALUE investing regains its allure and becomes the beacon for many investors. When earnings and valuation levels soar to dizzying heights, the principles of value investing—focusing on intrinsic value, margin of safety, and long-term perspective—provide a semblance of stability and rationality. It’s a return to the basics, a shift from the speculative to the substantive, emphasizing companies that are undervalued based on their fundamentals.
With the S&P 500 Index is 23.46 to 1 as a p/e multiple and the p/e multiple of the Magnificent 7, (Microsoft, META, Apple, Tesla, Amazon, Nvidia, Alphabet) is 112 to 1 it is prudent to be cautious of the broader market and pay attention to CRUDE OIL prices surging.
For seasoned investors who’ve weathered previous inflationary storms, the crude oil sector emerges as a focal point. Recognizing the sector’s inherent value and its cyclical nature, value investors are channeling their resources, energy, and expertise into this arena. With a long-term lens, they see beyond the immediate challenges, betting on the sector’s resilience and potential for rebound. In the dance of market dynamics, as inflation takes center stage, value investing in sectors like crude oil becomes the astute countermove.
The oil and gas exploration sector, in the grand marketplace of industries, currently resembles those coveted items in a store’s liquidation bin, marked down by a staggering 90%. Just as astute shoppers recognize the inherent value in these steeply discounted products, discerning investors see the sector’s undervaluation as an excellent opportunity. Amidst the broader market’s fluctuating dynamics, this sector stands out, offering assets at a fraction of their intrinsic worth, beckoning those with a keen eye for value and long-term potential. However, Vantagepoint A.I. traders can exploit the short-term trends as well with the assistance of the artificial intelligence.
We think Range Resources and Matador Resources are poised to follow Crude Oil prices substantially higher.
We will continue to use the a.i. to guide our positioning.
Practice solid money management in all your trades.
We will re-evaluate based upon:
- New Wall Street Analysts’ Estimates
- New 52-week high and low boundaries
- Vantagepoint A.I. Forecast (Predictive Blue Line)
- Neural Network Forecast
- Daily Range Forecast
Let’s Be Careful Out There!
It’s Not Magic.
It’s Machine Learning.
Disclaimer: THERE IS A HIGH DEGREE OF RISK INVOLVED IN TRADING. IT IS NOT PRUDENT OR ADVISABLE TO MAKE TRADING DECISIONS THAT ARE BEYOND YOUR FINANCIAL MEANS OR INVOLVE TRADING CAPITAL THAT YOU ARE NOT WILLING AND CAPABLE OF LOSING.
VANTAGEPOINT’S MARKETING CAMPAIGNS, OF ANY KIND, DO NOT CONSTITUTE TRADING ADVICE OR AN ENDORSEMENT OR RECOMMENDATION BY VANTAGEPOINT AI OR ANY ASSOCIATED AFFILIATES OF ANY TRADING METHODS, PROGRAMS, SYSTEMS OR ROUTINES. VANTAGEPOINT’S PERSONNEL ARE NOT LICENSED BROKERS OR ADVISORS AND DO NOT OFFER TRADING ADVICE.