| This week’s a.i. Stock Spotlight is Waste Management ($WM) |

Waste Management (NYSE: WM) should unquestionably be on the radar of traders and investors in 2024 for several compelling reasons. Firstly, WM boasts a rich history and a strong track record of success in the waste management industry. Founded in 1968 in Chicago, the company has consistently ranked on the Fortune 500 list, reflecting its enduring financial stability and growth potential. With a recent history of strategic mergers, including the acquisition of Advanced Disposal Services in 2019, Waste Management continues to expand its reach and market presence, making it an intriguing prospect for traders looking for established, resilient stocks in their portfolios. Turning to their product portfolio, Waste Management primarily provides waste collection, recycling, and disposal services. Waste collection makes up a significant portion of their revenue, but they also generate income through recycling efforts and landfill operations.
Secondly, Waste Management is at the forefront of sustainability initiatives within the waste industry. The company has set ambitious goals to reduce greenhouse gas emissions, increase recycling rates, and invest in cleaner waste-to-energy technologies. Notably, they operate over 130 landfill gas-to-energy projects, turning methane gas from landfills into electricity. With a commitment to environmental responsibility and a dedication to cleaner transportation through one of the largest fleets of natural gas-powered collection trucks in North America, Waste Management aligns itself with the growing demand for environmentally conscious companies, making it an attractive choice for socially responsible investors. During a climate investment surge, this unexpected sector is emerging as a major player. Leading the charge is North America’s premier landfill operator, $WM, a company that’s long been the stalwart of garbage collection and landfill management. If you’ve ever tossed anything in the trash in America, it’s a good bet WM was behind the scenes, handling your refuse. But here’s where it gets interesting: starting in 2026, WM is pivoting towards sustainability-focused initiatives, projected to constitute a whopping 15% of its total profits, translating to around $740 million annually. This strategic shift is not just about being eco-friendly; it’s a savvy business move, leveraging government tax credits and tapping into the burgeoning market for renewable energy and recycled materials. This is the new business calculus for WM.
Over the next four years, WM is pouring $1.2 billion into transforming decaying garbage into fuel. As trash decomposes in landfills, it releases various gases, including methane – a potent environmental adversary, more damaging than carbon dioxide. In a significant shift from the past practice of simply burning off this methane, WM is now harnessing these gases. Despite the higher costs compared to traditional gas production, federal tax incentives and pollution reduction measures are making landfill gas a financially viable option. WM is eyeing a cool $250 million in tax credits by installing gasworks at 18 of its landfills, a move accelerated by the recent climate, tax, and healthcare legislation. This expansion is expected to ramp up gas production eightfold, potentially adding $500 million to WM’s profits by 2026, not even counting the tax perks. And while landfill-derived natural gas currently makes up less than 1% of the U.S. supply, the demand is climbing, with renewable natural gas projects on the rise.
When it comes to opportunities and risks, the biggest opportunity for Waste Management lies in its commitment to sustainability. With an increasing global focus on environmental responsibility, their investments in recycling, waste-to-energy technologies, and sustainable practices position them well for the future. However, they do face risks associated with regulatory changes, environmental concerns, and potential shifts in waste generation patterns.
But WM’s ambitions don’t stop at landfills. The company is also revolutionizing its recycling plants with hefty investments in AI technology. Take, for instance, their facility outside Cleveland, now capable of handling 12,000 tons of recycling monthly. This technological overhaul is not just about going green; it’s a calculated move to boost the bottom line by $240 million in the next four years. WM is deploying AI-powered optical sorters to enhance efficiency, reduce labor costs, and improve the quality of recovered materials. This is crucial as the demand for recycled materials skyrockets, with major corporations vying for sustainable packaging solutions. WM’s advanced sorting technology is set to increase the value of recyclables by 15% per ton, with a goal to recover 25% more reusable materials by 2025.
And let’s not overlook WM’s foray back into one of its core areas – collections – with the introduction of ‘smart trucks.’ These high-tech vehicles are equipped with cameras to monitor and optimize the recycling process, reducing contamination and improving efficiency. This technology is already making a significant impact, reducing waste residue by about 20% in regions where it’s deployed.
In summary, WM is redefining what we think of as trash. It’s no longer just waste; it’s a resource, a commodity in the burgeoning green economy. This strategic pivot by WM is not just an environmental statement; it’s a shrewd business maneuver, positioning the company at the forefront of the climate investment boom. For those in the world of finance and trading, WM’s story is a compelling example of how traditional industries can adapt, innovate, and thrive in the rapidly evolving green economy. $WM has a $74.3 billion market cap. In 2020 revenue was $15.22 billion. Today management has increased revenue to $20.14 billion with no signs of a slowdown on the horizon.
In this stock study we will look at the following metrics and indicators.
1) Wall Street Analysts’ Estimates
2) 52-week high and low boundaries
3) FB Finance Institute A.I. Triple Cross Forecast
4) The Best Case – Worst Case Scenarios
5) Neural Network Forecast
6) Daily Range Forecast
7) Seasonal Analysis
8) Intermarket Analysis
9) Our trading suggestion
We don’t base decisions on things like earnings or fundamental cash flow valuations. However, we do look at them to better understand the financial landscape that a company is operating under.
Wall Street Analysts’ Estimates
Based on 20 Wall Street analysts offering 12-month price targets for Waste Management in the last 3 months. The average price target is $184.20 with a high forecast of $215.00 and a low forecast of $163.00. The average price target represents a -.19% change from the last price of $184.91.
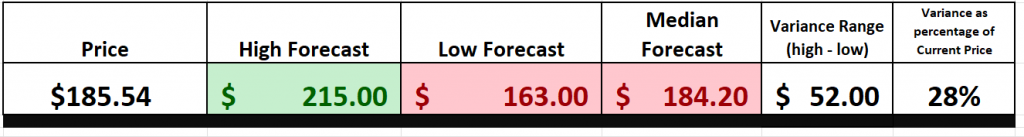
We typically like to look at the variance between the most bullish and bearish forecasts and use that as a gauge for future expected volatility. Currently this variance is 28% or $52.
We find this variance valuable as often rallies and declines are confined to this level of volatility.
52-Week High and Low Boundaries
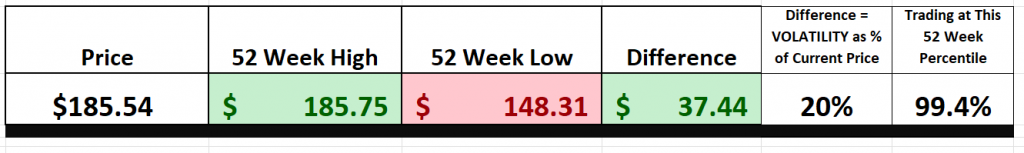
Over the past 52 weeks $WM has traded as high as $185.75 and as low as $148.31
The annual trading range was $37.44 . These numbers provide us with an accurate perspective of historic volatility which we can calculate by comparing the annual trading range to the current price Over the last 52 weeks the historic volatility was 20% which is moderate in comparison to the broader stock market indexes. This value tells us that based upon the recent past it would be perfectly normal to expect prices to trade 20% higher and or lower over the next 52 weeks.
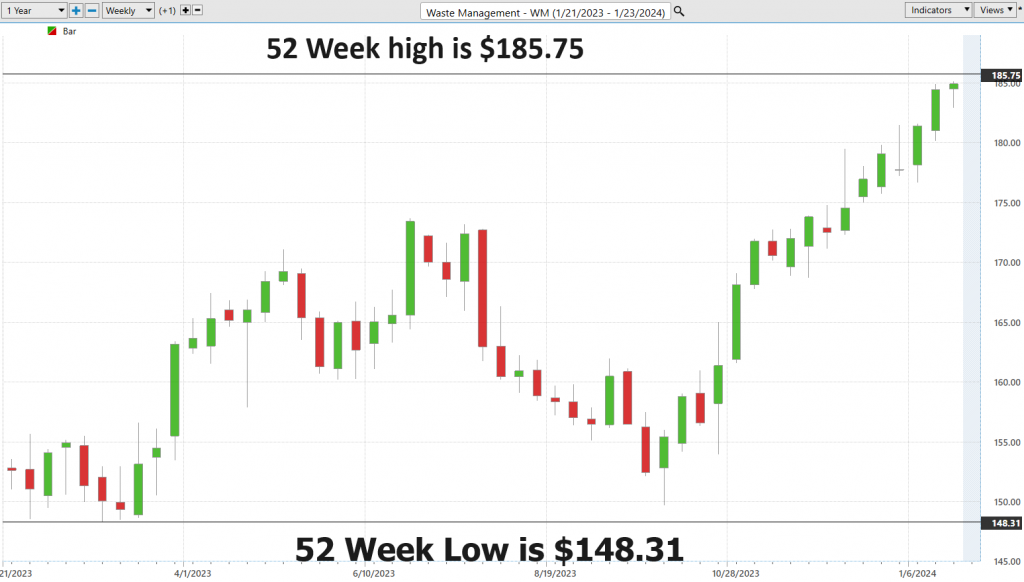
When you are diving into the world of stock analysis, you’ve got to start with the basics. One fundamental piece of the puzzle is looking at a stock’s 52-week high and low. Take a stock like $WM, for instance. These boundaries, they’re like a report card, a clear-cut measure of how well or poorly that stock has performed over the last year. It’s all about historical context, understanding the trends, and getting a feel for what’s been going on with that stock.
Now, let me tell you, those 52-week boundaries are more than just numbers. They’re a window into the stock’s momentum, its support and resistance levels. If that stock’s been making higher highs and higher lows, it’s a sign of bullishness. But if it’s doing the opposite, making lower highs and lower lows, that’s a bearish trend, my friends. And let’s not forget, those boundaries can also tell us what investors are feeling – are they optimistic near the 52-week high or nervous near the 52-week low.
And here’s the kicker, when you’re making decisions in the market, those 52-week highs and lows matter. If that stock breaks above that 52-week high, it’s a signal, it might be time to buy. But if it falls below that 52-week low, well, that’s a red flag waving right in your face. So, remember, folks, when you’re analyzing a stock, don’t skip over those 52-week boundaries – they’re the foundation upon which you build your investment strategy, and they can be your guide through the ups and downs of the market.
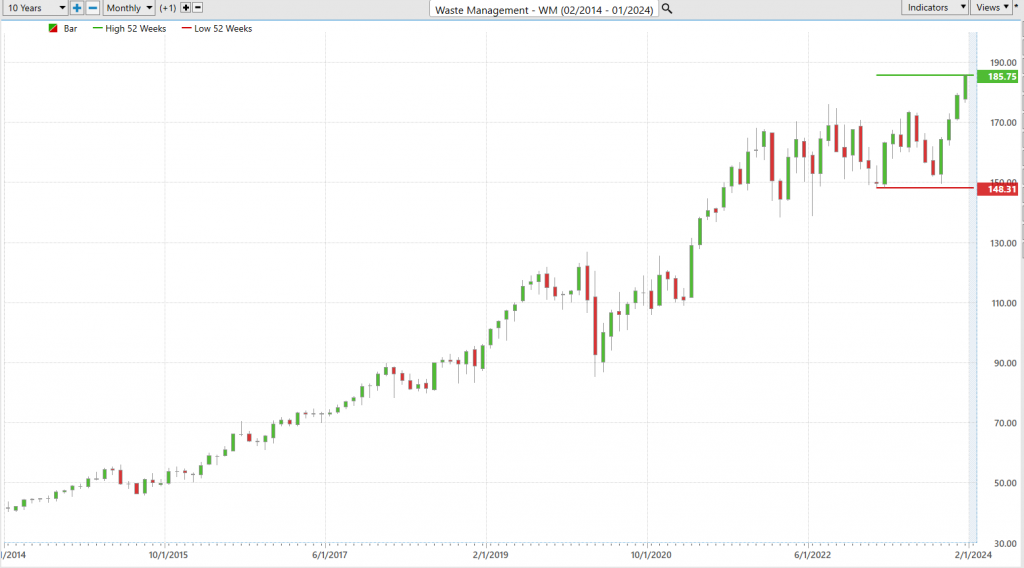
Next zoom out to the 10-year chart to get a better picture of the longer-term secular trend. These two actions are the foundation of a practical and useful analysis for any stock that you are looking to trade. $WM is clearly winning. Over the last 10 years $WM has been up 350%, which is more than double the return of the S&P 500, which is up 163% over the same time frame.
Best Case – Worst Case Scenario
Let’s talk about something every investor/trader should have in their toolkit – understanding the balance between risk and reward. Now, there are fancy techniques out there, but the one that speaks plain truth is what we call the best-case/worst-case analysis. It’s about assuming the best and worst scenarios and mapping them on the chart over the past year.
Picture this: we’re connecting the high points and low points of all the rallies and declines, just like measuring the waves in a stormy sea. That’s your secret sauce for deciphering risk and reward in real-world volatility.
So, here’s the bottom line, folks: you’ve got to assess those rallies against the downturns. Think of it as navigating that turbulent sea, giving you a clear view of what’s at stake – plain and simple, it’s risk and volatility.
But this isn’t just some fancy move; it’s a strategic philosophy. By analyzing both the highs and lows, you get the full picture of a stock’s potential. It’s not just about future gains; it’s about understanding the risks too. This is your guiding star through market fluctuations, unveiling the essence of asset dynamics.
So, don’t just glance at those charts; truly comprehend them. This isn’t just tactics; it’s a strategy that empowers you to make informed choices, manage your exposure, and create a resilient investment plan that balances risk and reward. And let me tell you, these charts I’m about to share? They’re your trusted companions when it comes to defining volatility.
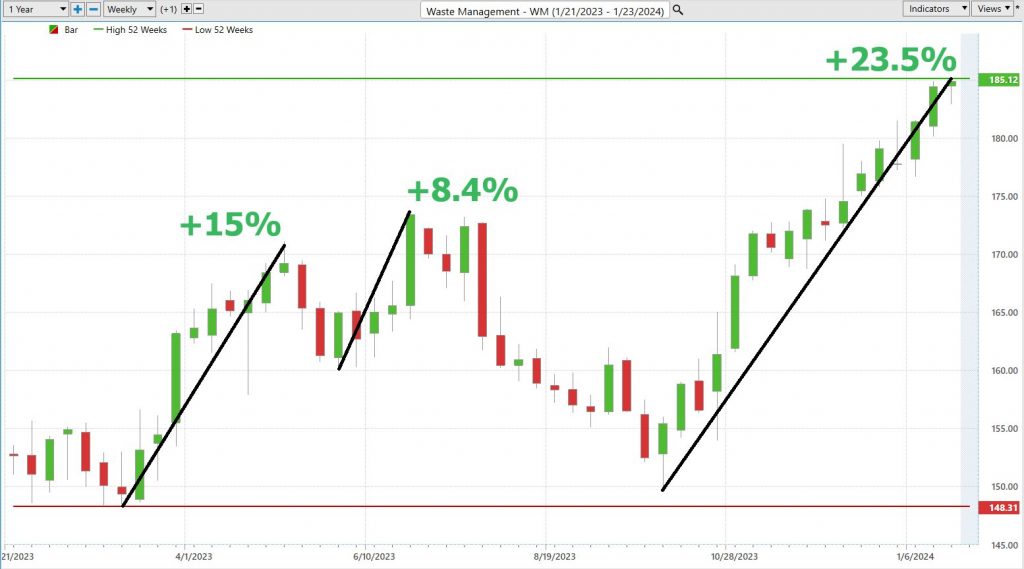
From this viewpoint, we can instantly grasp the reward and risk of the past year for $WM.
Here is the best-case analysis:
Followed by the worst-case analysis:
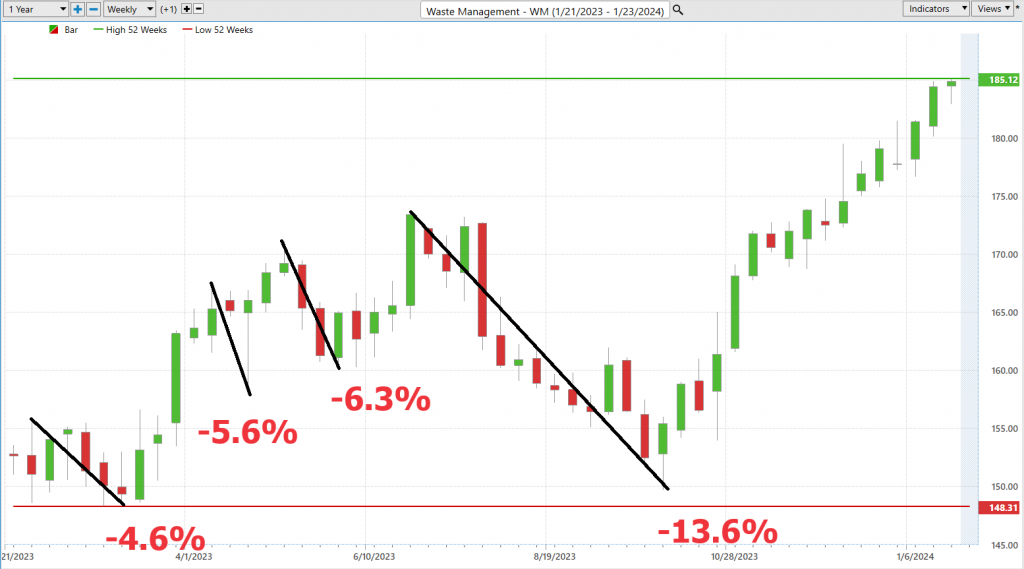
Viewed from this perspective we can immediately see the reward and risk of the past year for $WM.
Next, we need to compare $WM to the broader stock market indices. By doing so we can immediately see that $WM has massively outperformed the broader market.
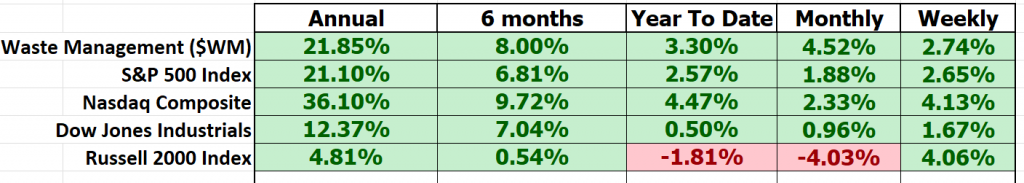
Clearly, $WM has performed comparably to the broader market.
Last but not least we need to compare the volatility of $WM to the broader market. This is done by looking at BETA. Beta is a measure of a stock’s volatility in relation to the overall market. A beta of 1 indicates the stock tends to move in line with the market, while a beta greater than 1 suggests higher volatility, and a beta less than 1 implies lower volatility compared to the market.
Waste Management ($WM), over the past 5 years, exhibits a beta of .71, indicating it is 29% less volatile than the broader market . So in $WM we have a stock which has performed comparably to the broader market with 29% less volatility and risk.
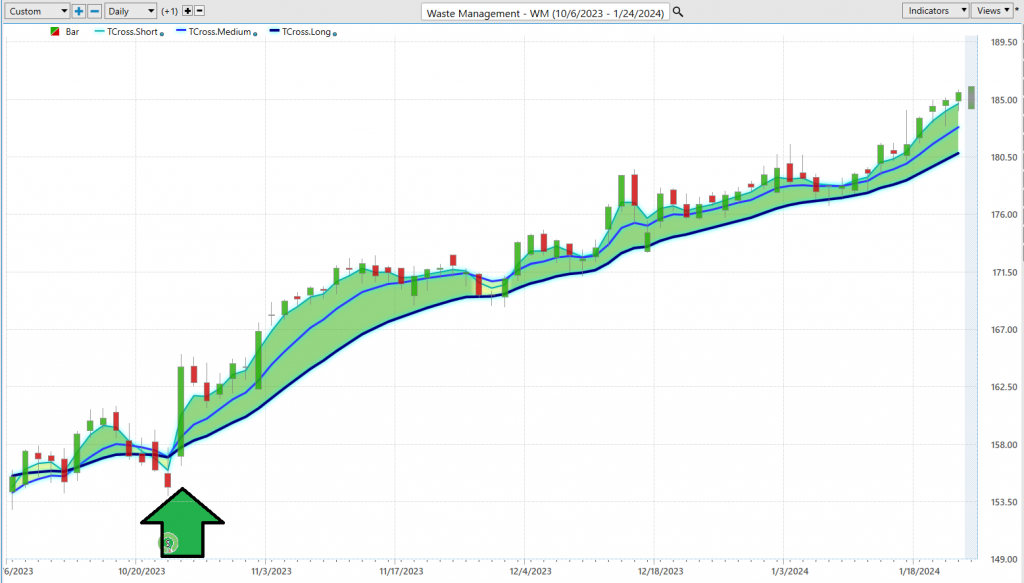
The FB Finance Institute A.I. Triple Cross Indicator
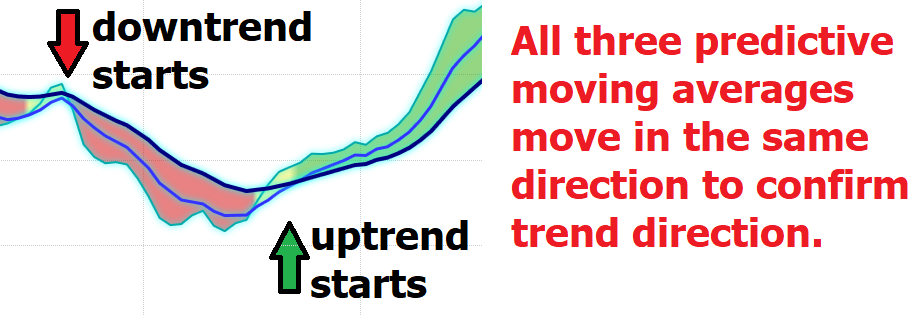
In the fast-paced world of financial markets, having an edge is crucial, and today, I’m thrilled to introduce a game-changing tool that’s redefining market analysis – the FB Finance Institute A.I. Triple Cross indicator. This isn’t your run-of-the-mill indicator; it’s a revolutionary approach that employs not two, but three predictive moving averages, each meticulously designed to capture the essence of short-term, medium-term, and long-term market trends.
Imagine this: a 3-day, an 8-day, and an 18-day predictive moving average, each serving as a beacon, guiding traders through the tumultuous volatility of the stock market. This triple threat, my friends, is where the magic happens. It’s a blend of precision and foresight, offering traders an unparalleled early warning system for trend changes.
But here’s where it gets even more exciting. The Triple Crossover is like a master strategist, patient and discerning. It waits, biding its time until all three averages align, reducing the noise and clutter of unnecessary trades. Think of the short-term average crossing the medium-term as a flare lighting up the sky, signaling a potential shift in the winds. And when the medium-term crosses the long-term? That’s our cue, the confirmation of a genuine trend, a moment we’ve all been waiting for.
The genius of this system lies in its predictive nature. It smartly navigates through the market’s volatility, shielding you from premature entries and those deceptive false signals.
To bring it all home, the Triple Crossover isn’t just an indicator; it’s your personal trading sentinel, vigilantly watching over your investments. It offers a heads-up, a nudge when a trend is about to change, confirmed not once, not twice, but thrice, ensuring that the trades you make are of the highest quality.
Now, let’s turn our attention to something fascinating – the Waste Management stock chart over the past several months. This is where theory meets practice, where we see the Triple Crossover in action.
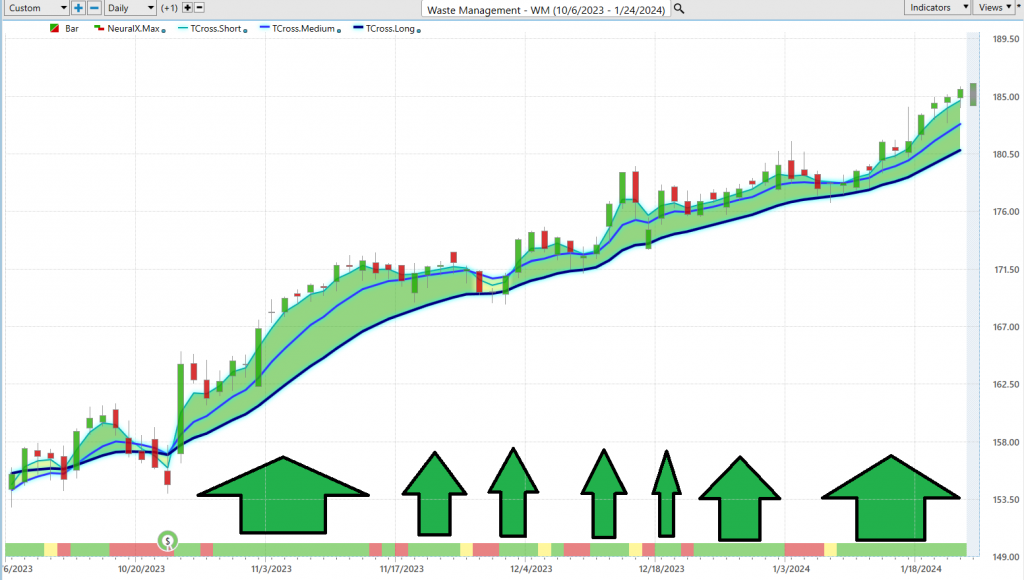
Neural Network Indicator (Machine Learning)
The Neural Network Indicator nestled at the chart’s base is a powerful predictive tool. This indicator acts as a harbinger of future market movements, signaling strength with a green hue and cautioning weakness with red. It’s akin to a weather forecast for market trends.
Our savvy Power Traders, those who are always a step ahead, don’t just rely on a single metric. They bring into play a strategic combination of the Neural Network Indicator with the Triple Cross indicator. This method isn’t about efficiency; it’s about precision in identifying those crucial entry and exit points in the market.
At its core, the Neural Network is a marvel of artificial intelligence, mirroring the complexities of the human brain. It’s not static; it’s a dynamic, self-evolving system, continuously processing a vast expanse of data to refine its output. This is where the worlds of advanced technology and finance converge, offering a nuanced understanding of market patterns and aiding in decision-making.
Imagine a web, each node an individual neuron, working in unison to dissect and interpret the incoming data. This intricate network scrutinizes, adapts, and learns, producing outputs that offer invaluable insights into market trends and potential trading strategies.
In the realm of trading, where days can mean the difference between profit and loss, neural networks are a godsend. They minimize human error, enhance decision-making precision, and keep traders a step ahead in the relentless pace of the market.
Let’s consider the case of Waste Management ($WM). With the integration of the FB Finance Institute A.I. Neural Index Indicator, Power Traders leverage this ‘double confirmation’ setup. They watch for the predictive blue line’s upward slope, seeking affirmation from the Neural Net Indicator. It’s a dance of data and prediction, where alignment of the Triple Cross and the Neural Net signals not just an opportunity, but a high-probability trading strategy.
The chart of Waste Management ($WM) is a testament to the power of these tools. The Neural Net Indicator, in tandem with the Triple Cross, has repeatedly offered Power Traders moments of ‘double confirmation,’ where the stars align for highly probable trading opportunities.
It’s in these instances, where technology meets probability, that traders can truly capitalize on market trends, turning data into decisive action.
So, why should you care about neural networks? Because they are the secret sauce for traders. They are all about numbers and probabilities, and they can spot patterns that we humans might overlook.
FB Finance Institute Software Daily Price Range Prediction
Let’s cut to the chase. In the world of high-stakes trading, timing isn’t just everything, it’s the only thing. And for those Power Traders out there, always on the prowl for that prime moment to strike, the Daily Range Forecast is like their secret weapon. Now, why is this such a big deal? It’s all about nailing those perfect entries and exits, especially for the traders who live in the fast lane, always scouting for quick, sharp opportunities.
Take a gander at Waste Management’s stock ($WM), for instance. Look at those average trading ranges on a daily, weekly, and monthly basis. It’s like a barometer of volatility. But here’s the catch – knowing the ranges isn’t enough. The real question is, where are those sweet spots for getting in and getting out?
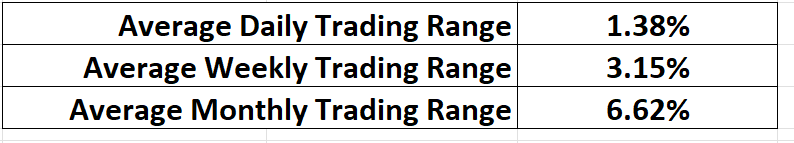
Now, focus your sights on the Daily Range Forecast chart. This isn’t just any chart. It’s like a roadmap for short-term swing traders, laying out what they can expect every trading day.
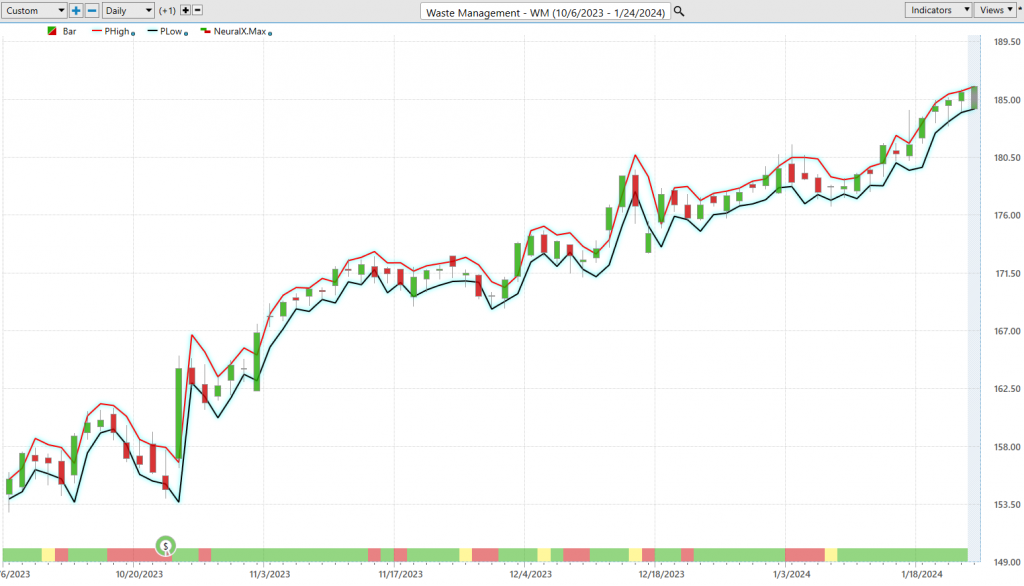
In this lightning-fast trading world, being precise is not just a virtue, it’s a necessity. And that’s exactly where FB Finance Institute A.I.’s Daily Range Forecast comes into play. We’re talking about a tool armed with artificial intelligence, machine learning, and neural networks. It’s not just crunching numbers; it’s predicting the market’s pulse for each trading session. Think of it as your personal GPS in the world of trading, guiding Power Traders to expertly surf those market waves, pinpoint those entry points, and time their exits with the precision of a Swiss watch.
Remember, in trading, being ahead of the curve isn’t simply good; it’s essential.
Intermarket Analysis
Intermarket analysis is a method of understanding and analyzing financial markets by examining the relationships between different asset classes. This approach is based on the principle that all markets are interconnected and that movements in one market can have direct or indirect effects on others. For new traders, it’s crucial to grasp that intermarket analysis looks beyond the scope of a single market or asset. It involves studying a range of markets, including stocks, bonds, commodities, and currencies, to identify broader trends or warning signals. This analysis can reveal how the performance of one market can influence another. For instance, a significant change in the bond market can affect stock market trends, or a fluctuation in currency values might impact commodity prices.
For those new to trading, integrating intermarket analysis into your strategy involves understanding these relationships and how they may impact your investment decisions. It’s not just about focusing on individual stock performance or a single market indicator. Instead, it’s about seeing the bigger picture and recognizing patterns and correlations between different markets. For example, a rise in interest rates might lead to a stronger currency but weaker stock prices, as borrowing costs increase. Similarly, rising commodity prices, like oil, can indicate inflationary pressures, which might lead to changes in monetary policy that affect various markets. By incorporating this type of analysis, traders can make more informed decisions, potentially identify opportunities early, and manage risks better by understanding the broader economic and financial landscape.
In today’s world, everything is linked. To be successful, traders need to figure out what’s driving prices, even if it is not obvious. And that’s where Intermarket analysis comes in handy.
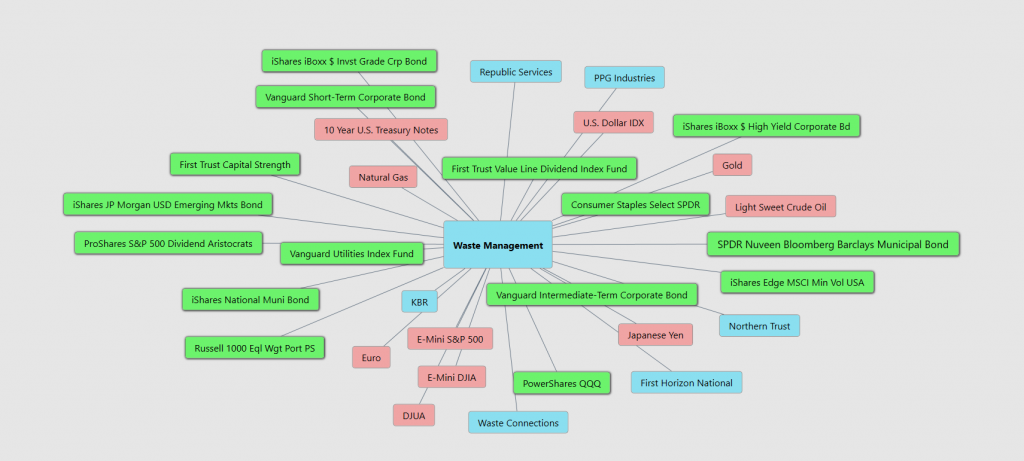
So, when you’re looking at a stock like $WM, dive into the intermarket analysis, and you might uncover some hidden clues for your trading journey. It is like being a detective in the financial world!
Seasonal Analysis
Seasonal analysis in trading refers to the identification and use of predictable patterns in financial markets that recur at certain times of the year. This concept is based on the observation that market movements often correlate with seasonal activities, calendar periods, or specific events. For new traders, understanding seasonal analysis means recognizing that these patterns can provide valuable insights for timing investment and trading decisions.
The formation of these seasonal patterns can be influenced by various factors, including specific times of the year like seasons, months, or weeks, anticipated occurrences such as corporate reporting periods, major economic news, weather conditions, and human behaviors that follow a seasonal rhythm. For example, certain stock markets might show recurring trends during specific months due to investor behavior or economic cycles.
To trade using seasonal patterns, traders first identify these recurring trends in an asset’s price through historical data analysis. This can involve evaluating the average profit or loss for a specific period or assessing the net positive or negative performance during that period. Once a pattern is identified, traders can create strategies to capitalize on these predictable movements, such as buying an asset before an expected upward trend and selling it before a trend typically reverses. It’s crucial to remember, though, that these patterns provide probabilities, not certainties, and should be used alongside other technical analysis tools.
However, while seasonal trading can be a valuable strategy, it comes with limitations, such as being effective only during certain times or being based on historical data that might not reflect current market conditions. It’s also important to consider the potential for overcrowded trades, where popular strategies might reduce profitability as more traders participate.
The AI Financial Genie 4.0 seasonal analysis chart below shows that from mid October through December the seasonal trend was very highly correlated to the price action of $WM.
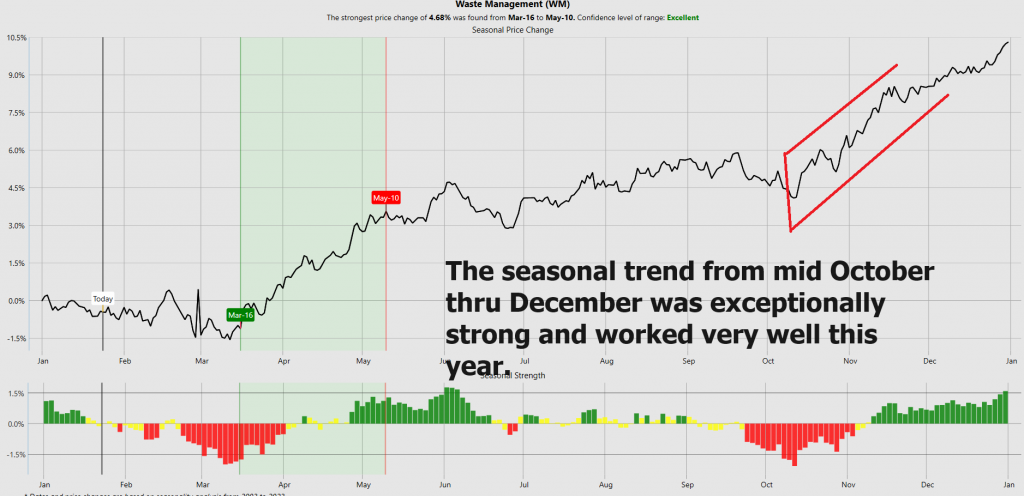
Seasonal analysis should always be cross referenced with other indicatpors for better effectiveness. This approach can enhance your understanding of the market and contribute to better-informed investment decisions.
Our Suggestion
The next earnings call for $WM will occur on February 13, 2023.
Analysts on Wall Street are very excited about $WM because it is turning methane gas into a substantial profit center. By the end of 2024 expectations that its operations of 259 landfill sites accompanied by huge government tax credits will allows it to convert methan into renewable natural gas with an annual free cash flow of $450 million.
$WM management also recently increased its dividend of 1.52% for the 21 st consecutive year.
$WM is fairly valued according to Wall Street analysts. We think that buying on pullbacks as long as the ai forecast is bullish will provide ample opportunity for profit in 2024.
Our favorite trading setup is finding stocks that are trading at 52 week highs and 10 year highs and then turning over the navigation to the artificial intelligence. $WM fits this framework. We will continue to rely upon the FB Finance Institute A.I. daily range forecast for guidance.
What we also think is very supportive for $WM is that to some extend the stock has shown the ability to be more resistant to recessions than the rest of the broader market. Customers always neexd to have their garbage picked up. $WM deserves to be on your trading radar. Use the daily range forecast for the relevant positioning opportunities.
We advise that you practice good money management on all of your trades and that you follow the A.I. forecast for your trend anaysis to determine optimal entries and exits.
Let’s Be Careful Out There!
Remember, It’s Not Magic.
It’s Machine Learning.
Disclaimer: THERE IS A HIGH DEGREE OF RISK INVOLVED IN TRADING. IT IS NOT PRUDENT OR ADVISABLE TO MAKE TRADING DECISIONS THAT ARE BEYOND YOUR FINANCIAL MEANS OR INVOLVE TRADING CAPITAL THAT YOU ARE NOT WILLING AND CAPABLE OF LOSING.
FB Finance Institute’S MARKETING CAMPAIGNS, OF ANY KIND, DO NOT CONSTITUTE TRADING ADVICE OR AN ENDORSEMENT OR RECOMMENDATION BY AI Financial Genie 4.0 OR ANY ASSOCIATED AFFILIATES OF ANY TRADING METHODS, PROGRAMS, SYSTEMS OR ROUTINES. FB Finance Institute’S PERSONNEL ARE NOT LICENSED BROKERS OR ADVISORS AND DO NOT OFFER TRADING ADVICE.