| This week’s a.i. Stock Spotlight is Costco ($COST) |

Welcome to a deep dive into the world of retail, where we shine a spotlight on a company that’s rewriting the rules – Costco. They’ve charted a unique path in retail that’s as effective as it is distinctive.
Let’s get down to the performance that’ll make you sit up and take notice. Costco’s financial setup is something to marvel at. Their membership fees aren’t just a side gig; they’re a significant revenue driver, nearly matching their net income. This sets them apart from Target and Walmart, who rely on a different playbook.
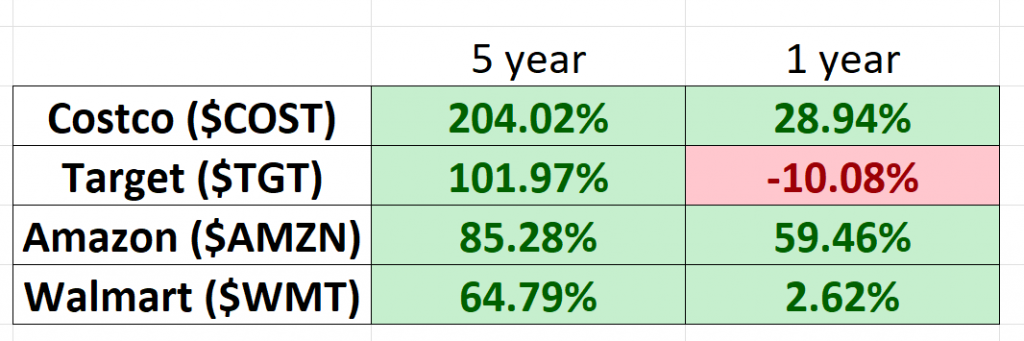
Retailer Comparative Stock Performance:
So, what’s Costco’s secret sauce? It’s brilliantly simple. They don’t need sky-high in-store profits because their cash cow is those membership fees. This allows them to offer products at unbeatable prices, drawing more customers into the Costco fold. It’s a cycle of success that keeps on giving.
Now, let’s dissect these figures. Over the years, Costco’s free cash flow and membership fee revenue have played out like a financial thriller. There were times when membership fees surpassed their free cash flow. Quite the twist, right? But in recent years, a shift has occurred, with free cash flow and net income taking the lead, thanks to a surge in membership fees.
So, what does this mean for the rest of Costco’s business? Well, it means they don’t need to make substantial profits from their stores, allowing them to keep prices low. In fact, they’re known for selling items in bulk, offering even lower unit prices. This attracts more customers, willing to pay for that coveted membership, and in turn, generates more revenue and margin for each store. This virtuous cycle allows Costco to continually lower prices and maintain a thriving business model.
Now, let’s talk margins. Costco’s margins hover around 12 to 13.5%, while Target and Walmart are in the 25-30% range. But here’s the kicker – those high in-store margins aren’t Costco’s bread and butter. Membership fees are the real MVPs of their profit game.
Founded in 1983 by James Sinegal and Jeffrey Brotman, Costco has expanded from a single warehouse to a global powerhouse with over 800 locations in the United States. Their membership-based model isn’t just a revenue stream; it’s a loyalty magnet.
But the retail waters are choppy. Costco faces fierce competition from Walmart’s Sam’s Club and BJ’s Wholesale Club. However, Costco’s ‘Treasure Hunt’ experience, with its ever-changing product lineup, keeps customers engaged.
Let’s talk size. Costco’s average warehouse spans a massive 145,000 square feet. They’re not just about selling; they’re committed to sustainability and eco-friendly practices.
And here’s what truly sets Costco apart – they treat their employees well, leading to a satisfied and loyal workforce. Their Kirkland Signature brand reflects their commitment to quality and value and is a major profit center for the business.
But Costco isn’t resting on its laurels. They’re in constant evolution mode, with strategic acquisitions like Innovel Solutions and a growing e-commerce presence. Their global expansion is a tale of triumph, from their first store in France to their rapid growth in China.
Financially, Costco is a juggernaut. When the bell rings to close the market on December 14th, keep your eyes peeled for Costco’s first-quarter fiscal 2024 results. Now, the buzz is that we’re likely to see a pretty impressive jump in their top line. The number crunchers have their bets placed on revenues hitting about $57.62 billion. That’s a solid 5.8% leap from what they reported last year.
But here’s where it gets even more intriguing. The bottom line for this Issaquah, Washington-headquartered giant isn’t just inching up; it’s expected to show a significant year-over-year improvement. We’ve seen the consensus estimate for their first-quarter earnings per share nudge up a penny to $3.44 in the last 30 days. Do the math, and that spells out an 11% increase from the same period a year ago.
So, what’s cooking at Costco? It’s a mix of smart growth strategies, sharper price management, and let’s not forget, those ever-important membership trends. They’ve been playing it smart, selling products at prices that don’t just attract customers – they keep them coming back for the value and convenience. And here’s the kicker – with supply-chain costs getting trimmed and private-label brands gaining ground, Costco’s strategy seems to be paying off in spades. We’re talking about a potential positive impact on the overall results. Stay tuned, because this could be a story of a retail giant showing us how it’s done.
And to top it all off, Ron Vachris, who has been the company’s President and Chief Operating Officer will be stepping in as the new CEO on January 1, 2024. So, the exciting retailer plot thickens.
Since 2018, Costco’s shares have surged an impressive 204%, outperforming giants like Amazon, Walmart, and Target. Their international expansion promises even more growth potential.
But the million-dollar question – is Costco’s stock a buy? With a P/E multiple of 38.5 and a forward P/E of 34.5, it’s not exactly a bargain. However, their historical net income growth rate of 13.2% and free cash flow growth of 14.5% over the past decade are figures you can’t ignore.
When stacked against Target and Walmart, Costco’s unique business model shines. While the stock may not come cheap, its distinct approach to retail makes it a compelling choice. Whether it’s a buy at the current price depends on your investment goals and risk tolerance.
From a pure technical trading standpoint, it has been on our radar because it is simultaneously breaching its 10 year and 52-week highs. Long time readers of our analysis know that this is probably our favorite trading setup. Whenever an asset is making a new 10 year and 52-week highs simultaneously we place it firmly on our radar and look for trading opportunities.
In conclusion, Costco is a retail titan with a strategy as expensive as its warehouses and a future as brilliant as its prospects. For investors and traders, this isn’t just a stock; it’s a journey into a sea of potential. Stay tuned because with Costco, the best is yet to come.
In this weekly stock study, we will look at an analysis of the following indicators and metrics which are our guidelines which dictate our behavior in deciding whether to buy, sell or stand aside on a particular stock.
- Analysts Ratings
- 52 week high and low boundaries
- FB Finance Institute A.I. Forecast (Predictive Blue Line)
- Neural Network Forecast (Machine Learning)
- Seasonal Analysis
- Daily Range Forecast
- Intermarket Analysis
- Our trading suggestion
While we make all our decisions based upon the artificial intelligence forecasts, we do look at the fundamentals briefly, just to understand the financial landscape that COSTCO is operating in.
Wall Street Analysts Forecasts
A consensus emerges from the assessments of 31 seasoned Wall Street analysts regarding the 12-month price outlook for retail giant Costco Wholesale Corp. Their collective wisdom reveals a median target of $620.00, encompassing a spectrum from a bullish high estimate of $697.00 to a more conservative low estimate of $502.00 . Notably, this median projection implies a modest -1.52% decline when juxtaposed against Costco’s recent trading price of $629.54.
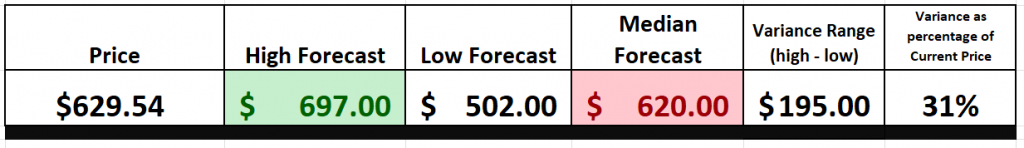
We like to place our attention on the divergence between the most optimistic and negative forecasts which we think of as opinion volatility. Currently this difference is $195 and represents 31% of the current price.
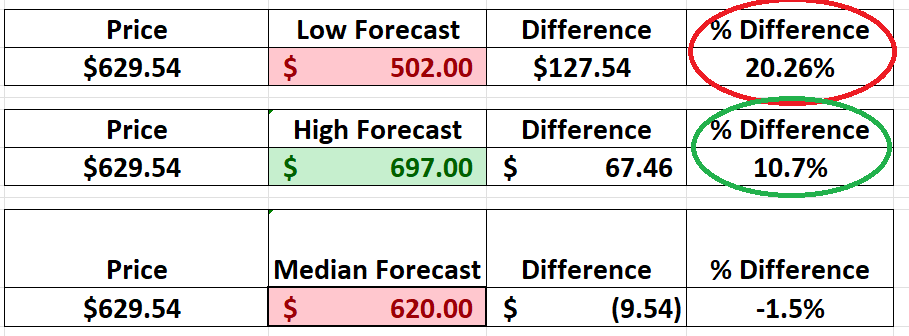
More importantly when we dig into the Wall Street Analysts forecasts, we can see a slightly lopsided risk reward scenario as well.
Should the market drop to $502 that would represent a 20.26% loss. We compare that to what would occur if the market were to rally to the high forecast of $697, which would represent a 10.7% gain.
We always take Wall Street Analysts forecasts with a grain of salt, but it is worth paying attention to the fact that they see greater risk than reward at the current price level. Since we are traders, it means if we are to strike, we must be fast and nimble based upon this perspective of volatility that analysts are making.
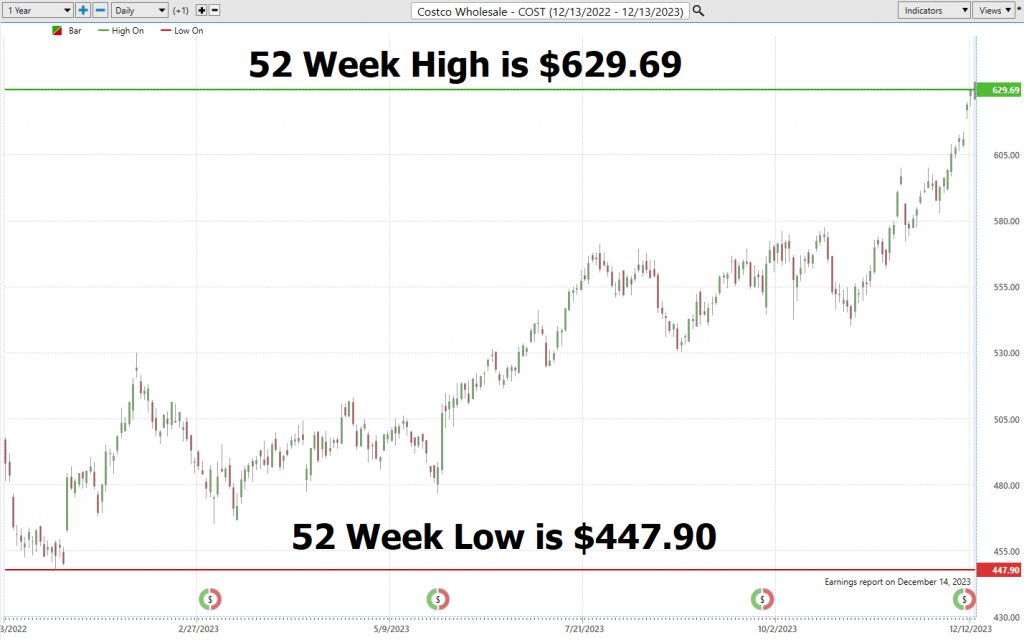
52 Week High and Low Boundaries
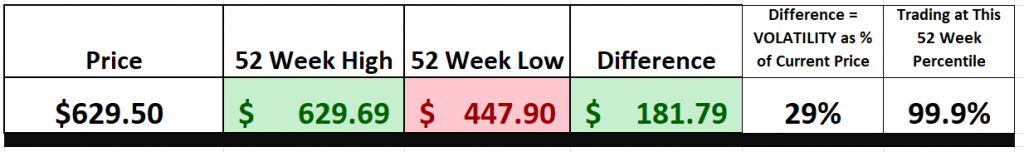
Let’s start our analysis with the commonsense metrics. Over the last 52 weeks $COST has traded as high as $629.69 and as low as $447.90. This tells us that the annual trading range is $181.79. When we divide this trading range by the current price it tells us that the statistical volatility over the past year has been 29%. That means that it would be perfectly normal to expect $COST to trade in a range that is 29% higher or lower from where we are currently trading.
When we look at a stock, like the mighty $COST, not just grazing but firmly planting its hooves above those previous 52-week peaks, it’s like the bull saying, ‘Move over, bears; this rodeo’s mine now!’ It’s the starting pistol for a fresh, skyward saga, a whole new chapter for this stock.
When a stock keeps tagging those new 52-week summits, you can bet your boots there’s an army of traders pouring in, pumping up that trading volume. It’s not a blip on the radar; it’s a blazing signal, like a trumpet call summoning traders far and wide to join the party, to ride this rocket to the stars.
Those new highs aren’t just numbers; they’re like trophies on a shelf, goals for the taking. With every fresh peak, we’re not just inching forward; we’re rocketing ahead, setting higher bars, fueling the flames of that bullish charge. In the world of trading, perception often becomes reality, and consistently conquering those 52-week peaks puts a stock like $COST in a league of its own, a guiding star in the sky of bullish sentiment.
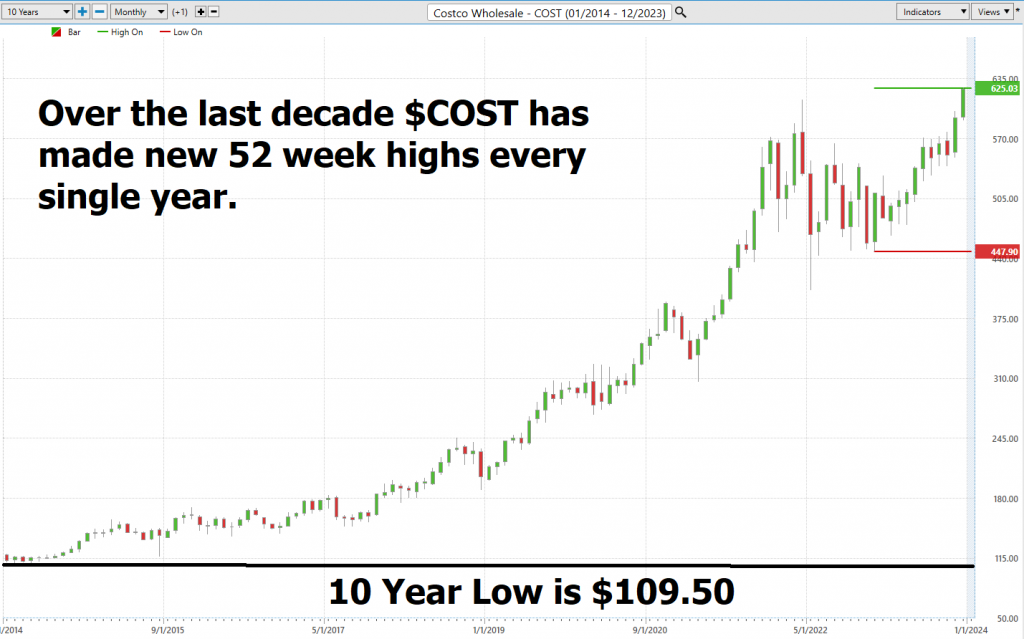
Let’s step back and take a gander at the big picture, a good old long-term chart to really get a grip on the path this stock has been treading. I mean, if you cast your eyes over the last decade, you’ll witness $COST has made new 52-week highs every single year. That is the true sign of a high-quality performance.
Best Case – Worst Case Scenario
If you want to decode the market’s mysteries, look no further than a price chart. It’s akin to a thrilling rollercoaster ride through the heart of Wall Street, displaying every exhilarating twist and turn in exquisite detail.
Now, let’s break it down for you. When the market is on a tear, that chart is going to soar like a majestic eagle, showcasing a graceful ascent in prices. It’s the embodiment of optimism, with investors flocking in, wagering big on future riches. But, even in the midst of these soaring rallies, you’ll encounter those occasional dips and corrections, and that’s where the seasoned pros maintain their composure.
But let’s flip the script for a moment. When the markets take a nosedive, that chart plummets like a stone cast into the abyss. It’s fear, its uncertainty, and its investors hitting the panic button, bracing for the storm. Yet, even in the darkest of hours, you’ll catch fleeting moments of hope, those little rallies that remind us of resilience.
Now, here’s the real trick: compare the magnitude of those rallies to the downturns. It’s like gauging the waves in a tempestuous sea. This is where you get a taste of reality, where you witness how swiftly market sentiment can shift.
So, let’s delve into why this approach is not just valuable but downright indispensable. By scrutinizing both the sunny, clear-skied scenarios and the turbulent, storm-laden ones, you’re essentially equipping yourself with a panoramic view of a stock’s potential. It’s not solely about painting rosy pictures or projecting future gains; it’s equally about comprehending and bracing for potential risks and downturns. This dual perspective is the compass guiding you through the often-choppy waters of thestock market, revealing the true essence of asset volatility.
This method isn’t just a tactical maneuver; it’s a strategic way of thinking. It empowers you to measure and manage your exposure, to make informed decisions about when to stay the course and when to chart a new course. It’s a deep dive into a stock’s intrinsic value, transcending surface-level allure. In the grander scheme of things, this approach goes beyond being a mere technique. It’s a philosophy, a foundational principle in the world of trading. It’s about striking a balance between the scales of risk and reward,ensuring that your portfolio isn’t just a collection of speculative bets but a meticulously crafted strategy for long-term financial resilience. The ultimate aim? To juxtapose a stock’s potential peaks against its valleys, not merely to weather market fluctuations but to master them.
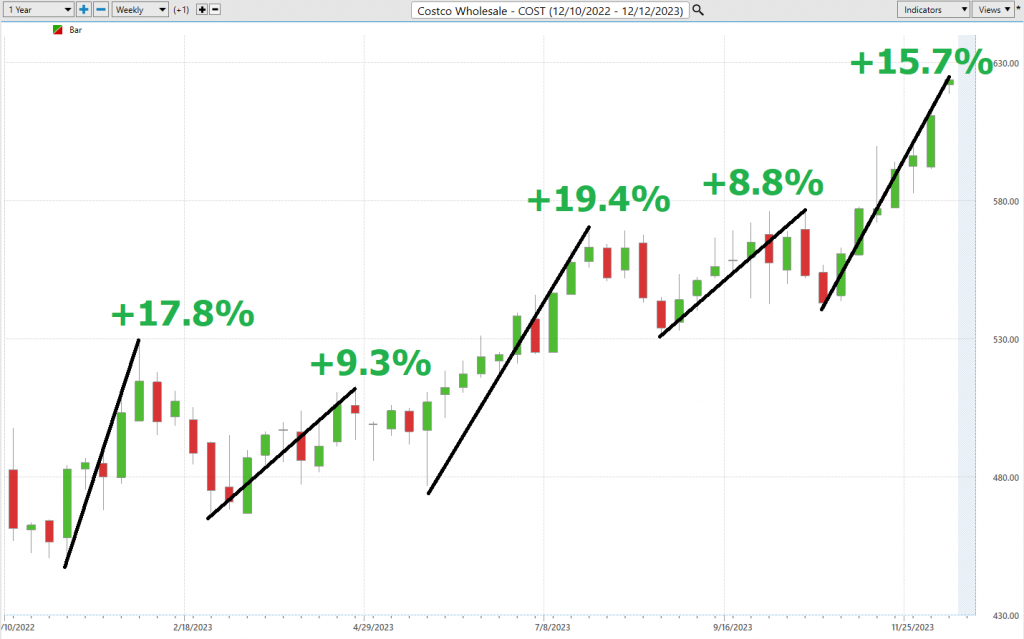
First, we start with the best-case analysis:
Next, we look at the worst-case analysis:
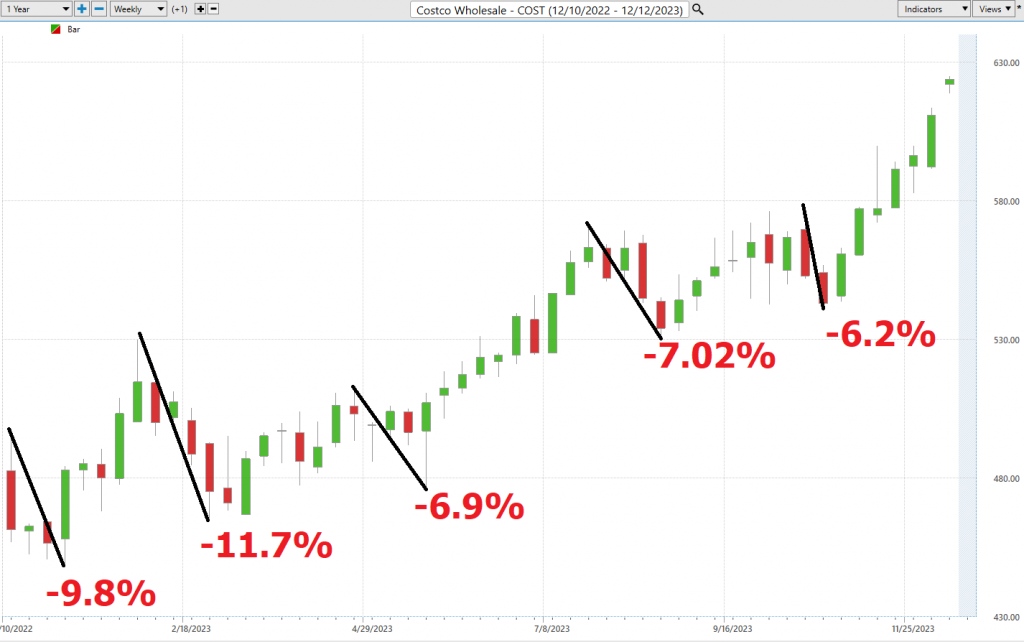
From this very simple and practical analysis you can see quickly determine the level of risk associated with buying and holding $COST over the past year.
Next, we want to compare the performance of $COST to the broader stock market indexes.
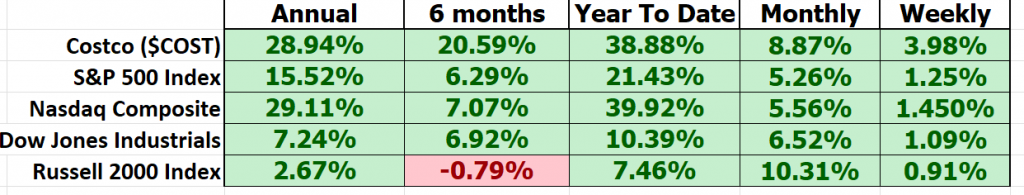
$COST’s performance has been nothing short of stellar.
But now, let’s dive deep into the heart of $COST and compare its performance and volatility to the big players in the market. We’re entering the territory of what traders like to call “BETA.” You see, beta (β) is like the Richter scale of the stock world. It’s the yardstick that tells us just how much a stock shakes and rattles compared to the broader market, typically something like the S&P 500. In simpler terms, beta is our way of understanding how sensitive a stock is to the market’s ups and downs.
Now, let’s unravel the intricacies of beta, a critical measure for understanding a stock’s relationship with the broader market. Here’s the breakdown:
– When we talk about a beta of 1, that means the stock’s price movements closely mirror those of the overall market. It’s like synchronized dancing – if the market takes a 5% leap, a stock with a beta of 1 should waltz along with a 5% rise.
– Now, picture a beta greater than 1 as the stock market’s wild rollercoaster. A beta exceeding 1, say 1.5, indicates that the stock is 50% more volatile than the market itself. When the market enjoys a 5% climb, this stock might embark on a heart-pounding 7.5% ascent (or tumble with equal fervor).
– But hold on because here’s where the steadiness comes into play. A beta below 1, like 0.5, suggests that the stock is only half as volatile as the market. In a 5% market uptick, this stock might experience a more measured 2.5% rise.
Now, let’s apply this wisdom to $COST. Here’s the scoop: $COST boasts a beta of .99, and we’re scrutinizing data over a 5-year horizon.
So essentially a trader looking at $COST according to a BETA analysis is mirroring the price action of the broader market. What makes this so compelling in this instance is that $COST has massively outperformed the broader market!
However, it’s crucial to remember that beta is firmly rooted in the past, and what’s happened before doesn’t necessarily predict the future. High beta doesn’t guarantee high returns, my friends. Instead, it’s an indicator of the stock’s appetite for ups and downs, signaling an elevated level of risk.
Investors turn to beta to gauge just how risky a stock is compared to the broader market. Think of it as a risk-o-meter, helping investors build portfolios that align with their risk tolerance and investment goals.
FB Finance Institute A.I. Predictive Blue Line Forecast
On the following chart, you will see the power of the FB Finance Institute Predictive blue line which determines the medium-term trend price forecast.
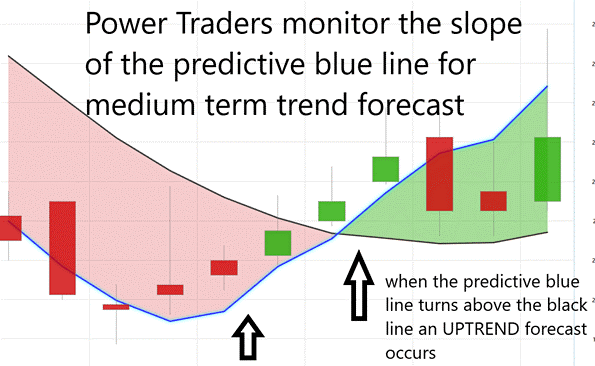
The FB Finance Institute Predictive blue line is the first metric that Power Traders use to define trend direction and potential entries and exits.
On the following chart you will see the power of the FB Finance Institute Predictive blue line which determines the medium term trend price forecast for COST.
- The slope of the predictive blue line determines the very short-term trend. On the graphic above, monitor that you would want to buy when the slope of the blue line is going up.
- When the slope of the blue line is going sideways you would be anticipating sideways prices.
- Likewise, when the slope of the blue line is going down you would be anticipating lower prices.
This blue line, folks, it’s powered by the innovative technology of FB Finance Institute’s Neural Network and Intermarket Analysis. We’re talking artificial intelligence, machine learning, and statistical analysis all rolled into one. It’s like having your own trading ninja in your portfolios corner.
Now, let’s get to the golden rule, shall we? And remember, this rule holds true whether you’re a quick trader or in it for the long haul. The name of the game is simple: stay in sync with the prevailing trend at just the right moment. And that’s where our trusty predictive blue line comes into play, lighting up our path to success.
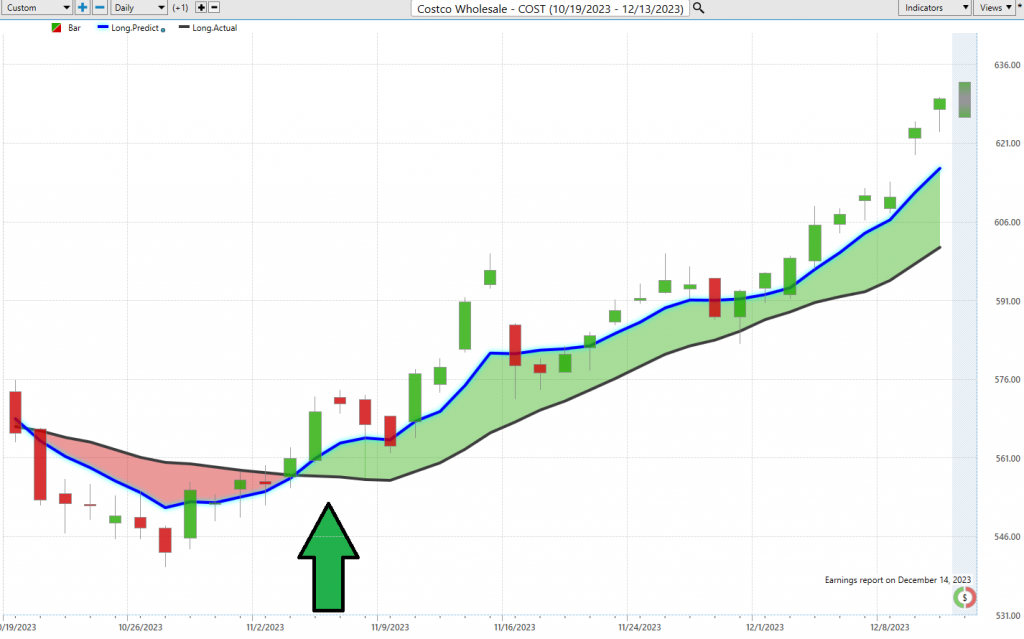
But, when you see two consecutive closes above that blue line, it’s like the market’s giving you a wink, saying an uptrend might be on the horizon. On the other hand, if you spot two consecutive closes below that blue line, it’s like a warning siren, signaling a potential downtrend. It’s a down-to-earth, logical way to unravel the mysteries of market trends and shape your investment and trading strategies accordingly. It’s all about being on the right side of the right trend at the right time, just as simple as that.
In the exhilarating world of trading, FB Finance Institute’s predictive blue line isn’t just some fancy gadget; it’s your turbocharged compass navigating you through the thrilling world of market trends!
FB Finance Institute A.I. Neural Index Indicator (Machine Learning)
Let me paint you a picture of the Neural Index. It’s like having a high-tech crystal ball right there at the base of your trading chart, serving as your very own market trend forecaster.
Now, when that indicator flashes a brilliant shade of green, it’s like a sunny day in the market, signaling strength and opportunity on the horizon. But when it switches to a fiery red, well, it’s akin to a storm cloud gathering, warning of potential short-term market turbulence. And if it’s a cool, calm shade of yellow, consider it a market weather report gently whispering, “Expect some sideways action.”
But what’s the magic behind this indicator, you ask? Well, a Neural Network is like having a genius artificial brain right in your trading toolkit. It devours vast amounts of data, crunches it through its virtual gears, and spits out insightful predictions. The Neural Index trading algorithms are always learning and refining themselves which is what makes them so valuable for confirming a trend.
Powered by cutting-edge A.I. technology, these Neural Networks dive deep into market data, from the nitty-gritty technical details to global events and corporate forecasts. And here’s the kicker – they’re lightning-fast. They can spot connections and correlations between different market factors and outcomes at a speed that puts us mere mortals to shame. For example, they might uncover a link between oil price shifts and unexpected movements in a specific regional stock index. These insights can give traders a significant edge.
Now, here’s the secret sauce for success – it’s all about confirmation. Seasoned Power Traders know that it’s smart to cross-check both the predictive blue line and the Neural Network Indicator. When these two signals align in the same direction, it’s like a green light for trading. And if they both turn red, well, it’s time to seriously consider hitting that sell button.
These Neural Networks are like trading superheroes, the next-gen supercomputers of our time. They unveil hidden patterns and connections that traditional technical analysis methods can only dream of. That’s why Power Traders are always on the lookout for these high-probability forecasts, rooted in historical insights.
Briefly, being a Power Trader means having your eyes on both the Neural Network and the A.I. forecast. It’s like having a dynamic duo guiding your trading decisions. When they both shine green, that’s your buy signal. And when they both flash red, it’s a clear sell signal. So, remember, in the world of Power Traders , double confirmation is the name of the game!
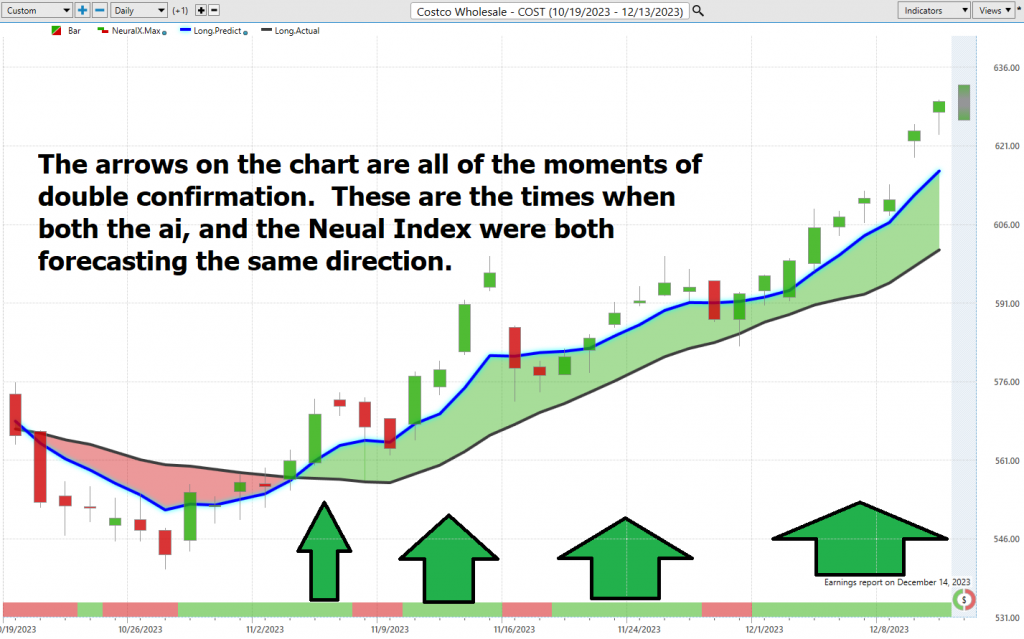
And speaking of double confirmation, Power Traders look for that sweet spot where both the predictive blue line and the Neural Network are pointing in the same direction to confirm the trend. It’s all about optimal entry and exit points.
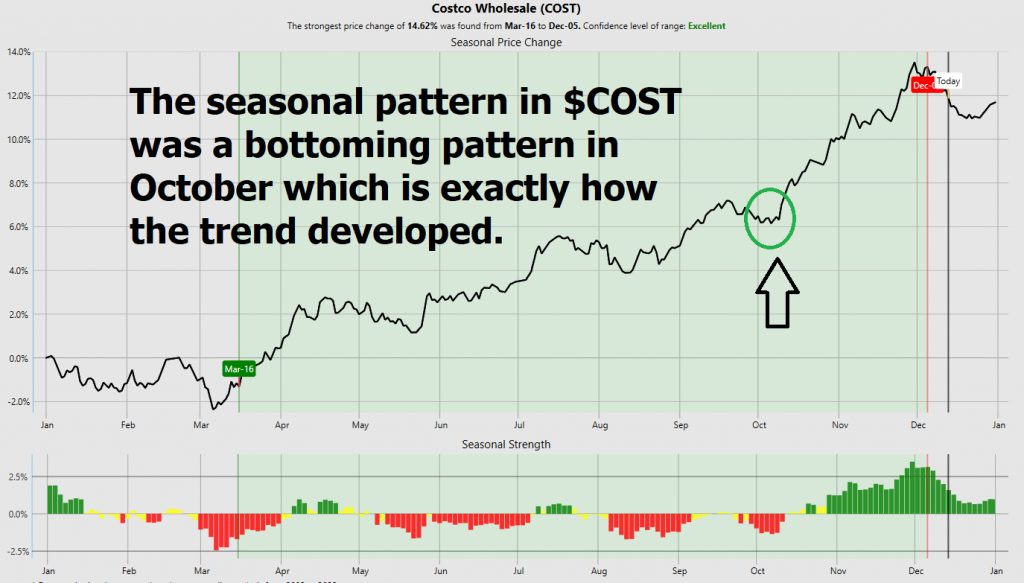
FB Finance Institute A.I. Seasonal Analysis
Seasonal analysis in trading is a technique that involves studying historical price patterns and behaviors of assets to identify recurring trends or patterns that tend to repeat during specific times of the year. It’s often applied to various financial instruments, including stocks, commodities, and currencies. Traders utilize seasonal analysis to gain insights into potential future price movements based on historical seasonality trends.
To conduct seasonal analysis, traders collect and analyze historical data over multiple years or decades. They then identify specific time frames, such as months, quarters, or seasons, where consistent patterns emerge. For example, in the commodities market, there may be a tendency for agricultural products like corn or soybeans to exhibit price increases during planting or harvesting seasons.
Seasonal analysis can be beneficial for traders for several reasons. Primarily, it provides traders with an additional tool for making informed decisions. By recognizing historical price patterns, traders can anticipate when certain assets are likely to experience price increases or decreases, allowing them to time their trades more effectively. This can be particularly advantageous in markets where seasonal factors play a significant role, such as agriculture, where weather and crop cycles influence prices.
Moreover, seasonal analysis can help traders diversify their trading strategies. By incorporating seasonal trends into their decision-making process, traders can complement other forms of technical and fundamental analysis. This diversification can reduce risk and enhance the overall effectiveness of their trading strategies.
It’s worth noting that seasonal analysis shares similarities with cyclical analysis in trading. Both approaches involve identifying repetitive patterns in price movements. However, there is a distinction between the two. Seasonal analysis focuses on shorter-term, calendar-based patterns that recur annually or periodically, often driven by external factors like weather, holidays, or events specific to certain industries. In contrast, cyclical analysis deals with longer-term market cycles, which can span several years and encompass broader economic and market factors like business cycles, interest rates, and inflation. Both types of analysis can be valuable tools for traders seeking to gain a deeper understanding of market behavior and trends, allowing them to make more informed trading decisions.
FB Finance Institute A.I. Daily Range Price Forecast
In the world of trading, there’s a daily puzzle that every trader grapples with, and believe me, it’s a real head-scratcher. It’s all about finding those perfect moments to make your move in the market. But guess what? With the formidable firepower of FB Finance Institute’s A.I. and the Daily Price Range Forecast at your disposal, it’s like having a wise market sage discreetly whispering priceless advice right into your ears.
Now, let’s bring in the FB Finance Institute A.I.’s daily range forecast into the mix. Here are the trading range metrics for $COST for the daily, weekly, and monthly time frames for the last year. While these numbers are valuable in and of themselves, they are all based upon the past. Every trader needs to decide what to do moving forward.
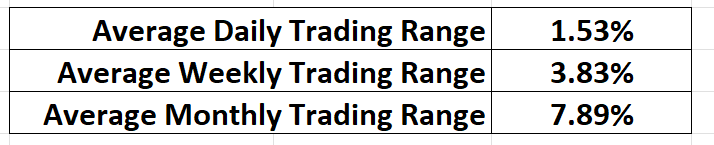
Just imagine having a subtle nudge, a gentle prod, giving you a sneak peek into the market’s next move. By seizing opportunities at the lower end of the forecast and crafting exit strategies at the peak, traders can potentially stack the odds in their favor while keeping a tight grip on risk management.
But here’s the crucial point we need to ponder, the daily valuation of the stock market isn’t solely driven by corporate maneuvers or financial disclosures. It’s a complex interplay of countless factors, from a fleeting tweet to global upheavals, all swinging the balance. Predicting these market movements is a real art form. Yet, FB Finance Institute A.I. seems to have found its sweet spot, seamlessly blending A.I. wizardry, neural brilliance, and machine learning in a relentless quest for that elusive perfect prediction. The Daily Range forecast allows traders to understand and focus on the reality that INTRINSIC VALUE is a moving target.
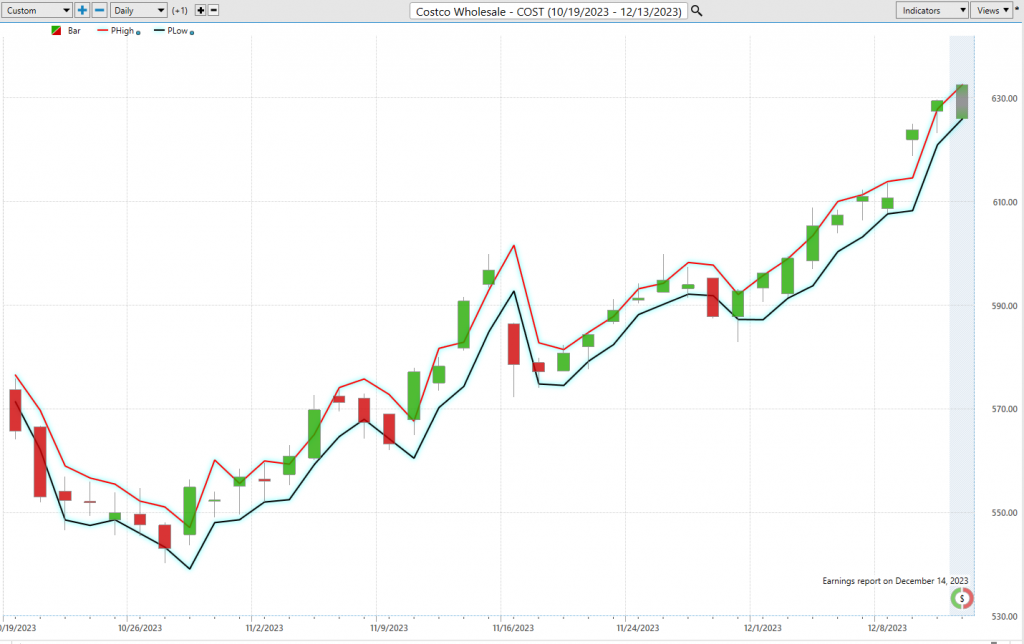
At the core of successful trading lies the ability to pinpoint that impeccable timing for market entry and exit. FB Finance Institute doesn’t just lend a hand in finding that pivotal moment; it nails it down with jaw-dropping precision. The Daily Range forecast gets a daily tune-up, offering you a window into potential price trajectories. It’s like having a seasoned market guru right by your side, sharing battle-tested insights. The chart above highlights how traders master the art of market timing!
Intermarket Analysis
We live in a global marketplace where everything is interconnected. It’s a billion-dollar question for traders out there: What are the critical factors driving the prices of the assets we’re trading? I’ll tell you, small changes in interest rates, crude oil prices, and the volatility of the dollar, among a sea of other variables, can make or break decisions for companies trying to survive in these challenging times. It’s a puzzle, folks, and investors and traders alike are grappling with it.
Now, let’s get to the meat of it. There’s incredible value in digging deep and understanding what’s driving the price action of a heavyweight like COSTCO. We’re talking about the universe of assets and their statistical correlations. These correlations show the strongest links between prices, and they matter, folks.
What sets FB Finance Institute apart, what makes it stand out in the crowd, is its patented and proprietary intermarket analysis. This here is a game-changer, a real ace up your sleeve. Intermarket analysis is all about dissecting markets by looking at the relationships between similar, different, and related asset classes. In plain English, what happens in one market can, and often does, affect others. So, studying these connections can be a real boon for traders.
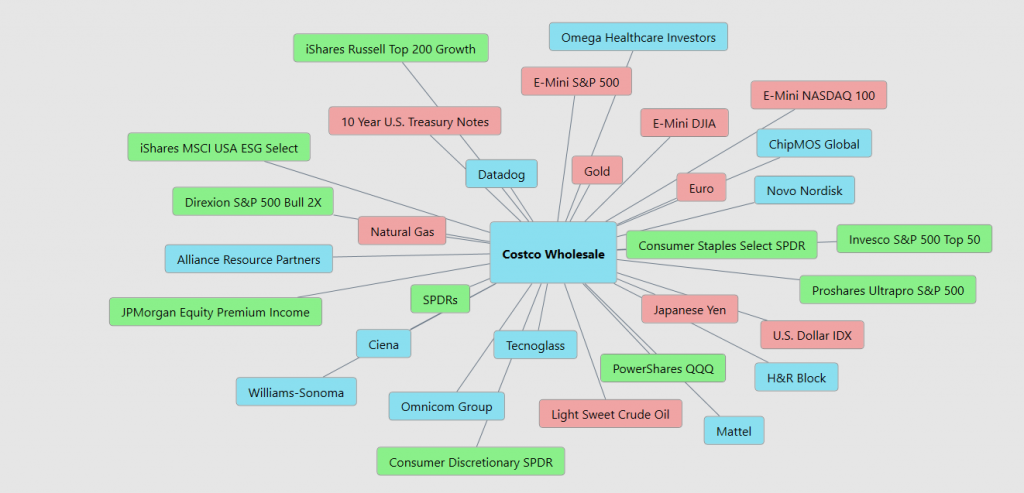
How correlated is COSTCO to the S&P 500 Index? Or the U.S. Treasury Bond Market? Or Gold? Or to Amazon? These are the questions that keep traders up at night, and for a good reason. And let me tell you, intermarket analysis is your shield against those fake news reports that parade as facts in the media. When you understand the key drivers of price, you’ve got the odds overwhelmingly in your favor when making those crucial trading decisions. It’s all about stacking the deck, my friends, and that’s what it’s all about in this high-stakes game.
Our Suggestion
We like COSTCO very much as a trading vehicle, it is volatile, liquid and trends very well. That being said, we also need to recognize that it is trading at new all-time highs.
Based on the current market conditions and the criteria provided, it appears that Costco Wholesale Corporation ($COST) is in a strong position for potential trading opportunities. The momentum is clearly in an upward direction, and the trend is firmly bullish. Moreover, the stock is currently trading at 10-year highs and 52-week highs, indicating its vitality, resilience, and dominance in the market. These factors suggest that $COST is a strong retail success story with significant potential.
One important factor to consider is the upcoming earnings report scheduled for 12/14/23, which is likely to create increased volatility in the stock. It is essential for traders to be cautious and prepared for potential price swings before, during, and after the earnings announcement. Wall Street expectations for earnings per share ($3.44) will likely be a key driver of market sentiment, and any surprises could lead to sharp price movements.
That’s what’s going to keep this Costco analysis interesting in the long run. You know how Wall Street gets jittery around earnings season, so keep a close eye on that one. This is where the rubber meets the road for Costco, and it’s going to be one wild ride, no doubt about it.
Given the strong historical performance of $COST, with buying opportunities often emerging when the stock trades around 8-10% below recent highs, traders should consider following artificial intelligence guidance to navigate potential pullbacks. A strategy to consider is looking for buying opportunities during any significant pullback in the stock price, especially if it approaches 8% below the recent high threshold. It’s important to set clear entry and exit points, implement risk management strategies, and closely monitor the stock’s performance to capitalize on potential opportunities while managing the inherent volatility associated with earnings season.
Our suggestion – Follow the a.i. trend analysis and practice good money management on all of your trades. COST has proven over and over again to be a good candidate for short-term swing trading opportunities. We anticipate that prices will begin to level off going into the next earnings call. Should that occur, we will be focused on the a.i. to provide our guidance on where we should position ourselves in this market.
Let’s Be Careful Out There!
Remember, It’s Not Magic.
It’s Machine Learning.
Disclaimer: THERE IS A HIGH DEGREE OF RISK INVOLVED IN TRADING. IT IS NOT PRUDENT OR ADVISABLE TO MAKE TRADING DECISIONS THAT ARE BEYOND YOUR FINANCIAL MEANS OR INVOLVE TRADING CAPITAL THAT YOU ARE NOT WILLING AND CAPABLE OF LOSING.
FB Finance Institute’S MARKETING CAMPAIGNS, OF ANY KIND, DO NOT CONSTITUTE TRADING ADVICE OR AN ENDORSEMENT OR RECOMMENDATION BY AI Financial Genie 4.0 OR ANY ASSOCIATED AFFILIATES OF ANY TRADING METHODS, PROGRAMS, SYSTEMS OR ROUTINES. FB Finance Institute’S PERSONNEL ARE NOT LICENSED BROKERS OR ADVISORS AND DO NOT OFFER TRADING ADVICE.