| This week’s stock analysis is U.S. Steel ($X) |
.

On August 15, 2023, the news story broke that Cleveland Cliffs ($CLF) had placed a buyout offer for U.S. Steel ($X). Upon the story becoming headline news, $X rallied almost $9 per share and closed the day just shy of $31. Over the past 10 weeks, the board of directors for U.S. Steel have been entertaining numerous additional offers to acquire the company. The Board has not disclosed who the bidders are in an attempt to build optimal shareholder value.
The steel industry has undergone significant transformations over the last 120 years. In the late 19th century, U.S. Steel was the first company to ever reach a market cap of $1 billion. The initial financing and business structures were organized by financier J.P Morgan.
Mass production of Steel is what helped build the infrastructure of the United States and many other foreign nations. This innovation laid the foundation for the rapid growth of the steel industry, powering industrialization and infrastructure development.
During the early 20th century, the United States emerged as a steel manufacturing powerhouse, with companies like U.S. Steel dominating the market. Steel became a symbol of economic might and national progress. However, the industry faced challenges during the Great Depression and both World Wars but rebounded strongly after each crisis.
In the latter half of the 20th century, the steel industry saw significant global expansion, with the rise of steel production in countries like Japan and South Korea. Technological advancements led to increased efficiency, with the introduction of electric arc furnaces and continuous casting processes. The industry also faced environmental and labor challenges, prompting modernization and automation efforts.
In recent decades, the steel industry has shifted towards globalization, with China becoming the world’s largest steel producer. Environmental concerns have led to efforts to reduce emissions and adopt more sustainable practices. Additionally, steel has found new applications in industries like automotive and construction, reflecting changing market demands. Overall, the steel industry’s resilience and adaptability have allowed it to evolve and remain a critical component of global economic development.
United States Steel Corp., a stalwart in the steel industry, specializes in the production and sale of steel products, boasting a diversified portfolio across several key business segments.
First, there’s the Flat-Rolled Products segment, a vital conductor of steel production. Here, they oversee the orchestration of steel plants and manufacturing facilities, churning out an array of products, from steel slabs to round shapes, strip mill plates, sheets, tin mill, and even iron ore and coke. It’s a complex composition that underpins the heart of their operations.
Then, there’s the Mini Mill segment, a virtuoso in its own right. This division specializes in crafting hot-rolled, cold-rolled, and coated sheets, catering to a diverse range of industries with their finely tuned steel products.
Across the Atlantic, the U.S. Steel Europe segment takes center stage, producing and marketing a dazzling array of offerings. From strip mill plates to spiral welded pipe, heating radiators to refractory ceramic materials, they harmonize a collection of products that resonate with European markets.
And finally, we have the Tubular Products segment, known for its precision and craftsmanship. Here, seamless, and electric resistance welded steel casing and tubing, line pipe, and mechanical tubing are expertly manufactured and traded.
The steel industry is buzzing with the news that U.S. Steel, one of the biggest players in the game, is “in play,” and it’s shaking up the domestic steel market like a freight train. Cleveland-Cliffs, another heavyweight in the steel world, dropped a bombshell by expressing interest in buying U.S. Steel. They put a $35-per-share offer on the table, a mix of cold, hard cash and stock. But guess what? U.S. Steel said, “No thanks,” and started checking out other dance partners.
Now, this is a big deal with potentially huge consequences. You see, there are only a handful of major players in the steel industry, and this kind of acquisition talk sends shockwaves through the entire sector. When the market opened after the news broke, every steel company’s stock went up, including Cleveland-Cliffs, which is unusual because normally the buyer’s stock takes a hit when they’re shelling out the cash. So why the buzz? Well, investors are thinking, “Who’s next?” When one company gets a juicy takeover offer, it makes folks wonder if there’s more hidden value in the steel industry than meets the eye. But here’s the twist – Cleveland-Cliffs isn’t new to this game. They’ve already gobbled up two major steel manufacturers and buying U.S. Steel would make them the heavyweight champion of steel production. That’s a lot of pricing power, especially in key markets like automobiles, which could raise some eyebrows with the regulators. U.S. Steel faces competition from other prominent steel producers such as Nucor Corporation ($NUE), ArcelorMittal ($MT), and Steel Dynamics ($STLD). The stock is currently trading at 13.87X forward 12-month earnings. Over the past five years, the stock has traded as high as 79.88X and as low as 3.97X, with a 5-year median of 4.44X.
Now, U.S. Steel said “No,” but that doesn’t mean the story’s over. Wall Street’s already gossiping about other offers on the table, including a private buyer willing to fork out $35 per share in cold, hard cash.
This is a very tricky situation for traders and investors. I’ll summarize the two most probable scenarios:
- Another player in the industry acquires $X at slightly higher prices than where the stock is currently trading. The highest probability price is between $35 and $40 per share.
- If a deal is not put together by the board of directors, and a buyout falls through, the stock would most likely fall back to the level it was trading at before the acquisition talks began, which is roughly $23 per share.
So, you have potentially $7 on the UPSIDE versus $10 risk on the downside.
Here’s a quantified breakdown of steel production by the top countries in 2022:
1. **China**: 1,032.8 million tons (Mt)
2. **India**: 118.1 million tons (Mt)
3. **Japan**: 96.3 million tons (Mt)
4. **United States**: 86.0 million tons (Mt)
5. **Russia**: 76.0 million tons (Mt) (estimated)
6. **South Korea**: 70.6 million tons (Mt)
7. **Turkey**: 40.4 million tons (Mt)
8. **Germany**: 40.1 million tons (Mt)
9. **Brazil**: 36.0 million tons (Mt)
10. **Iran**: 28.5 million tons (Mt) (estimated)
It’s worth noting that while China is the largest steel producer, it produces more steel than the rest of the world combined. Additionally, the steel industry is one of the world’s most energy-intensive and carbon-rich industries, contributing significantly to global carbon dioxide emissions.
The streets are abuzz with speculation. The reward would be a buyout offer slightly higher than $35 per share. The risk is a retracement to the $23 per share. The risk is far greater than the prospective rewards and for this reason alone traders may want to watch this from the sidelines since the current risk/reward scenario is lopsided in the favor of risk. However, we will analyze $X as we would any other stock. However, please note that since this is a buyout play, the facts surrounding the takeover will dominate the trade moving forward.
In this weekly stock study, we will look at and analyze the following indicators and metrics as our guidelines which dictate our behavior in deciding whether to buy, sell, or stand aside on a particular stock.
- Wall Street Analysts’ Estimates
- 52-week high and low boundaries
- Best Case – Worst Case Analysis and Takeaways
- FB Finance Institute A.I. Forecast (Predictive Blue Line)
- Neural Network Forecast
- Seasonality Analysis
- FB Finance Institute A.I. Daily Range Forecast
- Intermarket Analysis
- Our trading suggestion
We don’t base our trading decisions on things like earnings or fundamental cash flow valuations. However, we do look at them to better understand the financial landscape that a company is operating under.
Wall Street Analysts’ Estimates
The 6 analysts offering 12-month price forecasts for United States Steel Corp have a median target of 32.50, with a high estimate of 40.00 and a low estimate of 25.00. The median estimate represents a -4.30% decrease from the last price of 33.96.
I like to display these metrics graphically on a spreadsheet which allows me to look at the entirety of their analysis very quickly.
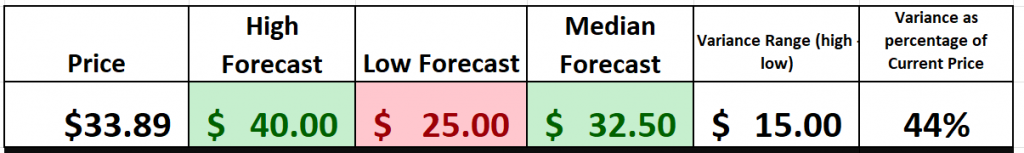
U.S. Steel has been offered $35 per share in their takeover talks from an anonymous buyer. Wall Street’s most bullish analysts is forecasting $40 per share as the Highmark. Within the graphic above is a representation of the risk/reward scenario on this trade.
52-Week High and Low Boundaries
Over the past year, $X has seen highs soaring to $34.37 and lows touching down at $18.92. That’s a swing of nearly $15.45! Now, for those of you who’ve been with me, you know we often talk about the 52-week range. It’s not just some arbitrary numbers; it’s the market’s heartbeat, telling us the story of investor sentiment.
Currently, $X is trading at the 97th percentile of its annual range. So, what’s the narrative here? It’s like watching a champion nearing the finish line, pushing boundaries, and challenging its 52-week high. But remember, these aren’t just numbers; they’re a reflection of the market’s pulse, its highs and lows, its cheers, and fears.
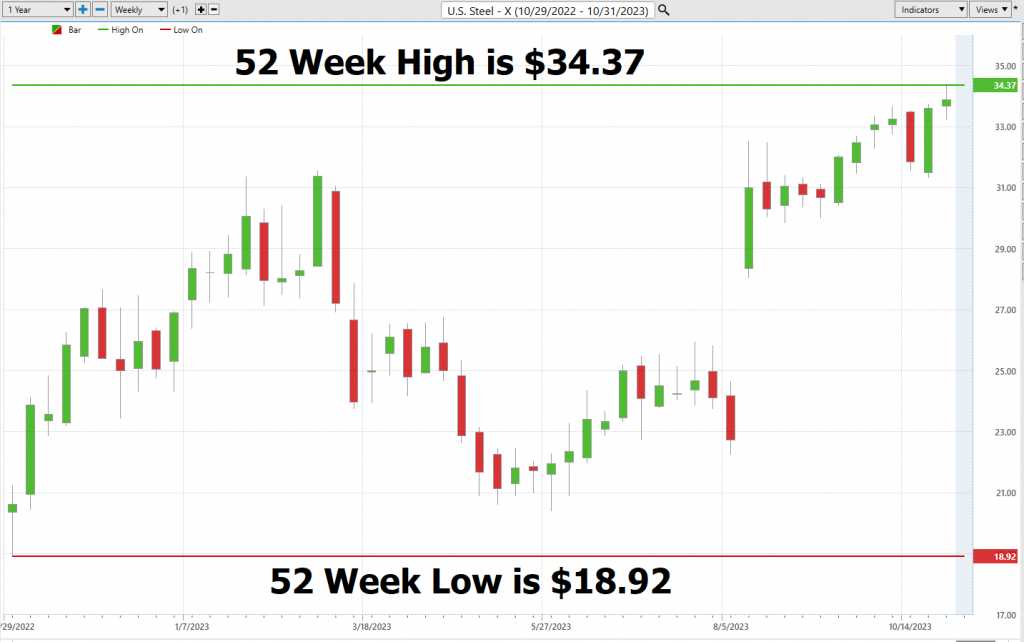
Now, let’s talk about volatility. With an annualized statistical volatility of 45% on $X, it’s clear this stock isn’t for the faint-hearted.
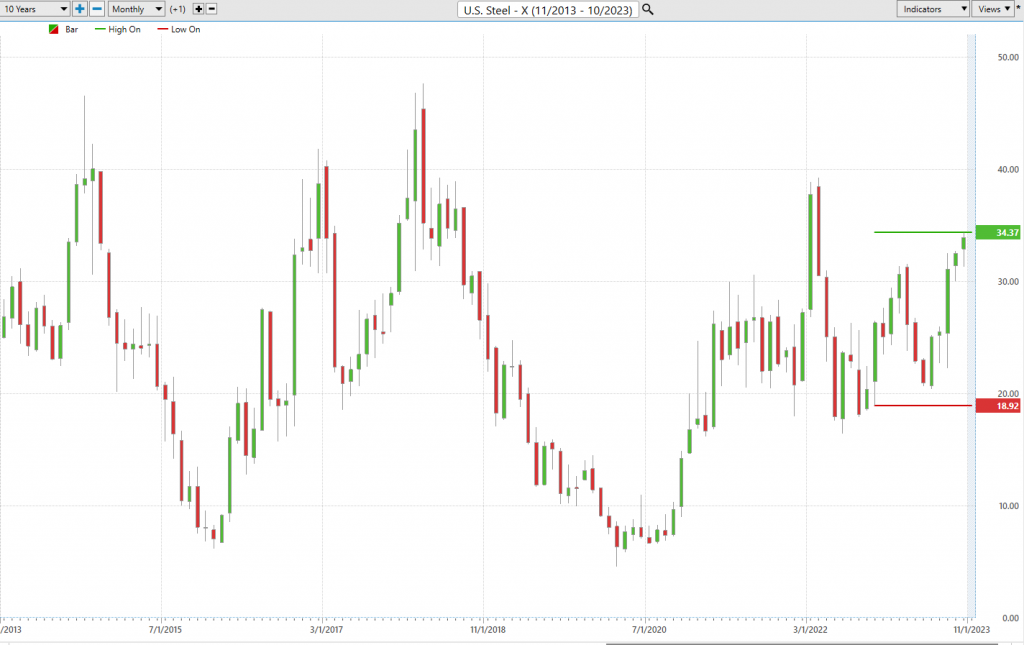
When we bring in the 10-year monthly chart we can clearly see that over the last decade $X has traded in a very broad consolidation pattern.
Best Case – Worst Case Scenario
When we enter the realm of trading, it’s akin to embarking on a journey through uncharted territory. Just as a seasoned explorer wouldn’t set out without a map and compass, neither should a trader or investor. One of the most invaluable tools in our analytical toolbox is the best-case and worst-case analysis. Think of it as scrutinizing a complex puzzle through two distinct lenses, each revealing a different facet of the same enigma.
Now, why is this analytical approach so pivotal? Well, by thoroughly examining both the optimistic scenarios and the pessimistic outlooks, you equip yourself with a comprehensive, 360-degree perspective on a stock’s potential. It’s not just about focusing on the potential rewards; it’s equally about considering the potential pitfalls and obstacles along the way. This dual-lens approach serves as the foundation for understanding the nuances and intricacies within an asset’s behavior, much like having a reliable compass in the ever-changing landscape of financial analysis.
By assessing both the potential upsides and downsides, you’re not merely proceeding blindly; you’re navigating with precision. It allows you to gauge your exposure, to know when to stay the course and when to adjust your strategy. It’s about evaluating the true value of a stock, not just its surface allure.
This analytical methodology provides a valuable lens through which we can assess the range of potential price movements, offering a pragmatic perspective on the risk and volatility inherent in trading U.S. Steel ($X).
As depicted below, the graphic encapsulates this analytical journey. First, we do the Best-Case analysis:
In the grand scheme of things, this isn’t just a method; it’s a guiding principle. The ultimate goal? To understand how a stock’s peaks compare to its valleys, ensuring you’re not merely deciphering the puzzle but mastering it. Always remember, in the world of trading, knowledge isn’t just power; it’s your compass to prosperity.
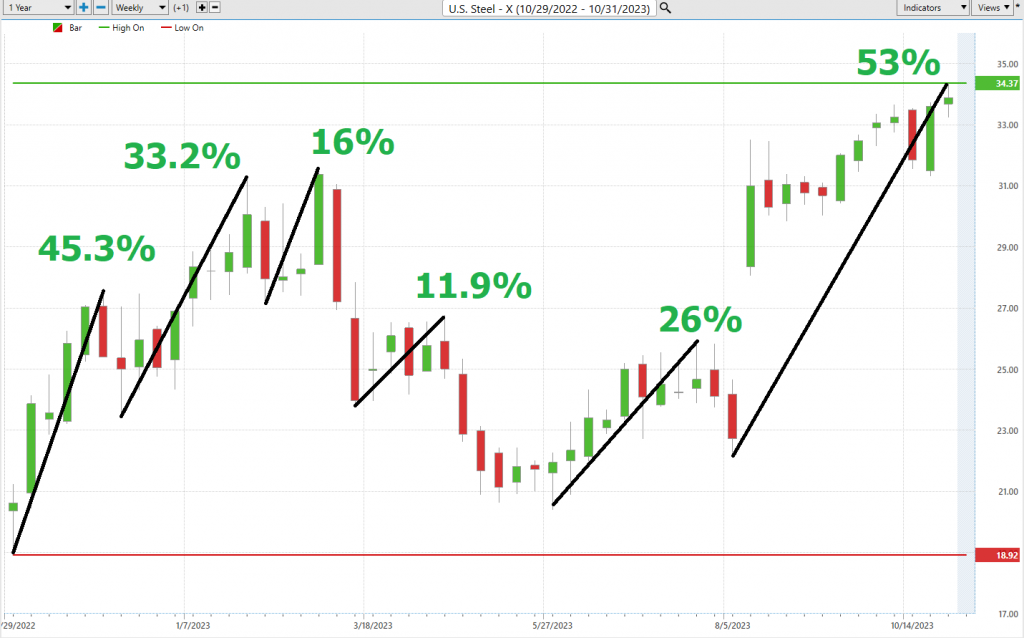
Followed by the WORST-CASE Analysis:
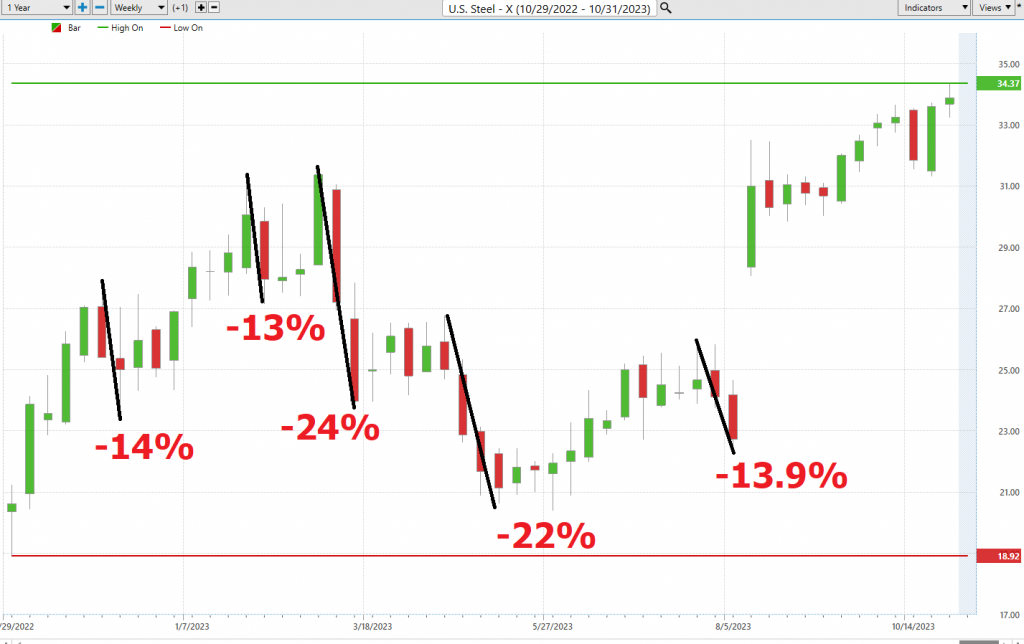
This initial analysis lets us see how quickly $X falls in comparison to its rallies.
Next, we want to compare the performance of $X to the major broad market indexes.
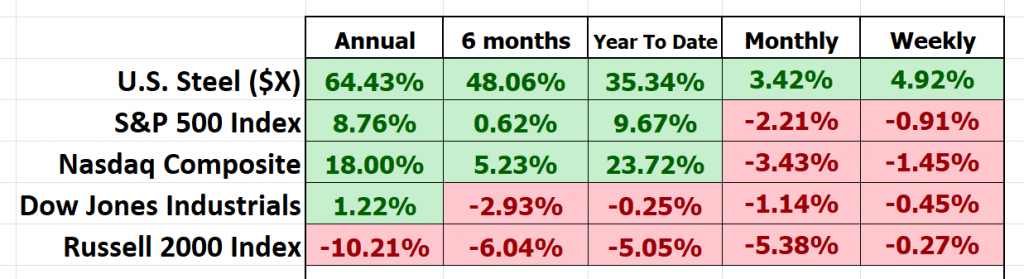
$X, has been a standout performer, consistently outshining the broader market indices across all time frames. Its stellar performance warrants a closer look, particularly in terms of volatility and its comparison with market heavyweights. In the world of traders, this is often encapsulated by a metric known as “BETA.”
Beta, denoted as β, functions as the Richter scale of the stock universe, offering us a window into how much a stock sways and reacts in response to the broader market’s movements, often measured against a prominent index like the S&P 500. In simpler terms, beta quantifies a stock’s responsiveness to the market’s ebbs and flows.
Now, let’s embark on a deeper exploration of beta, a crucial metric for deciphering a stock’s intricate relationship with the broader market. Here’s the lowdown:
– **Beta = 1:** When a stock boasts a beta of 1, it’s an indication that its price fluctuations closely mimic those of the overall market. Picture it as a synchronized dance. If the market experiences a 5% surge, a stock with a beta of 1 should elegantly follow suit with a 5% increase.
– **Beta > 1:** Imagine this scenario as a thrilling rollercoaster ride through the stock market. A beta exceeding 1, let’s say 1.5, implies that the stock is 50% more volatile than the market itself. When the market enjoys a heart-pounding 5% ascent, this high-beta stock might embark on an adrenaline-pumping 7.5% climb (or descent, for that matter).
– **Beta < 1:** Now, let’s shift our focus to stability. A beta below 1, perhaps 0.5, signals that the stock is only half as volatile as the market. It’s akin to finding your equilibrium amidst the market’s ebbs and flows. In a 5% market upswing, this stock might experience a more composed 2.5% rise.
In the world of finance, beta is the compass that guides us through the turbulent waters of market sensitivity. Understanding this metric provides investors and analysts with invaluable insights into how stocks dance to the rhythm of the broader market’s movements.
Now, let’s apply this wisdom to $X, U.S. Steel, $X exhibits a beta of 2.08. It’s crucial to note that beta is rooted in historical data and doesn’t necessarily foretell future performance. High beta doesn’t guarantee high returns; instead, it underscores the stock’s inclination for price fluctuations, signaling a heightened level of risk.
Investors turn to beta as a risk assessment tool, helping them construct portfolios aligned with their risk tolerance and investment objectives. So, when we scrutinize $X, we encounter an asset that undeniably exhibits significantly more volatility than the broader stock market indices. It’s akin to a high-octane ride, offering both the promise of tremendous opportunity and the specter of heightened risk.
FB Finance Institute A.I. Predictive Blue Line Forecast
On the following chart you will see the power of the FB Finance Institute Predictive blue line which determines the medium-term trend price forecast.
The guidelines we abide by are as follows:
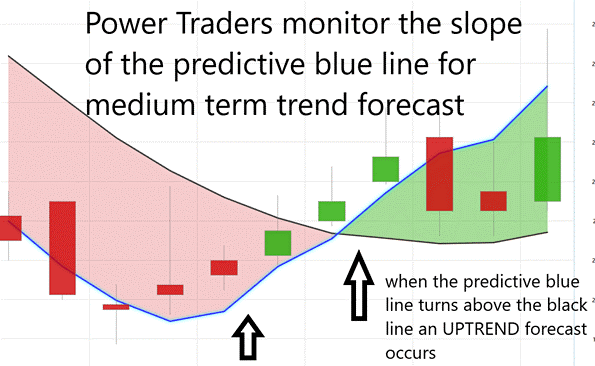
- The slope of the predictive blue line determines the trend forecast and general direction of $X.
- Ideally, the VALUE ZONE is determined to try and find buy opportunities at or below the predictive blue line, or to sell opportunities above the predictive blue line during a downtrend.
Ladies and gentlemen, let me break it down for you – in the world of trading, the predictive blue line, is your North Star, your guiding light. It’s the key to unlocking the future, and that’s no exaggeration. We’re diving into the thrilling world of trading, and FB Finance Institute Software is the rock star of the show, thanks to its mind-blowing artificial intelligence capabilities. Think of it as your crystal ball, your secret weapon, offering traders an exclusive sneak peek into future trends, all thanks to the insights provided by that game-changing predictive blue line.
Now, you might be wondering about the black line. It may seem straightforward, but it’s our trusty rearview mirror, a 10-day moving average of prices that gives us a snapshot of the market’s recent history.
But let’s get back to the real superstar here, the predictive blue line. This isn’t just any ordinary line; it’s the holy grail, the sweet spot where savvy traders in an uptrend look to make their moves. It’s the marker of opportunity, the gateway to success, and what’s the secret sauce behind this magnificent blue line, you ask? It’s all thanks to FB Finance Institute’s groundbreaking technology – a symphony of artificial intelligence, neural networks, and intermarket analysis, all working in perfect harmony to pave the way forward.
Now, as you dig into the chart, I want you to pay close attention to the intricate dance between the black line and the predictive blue line. This blue line isn’t based on hunches or guesses; it’s the result of FB Finance Institute’s cutting-edge neural network, machine learning and intermarket analysis. It meticulously dissects the most influential price drivers of an asset, harnessing the immense power of AI and data correlations to reveal an asset’s true worth for that day.
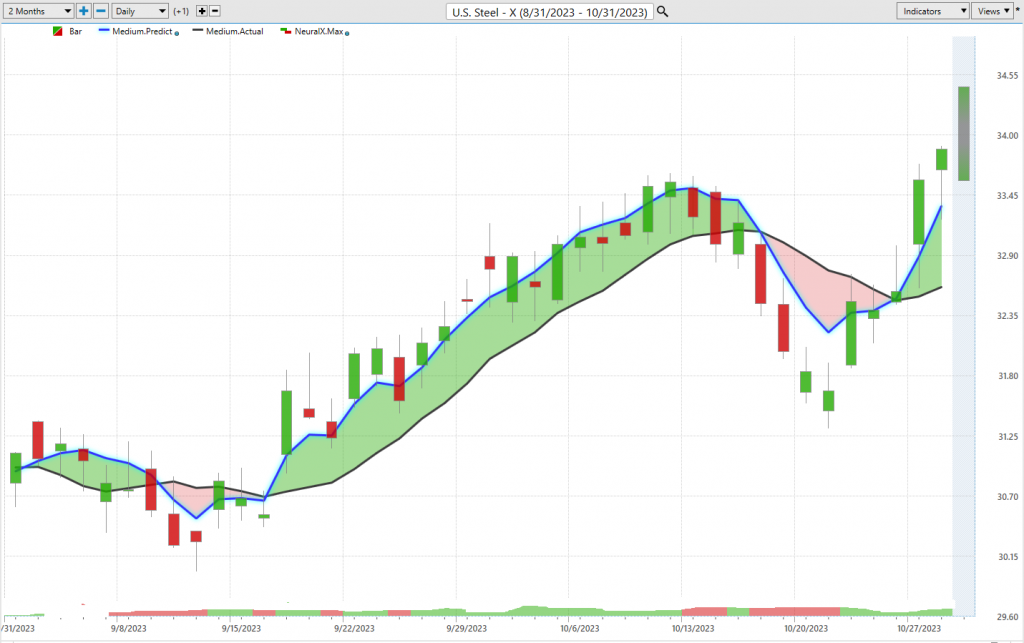
And here’s the golden nugget – when that predictive blue line soars above the black line, it’s like the market’s way of waving a green flag, shouting, “Opportunity ahead!”
Neural Network Indicator (Machine Learning)
Now, let’s dive a bit deeper into what these neural networks truly are. They have a rich history dating back to the 1950s, with pioneering research conducted at esteemed institutions like Cornell and Carnegie Mellon. Think of neural networks as the computational brains behind super-smart trading robots, designed to make astute decisions when it comes to navigating the complex world of buying and selling assets.
Visualize this neural network as a sprawling web of interconnected dots, much like a spider’s intricate web. Each dot represents a small decision-making point for the robot, and they are all linked together by lines of code. At the outset, this trading robot’s brain is essentially a blank slate, waiting to be trained by traders like you and me. We provide it with a plethora of real-life examples, teaching it the art of buying when prices are low and selling when they’re high.
The robot sifts through these examples, discerning patterns and correlations. It learns that the strategy of buying low and selling high tends to lead to favorable outcomes. With each additional example, those connections between the dots grow stronger. The robot becomes exceptionally skilled at recognizing optimal moments for buying and selling, almost as if it’s tapping into its own intuition.
So, think of a neural network for trading as the sophisticated brain of a savvy trading robot, constantly learning from real-world scenarios, and using that knowledge to make shrewd decisions throughout the buying and selling process.
Now, back to our chart. Right at the bottom, you’ll notice something called the Neural Index Indicator. When it’s bathed in a vibrant green hue, it signals that the market has some energy and momentum behind it. But when it flashes red, it’s offering a subtle hint that we might be in for a bout of downward price action.
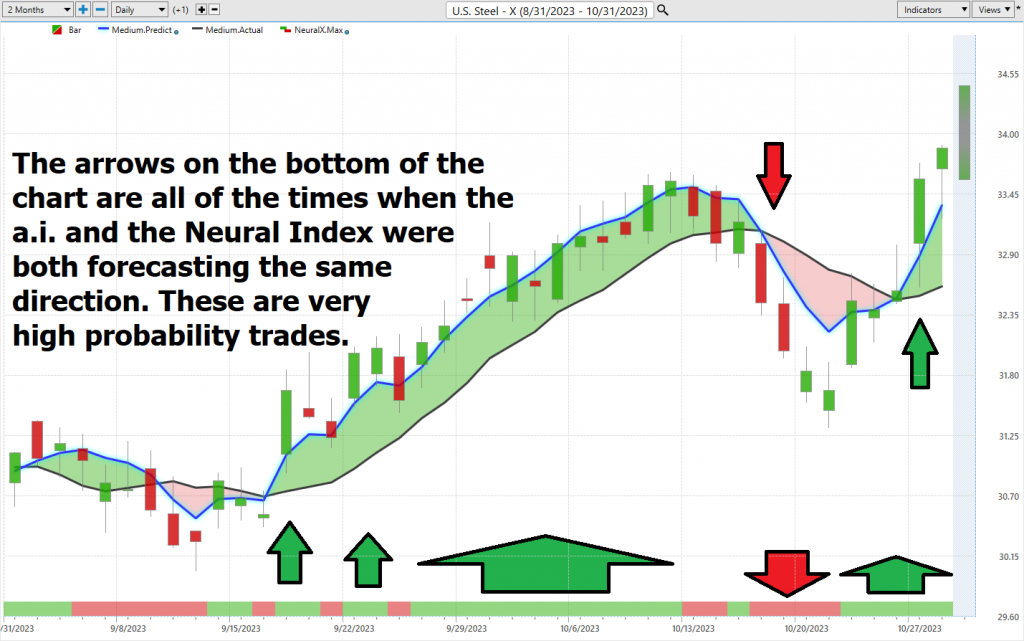
Now, why do we integrate AI and machine learning into these neural networks? Well, it’s because they’re invaluable tools for forecasting stock prices, dissecting vast financial datasets, and identifying anomalies in the market. Smart traders like you combine the insights derived from these neural networks with the power of AI to uncover reliable trading opportunities in this ever-evolving financial landscape. It’s like having a team of expert analysts at your disposal, analyzing market data with precision and speed that no human could match.
FB Finance Institute A.I. Seasonality Analysis
Seasonal analysis in stock trading is like looking at patterns that happen at certain times of the year, just like how you might notice the weather changing during different seasons. But instead of weather, we’re talking about how stocks behave over time.
Now, how do we figure this stuff out? Well, it’s like keeping track of your favorite sports team’s performance year after year. You gather lots of data about how the stock market or a specific stock has done during specific days, months, or seasons. You look at things like, “Does a stock tend to do better in the summer or winter?” or “Does it go up or down during the holidays?” This data is like our playbook.
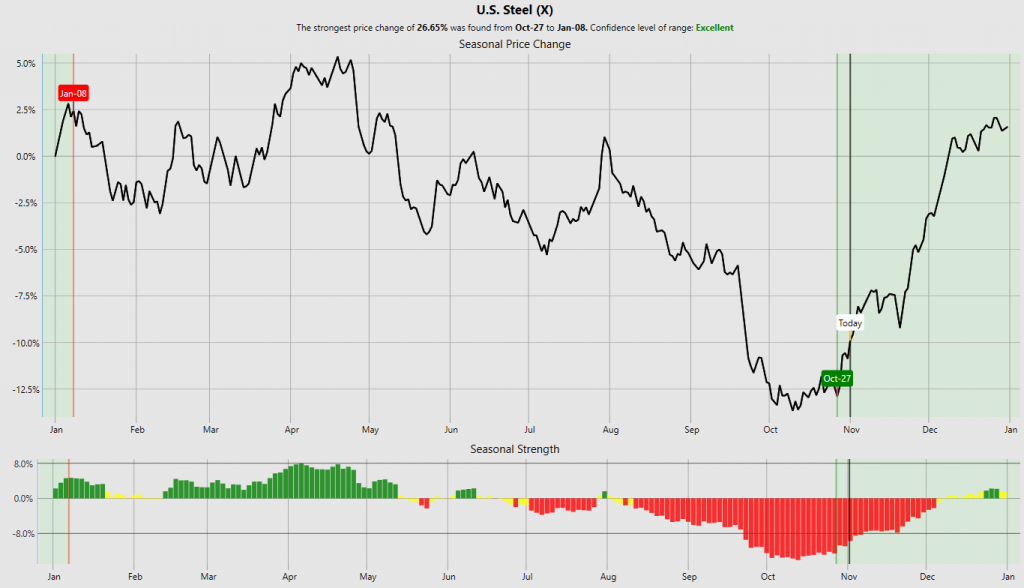
So, why is seasonal analysis important for traders? It’s because knowing these patterns can help them make smarter decisions. For example, if they see a stock that tends to do well in a certain month each year, they might consider buying it during that time. Or if they notice a stock usually goes down in a particular season, they might be cautious. It’s like having a roadmap to help traders understand when to make their moves and when to be careful. So, seasonal analysis is like the playbook that traders use to understand stock trends throughout the year.
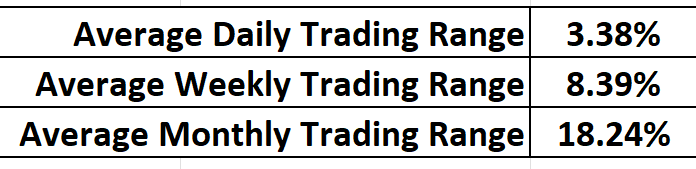
Daily Range Forecast & Analysis
For the elite Power Traders who’ve anchored their faith in FB Finance Institute Software, there’s one feature they consult with unwavering regularity: the FB Finance Institute Daily Price Range forecast. It’s as though this instrument has morphed into their financial North Star, illuminating the often-murky waters of market maneuvers.
Let’s delve into the average trading range metrics for $X over the past year, spanning daily, weekly, and monthly intervals.
Now, every trader grapples with this daily conundrum – and believe me, it’s a profound one – discerning those precise junctures to stake their claim in the market. Yet, with the prowess of FB Finance Institute’s A.I. and the Daily Price Range Forecast, it feels akin to having a market sage discreetly dispensing invaluable counsel.
Now, introduce FB Finance Institute A.I.’s daily range forecast into the mix. Picture having a subtle hint, a gentle prod, forecasting the market’s next move. By seizing opportunities at the forecast’s lower spectrum and strategizing exits at its zenith, traders can potentially steer the odds in their favor, all the while maintaining a firm grip on risk.
But here’s a crucial point to ponder: the stock market’s daily valuation isn’t solely influenced by corporate maneuvers or financial disclosures. Factors as diverse as a fleeting tweet to global upheavals can tilt the balance. Thus, predicting market movements? It’s a sophisticated art. Yet, FB Finance Institute A.I. appears to have carved a niche, harmoniously melding A.I., neural ingenuity, and machine learning in the quest for that impeccable prediction.
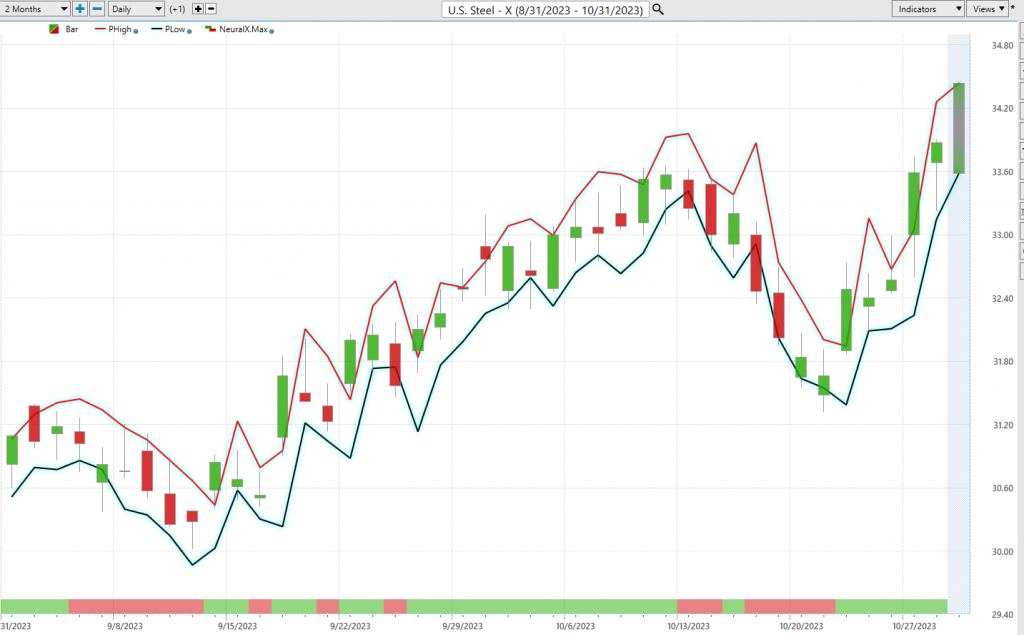
The essence of triumphant trading hinges on discerning that impeccable timing for market entry and exit. FB Finance Institute doesn’t merely assist in identifying that pivotal moment; it achieves it with astounding acuity. The Daily Range forecast undergoes daily updates, offering a lens into potential price trajectories. It’s akin to having a seasoned market guru imparting time-tested insights.
Now, cast your eyes on that chart. It’s more than mere aesthetic curves; it’s a roadmap for strategic stop placements and risk management. Observe the infrequency with which prices dip below that pronounced dark line? It’s a clear indicator, suggesting the optimal zone for buy stop placements, ensuring risks remain well-calibrated.
Intermarket Analysis
Imagine, if you will, the world of trading and investments as an intricate puzzle. We find ourselves on a quest to decipher the enigma of why the prices of assets such as stocks, oil, and currencies ebb and flow. But it’s no straightforward task.
What we truly need is to put on our detective hats, to delve deep into the core of what’s genuinely propelling these price fluctuations. And that’s where the concept of “intermarket analysis” takes center stage. Consider it as collecting evidence from various corners to crack the case.
Our financial universe, you see, resembles a sprawling web, where every thread is interwoven with another. Intermarket analysis serves as the tool of choice for astute traders and investors, allowing them to scrutinize the intricate connections among various elements, such as stocks, oil, and currency values. Through this process, they gain the ability to make informed forecasts about potential price movements and execute more intelligent strategies.
Picture it like having a handful of strings, where tugging on one sets the others in motion. That’s the essence of it. If you comprehend these interconnections, you’re equipped to make predictions and fine-tune your tactics to capitalize on opportunities and maximize gains. So, in straightforward terms, intermarket analysis serves as our key to unraveling the mysteries behind price shifts and comprehending how the diverse pieces of the financial puzzle interlock. It’s akin to adopting the role of a financial detective, guiding us to make shrewder decisions in the dynamic realm of trading.
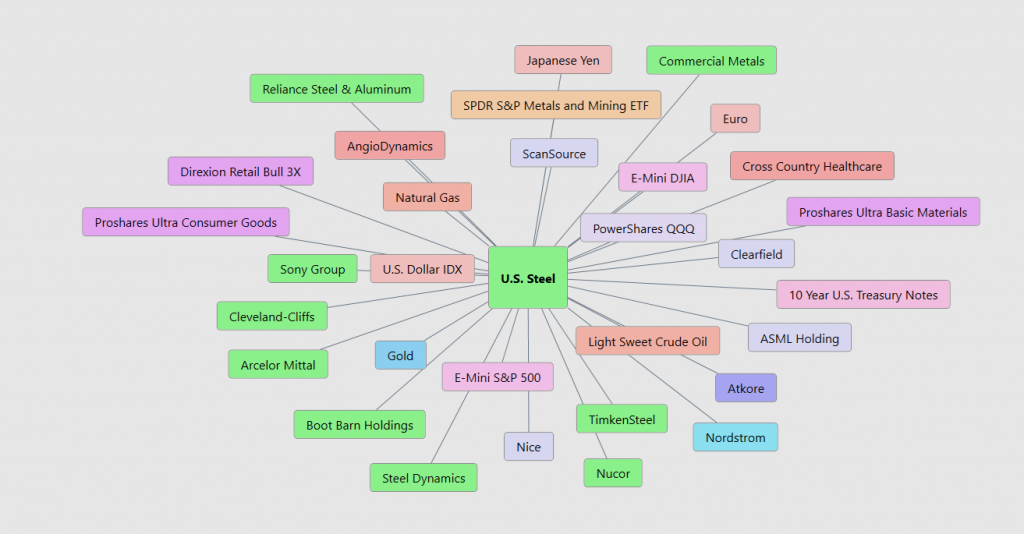
Now, take a look at this Intermarket Analysis graphic before you. It unveils the 31 markets that play pivotal roles in influencing the price of $X. There’s tremendous value in studying and grasping the essential drivers behind $X’s price dynamics. This graphic provides a microcosmic perspective of the factors propelling $X’s ascent. You’ll even spot a handful of biotech and pharmaceutical ETFs whose price movements are statistically correlated with that of $X.
Our Suggestion
U.S. Steel made a big announcement on August 13, 2023. They’ve taken the bull by the horns and initiated a full-blown review process, getting some external financial and legal experts in on the action. They’re exploring all their strategic alternatives, and it’s making waves!
Management of U.S. Steel wants to sellout for the highest price possible. U.S. Steel isn’t just twiddling its thumbs here. They’ve been getting unsolicited proposals left and right. Some folks are eyeing certain production assets, while others are thinking about the whole enchilada.
Now, the primary suitor is Cleveland-Cliffs Inc., and they came in swinging with a proposal to buy the whole shebang. But here’s the kicker – U.S. Steel’s board said, “No thanks.” A key risk factor for traders and investors to consider is the potential regulatory hurdles. Some bureaucrats in Washington DC will eventually decide on whether US Steel ($X) being acquired by a competitor rest too much monopolistic power in one player.
U.S. Steel’s board, they’re all about looking out for their shareholders and stakeholders, and they’re gathering all the info they need to make the right call.
Now, there isn’t a deadline here, no set timetable for $X. And there’s no guarantee they’ll go through with any of these proposals.
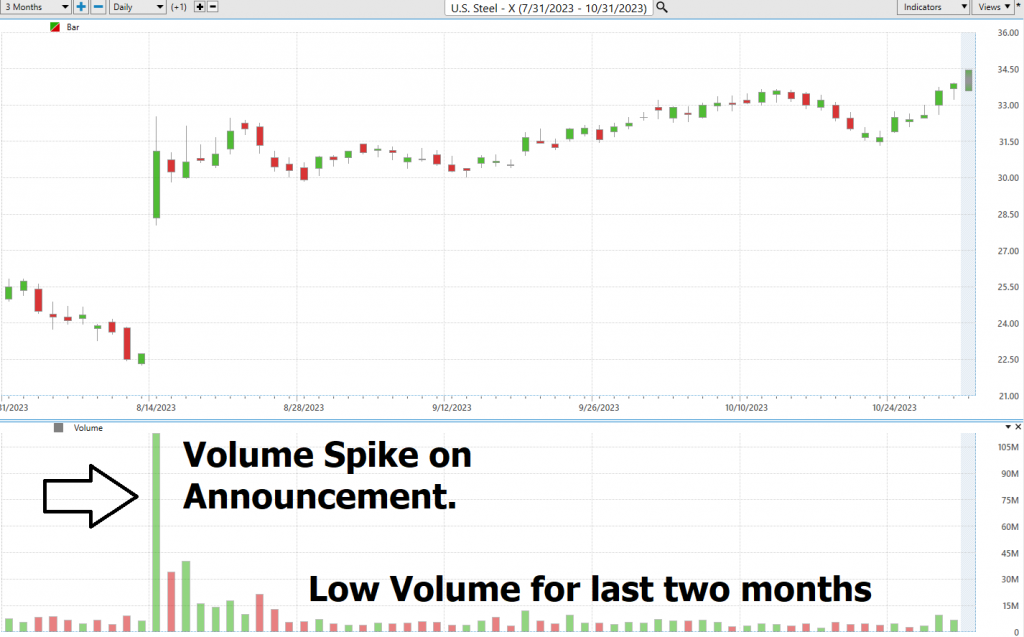
Since management is trying to milk the $X valuation as much as possible this drama could quite possibly take several more weeks to unfold. From a trading and investing standpoint watch VOLUME on $X as it pulls back. Volume EXPLODED on the announcement.
The lack of volume in the stock over the last two months is indicative that the reward on the upside is much smaller than the potential risk of a substantial pullback.
If and when the buyout goes through it will probably be close to $40 per share. Meanwhile if the deal falls apart, the expectation would be to see $X trade back towards the $23 area. Ultimately, practice good money management and consult the A.I.
We will re-evaluate daily based upon:
- New Wall Street Analysts’ Estimates
- New 52-week high and low boundaries
- FB Finance Institute A.I. Forecast (Predictive Blue Line)
- Neural Network Forecast
- Daily Range Forecast
The trend in $X is UP.
Let’s Be Careful Out There!
It’s Not Magic.
It’s Machine Learning.
Disclaimer: THERE IS A HIGH DEGREE OF RISK INVOLVED IN TRADING. IT IS NOT PRUDENT OR ADVISABLE TO MAKE TRADING DECISIONS THAT ARE BEYOND YOUR FINANCIAL MEANS OR INVOLVE TRADING CAPITAL THAT YOU ARE NOT WILLING AND CAPABLE OF LOSING.
FB Finance Institute’S MARKETING CAMPAIGNS, OF ANY KIND, DO NOT CONSTITUTE TRADING ADVICE OR AN ENDORSEMENT OR RECOMMENDATION BY AI Financial Genie 4.0 OR ANY ASSOCIATED AFFILIATES OF ANY TRADING METHODS, PROGRAMS, SYSTEMS OR ROUTINES. FB Finance Institute’S PERSONNEL ARE NOT LICENSED BROKERS OR ADVISORS AND DO NOT OFFER TRADING ADVICE.