| This week’s a.i. Asset Study is SILVER ($SI) |
When uncommon things occur in the markets you should always pay attention. Currently we are seeing the stock market indexes move to new all-time highs. What is uncommon about this motion is that gold, silver, platinum, copper, and bitcoin are also making either new 52-week highs or challenging their all-time highs as well. In this asset study we will do a deep dive on SILVER specifically to better understand the risk, reward and reality of that market for traders.
Sometimes when markets move it is almost impossible to understand the reason of what is creating the motion. Financial media often proposes ideas, or theories but when you dig deep into these theories you will quickly see it is mere speculation.
One of the trends that I think is unfolding slowly around the world is de-dollarization. The U.S. dollar is still the reserve currency of the world, but since the Great Financial Crisis of 2008 we have seen an emergence of countries dissatisfied with how the dollar has been weaponized.
We are witnessing the birth of a new monetary order centered around hard currency and commodity-based assets. This shift represents a direct challenge to the established fiat system and the inflationary policies implemented by Western monetary authorities. Russian President Vladimir Putin’s recent actions underscore the significance of commodities and real assets as superior collateral compared to fiat currencies. This new order emphasizes the stability and value retention of hard assets in a world where fiat currencies are increasingly viewed with skepticism.
If you question this logic, consider the performance of the U.S. Treasury market compared to precious metals like silver and gold. Since March 2020, U.S. Treasuries have fallen by -21%, while gold and silver have risen by 115% and 70%, respectively.
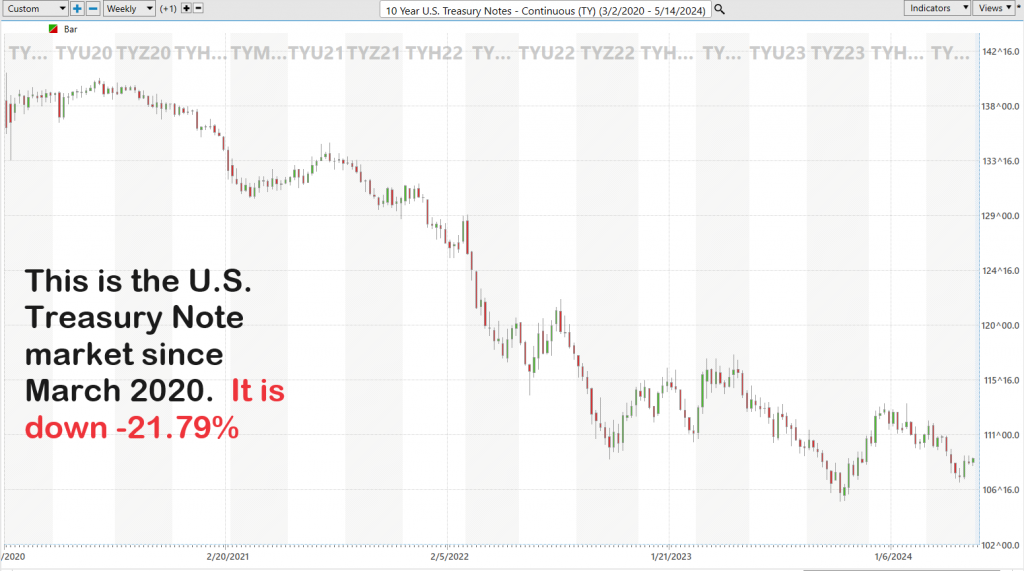

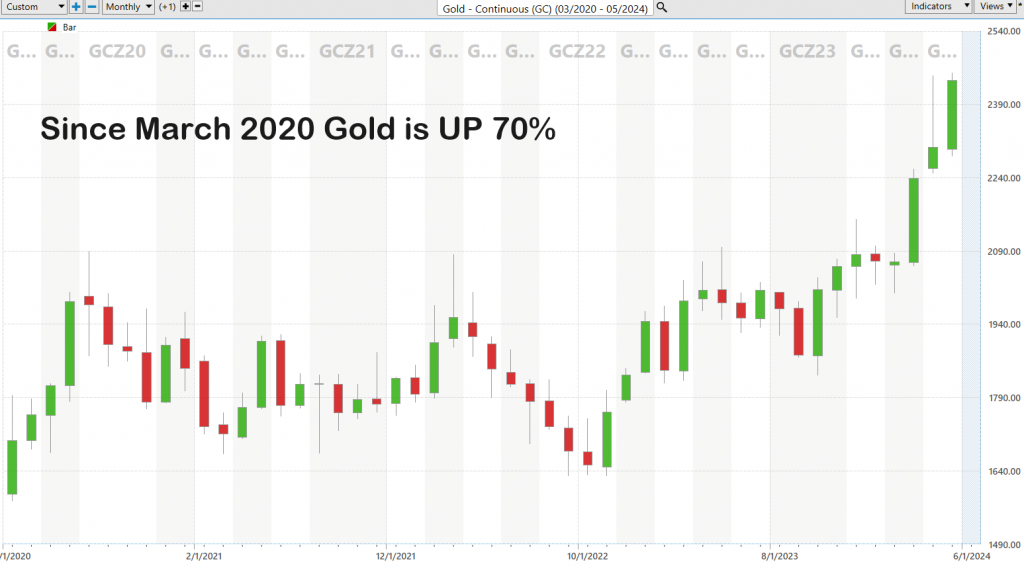
This stark contrast highlights the diminishing confidence in fiat currencies and government debt, as investors increasingly turn to tangible assets that offer better protection against inflation and economic uncertainty. The Western financial sanctions imposed on Russia in response to the war in Ukraine have had unintended consequences, harmed the economies of the sanctioning countries while failed to significantly impact their intended target. The freezing of Russia’s foreign exchange reserves has alarmed other nations, prompting them to reconsider their reliance on dollar-denominated trade.
Imagine if your bank account were frozen for any reason. How much trust would you retain in the bank, and would you recommend it to others? Since the onset of the Ukraine war in February 2022, the world has watched as Western democracies effectively froze Putin’s assets. Regardless of whether one agrees with these measures, other countries are drawing their own conclusions: holding U.S. dollar-denominated assets now carries the additional risk of forfeiture if they oppose U.S. political policies. These sanctions are driving Russia and China into a closer partnership, distancing them further from financing U.S. deficits through the purchase of Treasuries. Recently, China, which had ceased buying U.S. Treasuries in 2014, sold $56 billion worth of these assets. The question arises: who bought them? The answer is the Federal Reserve, which highlights the diminishing international demand for U.S. debt.
Saudi Arabia is already contemplating switching its oil transactions from the U.S. dollar to the Chinese yuan. This move reflects the growing disenchantment with U.S. Treasuries, which offer meager yields, especially when inflation expectations are considered. The precedent set by the U.S. seizing Russian assets raises concerns that other countries’ assets could also be targeted. These developments are unsettling market participants and signaling a significant shift away from fiat debt instruments. The decline in confidence in Treasury Notes, which symbolize American economic dominance, is a noteworthy development. This exodus underscores the broader trend of moving towards hard assets and away from fiat currencies, indicating a profound transformation in the global financial landscape.
The BRICS nations, consisting of Brazil, Russia, India, China, and South Africa, were created to foster a more balanced global economic structure and to provide an alternative to the dominant Western financial institutions like the International Monetary Fund (IMF) and the World Bank. The group’s formation in 2009 was driven by the recognition that emerging economies needed a platform to coordinate their efforts to influence global economic policies, promote economic growth, and enhance trade and investment among member countries. The BRICS nations collectively represent a significant portion of the world’s population, GDP, and landmass, positioning them as a formidable force in global economic discussions and decision-making.
As the influence of the BRICS has grown, so has interest from other nations seeking to join the bloc. Over the years, several countries have expressed their desire to become part of BRICS to benefit from the economic cooperation and increased geopolitical influence it offers. As of 2024, more than 36 countries have formally applied or shown interest in joining the group, including Argentina, Iran, Indonesia, and Nigeria. The expansion of BRICS is seen as a move to strengthen the coalition’s ability to advocate for a more multipolar world order and to challenge the traditional dominance of Western-led financial institutions and policies.
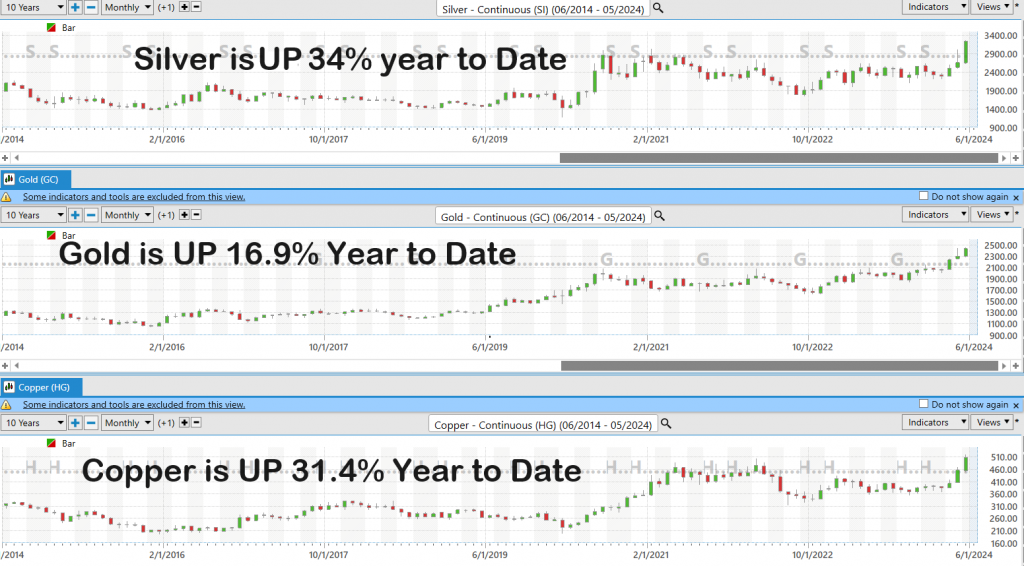
The financial markets are currently experiencing an unusual phenomenon where both the stock market and various commodities, including gold, silver, copper, platinum, and bitcoin, are reaching new highs simultaneously. This uncommon occurrence can be attributed to a confluence of several key factors. One of the primary drivers is the massive economic stimulus measures implemented by governments and central banks worldwide, which have injected significant liquidity into the markets. This influx of capital has buoyed both equities and precious metals, as investors seek to capitalize on returns while also hedging against inflation.
Rising inflation expectations have played a crucial role in this market behavior. Concerns over inflation have prompted investors to flock to safe-haven assets like gold and silver, which traditionally hold value during economic turbulence. Additionally, industrial metals such as copper and platinum have seen increased demand due to their essential roles in various industries. Low interest rates have further amplified this trend by reducing the opportunity cost of holding non-yielding assets like precious metals and encouraging borrowing and investment in both equities and industrial activities.
Other contributing factors include a weaker US dollar, which has made commodities priced in dollars more attractive to foreign buyers, and ongoing supply chain disruptions, which have constrained the supply of key metals, driving their prices higher. Technological advancements and the push towards renewable energy have also spurred demand for metals like copper, silver, and platinum. Furthermore, geopolitical uncertainty has heightened the appeal of safe-haven assets, while strong industrial activity and infrastructure investments have bolstered demand for industrial metals. Positive market sentiment, driven by robust corporate earnings and economic recovery prospects, along with investors’ efforts to diversify their portfolios and hedge against market volatility, has collectively led to this unprecedented market environment where both stocks and commodities are thriving.
My hope is that while we live in a dollar centric world this analysis will spark a desire to measure your wealth in other real assets like ounces of gold or silver.
In this asset study we will focus the artificial intelligence analysis, specifically on Silver. The chart below is why this is very timely.
In this stock study we will look at the following metrics and indicators.
1) Supply and Demand Fundamentals
2) 52-week high and low boundaries
3) The Best Case – Worst Case Scenarios
4) FB Finance Institute A.I. Predictive Blue Line Analysis
5) Neural Network Forecast
6) Daily Range Forecast
7) Intermarket Analysis
8) Our trading suggestion
Supply and Demand Fundamentals
A fundamental analyst looks at the balance between how much silver is being produced and how much is being used to predict if the price will go up, down, or stay the same. They examine factors like mining output, recycling rates, and inventory levels for supply, and industrial use, jewelry, and investment demand for demand. They also consider economic indicators like inflation and interest rates, geopolitical events that might disrupt supply or boost demand, and overall market sentiment. If production is low and demand is high, prices are expected to rise. If there’s more silver than needed, prices may fall, and if supply and demand are balanced, prices might stay stable.
The following table shows the supply and demand fundamentals of Silver for the last decade, along with the average price for each year.
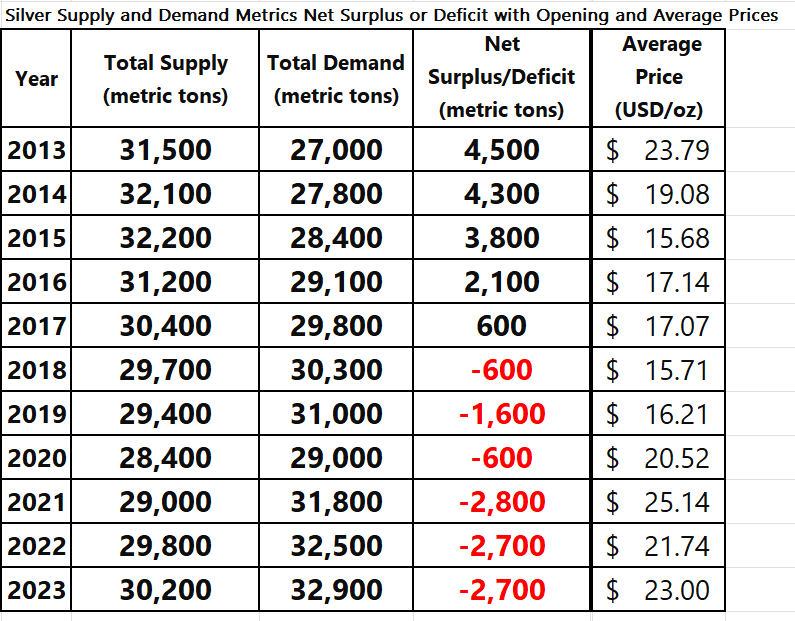
Notice how these metrics claim that there has been a net deficit in Silver for the last 6 years.
Traditional economic theory teaches us, when the demand for something is much higher than the supply, prices usually go up because people are willing to pay more to get it. This can lead to shortages where it’s hard to find the product. Higher prices encourage producers to make more, and people might look for alternatives. Sometimes, new technologies or ways to use less of the product are developed.
The bottom line is that Silver has been running at a deficit for the last 6 years. Fundamentally this is very bullish for the market.
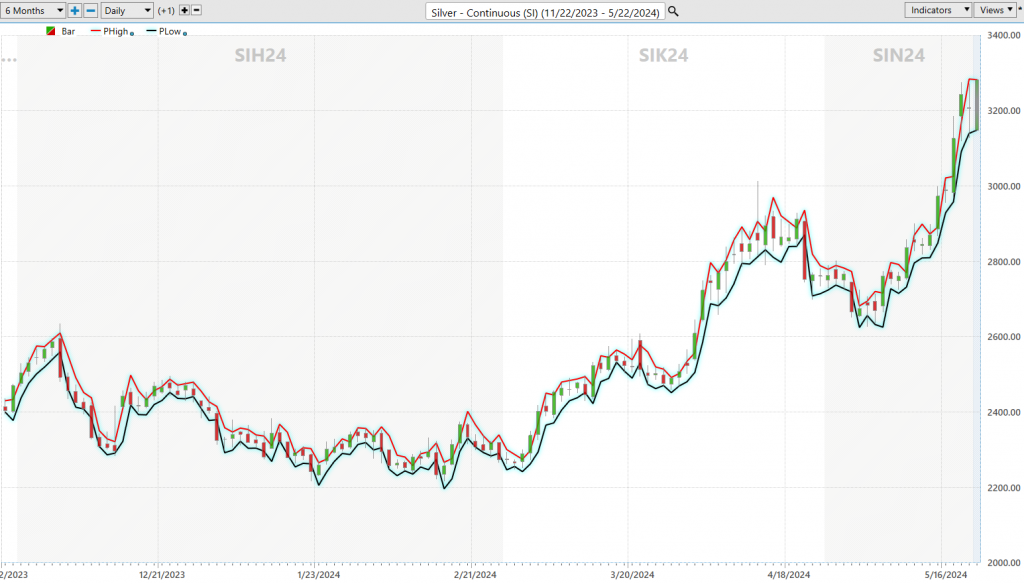
52-week high and low boundaries
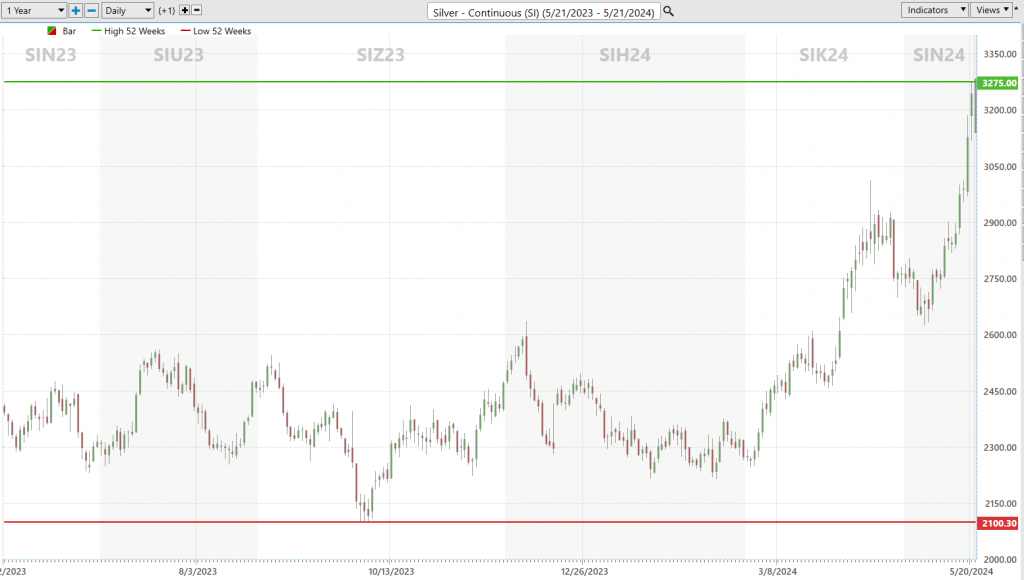
Over the last 52 weeks Silver has traded as high as $32.75 and as low as $21.00
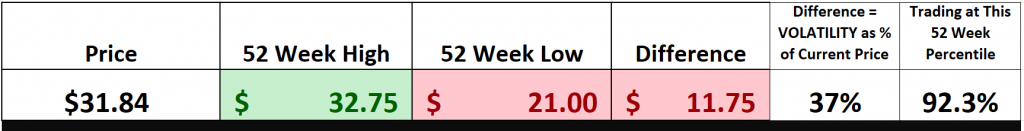
When we look at these metrics, we pay attention to the variance between the 52-week high and the 52-week low as it is often a very good indicator of expected future volatility.
We can verify this by simply zooming out to analyze a 52-week chart.
The Best Case – Worst Case Scenarios
Creating a best-case and worst-case analysis of risk and reward for Silver ($SI) over the past year involves a thorough review of its price movements to develop a realistic perspective on potential outcomes. This analysis, termed “Sunshine and Storm” or “Feast and Famine,” is essential for any trader looking to gain a clear understanding of both the optimistic scenarios and possible pitfalls.
**Best-Case Scenario**: This involves identifying the strongest SILVER ($SI) rallies reached in the past year.
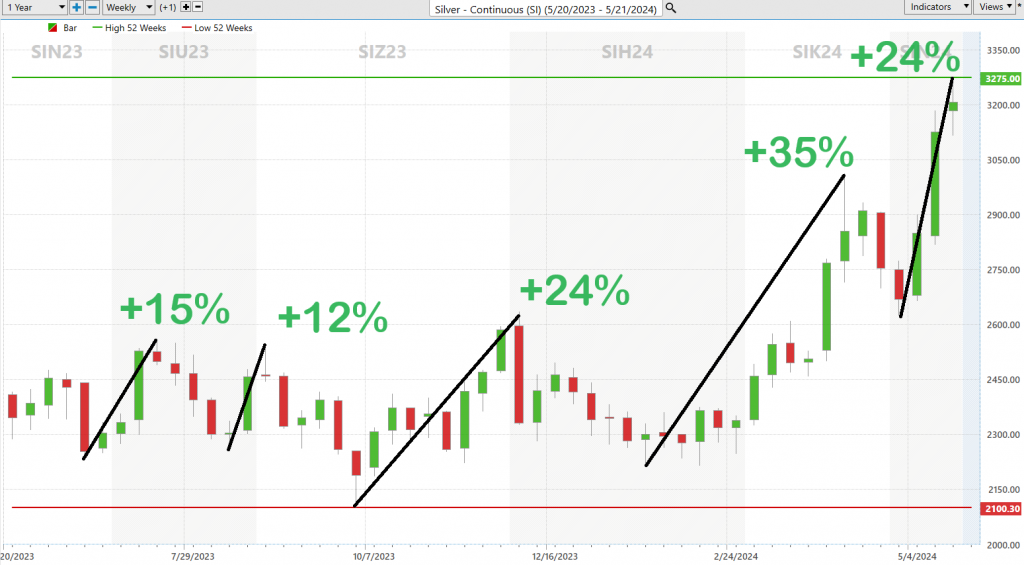
**Worst-Case Scenario**: Conversely, this scenario focuses on the worst declines that Silver reached during the last 52 weeks.
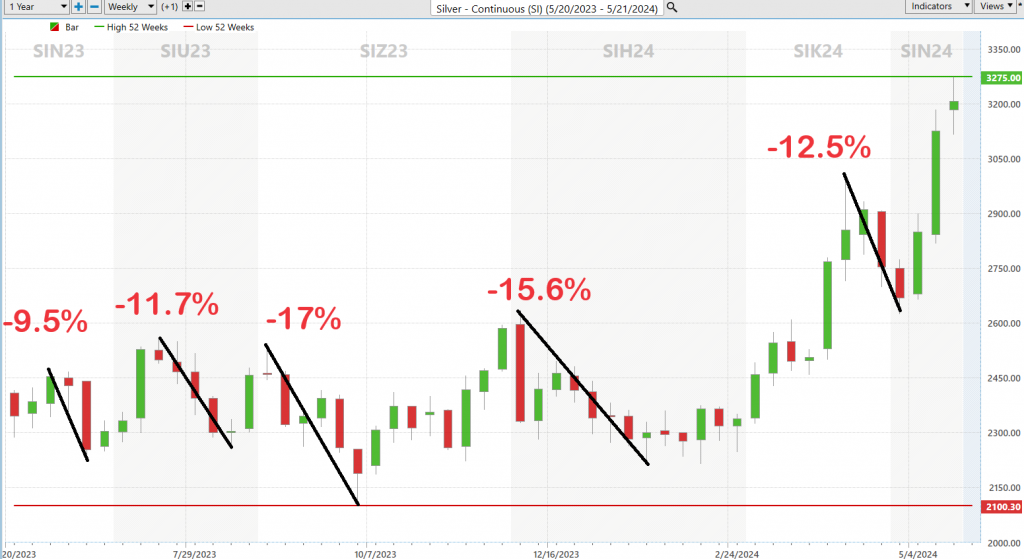
This simple approach allows traders to quickly understand the potential risk and reward of trading $SI moving forward.
Traders aiming for success in the markets must cultivate an objective understanding of risk and reward, a fundamental aspect of savvy trading. A practical approach to this is analyzing Silver ($SI)’s past year’s performance, comparing the scale of its rallies to its declines. Such an exercise not only acquaints one with the typical price actions and volatility of $SI but also is indispensable in forming a realistic view of potential risks.
By undertaking this simple and practical analysis, traders not only prepare for the brightest days but also brace for potential storms. This clear-eyed assessment helps tailor investment strategies that align with one’s financial thresholds and risk appetite, thereby ensuring that decisions are both informed and personalized.
Next, we compare Silver to the S&P 500 Index as well as to 5 of the leading silver mining companies to get the big picture of how Silver has performed over multiple time frames.
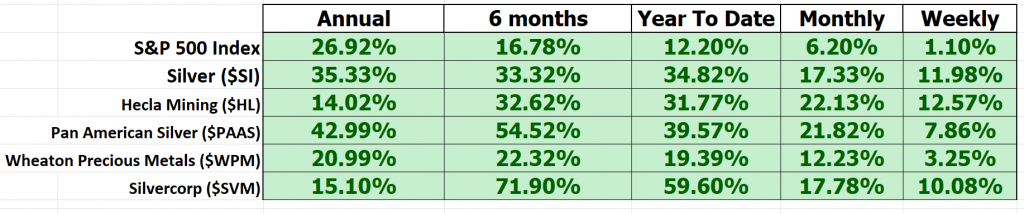
Study these comparison metrics and you will agree that Silver has been a sleeper trend over the past year. It is outperforming the S&P 500 across all time frames. Meanwhile the Silver mining companies are playing catch-up to the metals performance. The Silver miners collectively are underperforming the S&P 500 over the last year but outperforming the broader market across all other time frames.
This sort of analysis can be critical. It empowers you to navigate the trading landscape not just with data, but with insight, confidence, and the precision of a seasoned trader.
FB Finance Institute A.I. Predictive Blue Line Analysis
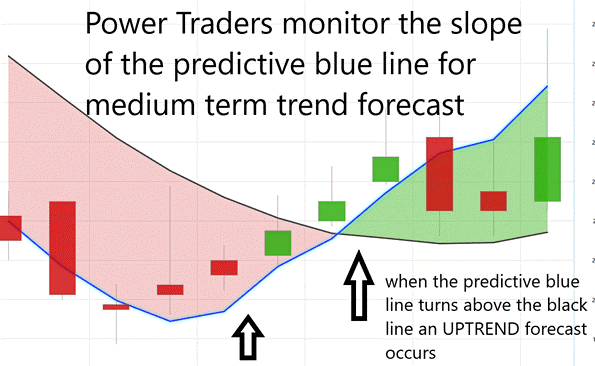
Our guiding principles are as follows:
– The trajectory of the predictive blue line dictates the trend forecast and overall trajectory of Silver ($SI).
– Ideally, the VALUE ZONE is determined to seek buying opportunities at or below the predictive blue line or selling opportunities above it during a downtrend.
– Naturally, as the predictive blue line slopes downward, traders anticipate lower prices, either retreating to the sidelines or hedging their positions .
In trading, the quest for cutting-edge tools is relentless. FB Finance Institute Software emerges as a leader in the fintech space, utilizing artificial intelligence to predict market trends. It introduces the “A.I. predictive blue line,” serving as a financial guidepost, offering traders insights into market directions, and pinpointing the ‘value zone’ for prime trading decisions. This innovative tool, fueled by neural networks and intermarket analysis, digs deep into the factors that determine prices, revealing the true value of assets and informing strategic trading decisions.
The role of FB Finance Institute’s predictive blue line goes beyond just indicating market direction; it directs traders to the ‘value zone,’ an essential area in an uptrend that highlights a stock’s real value. This isn’t just speculation; it’s the result of advanced A.I. that combines neural networks with intermarket analysis to uncover underlying values.
Additionally, the black line, which reflects the 10-day simple moving average, provides a historical context of recent price actions, enhancing the predictive power of the blue line. The interplay between these lines, merging past and future data, crystallizes trading opportunities, showcasing FB Finance Institute’s groundbreaking integration of neural network technology and market analysis for those navigating the swift currents of the financial markets.
In summary, a quick look at the chart with FB Finance Institute’s AI at work offers a clear forecast, arming traders with essential insights into market trends.
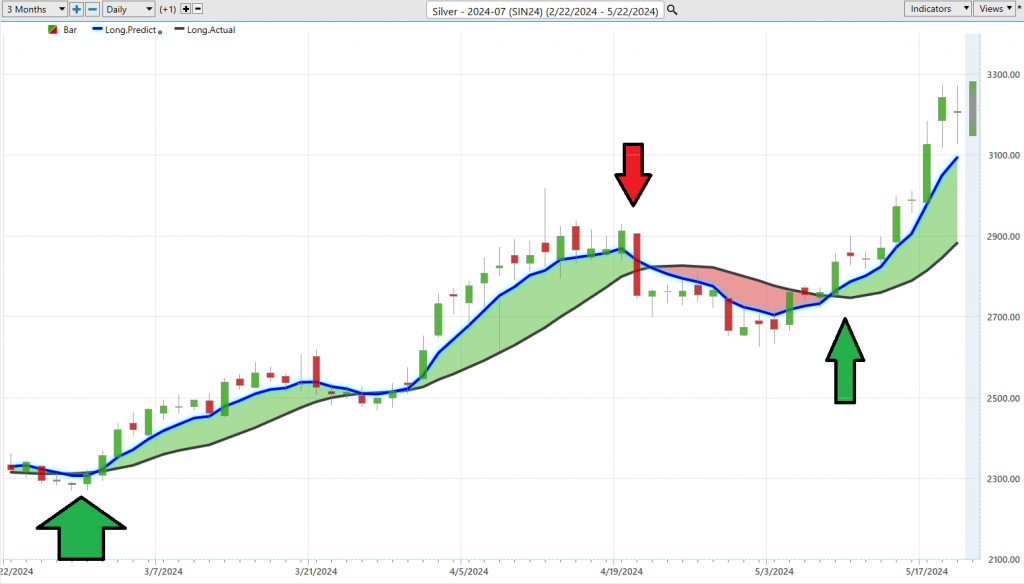
FB Finance Institute A.I. Neural Network Forecast
The neural index is a game-changer, fundamentally transforming how traders make decisions. Powered by advanced neural network technology, this index sifts through massive amounts of market data to forecast short-term movements over the next 48 to 72 hours. Instead of merely reacting to the market, traders can use the neural index to anticipate its next move, giving them a strategic edge. Its integration into trading platforms enhances a trader’s ability to time their trades with precision, optimizing entry and exit points. When combined with traditional market analysis tools, the neural index offers traders a richer understanding of market dynamics, boosting their strategic decisions and potentially increasing profitability in a fast-paced trading environment.
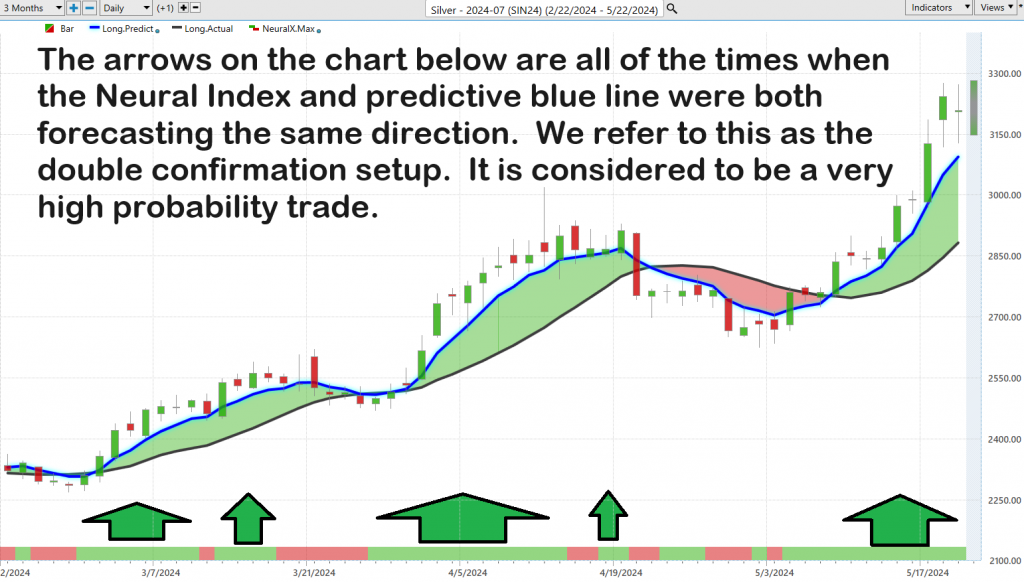
Check out the chart: every arrow marks a moment when the Neural Index and the predictive blue line pointed in the same direction. These high-probability trades are what we call the double confirmation setup. This setup is all about enhancing your confidence and precision in trading decisions.
FB Finance Institute A.I. Daily Range Forecast
Every short-term trader knows the drill—timing is everything when it comes to jumping in and out of the market. In this high-octane trading environment, being even a fraction of a second ahead can be the difference between banking a profit or taking a hit. Now, imagine unleashing the power of AI, machine learning, and neural networks. These aren’t just buzzwords; they’re game changers, slicing through historical data, spotting patterns, and predicting market moves with stunning precision. This is where trading transcends traditional analysis—it becomes a strategic edge, turning unpredictable market waves into navigable waters and setting the stage for sharp, informed trading maneuvers. It’s about illuminating the unseen, transforming raw risk into a finely tuned strategy.
But let’s get real about the everyday grind—consider the average trading ranges—daily, weekly, monthly—over the last year.
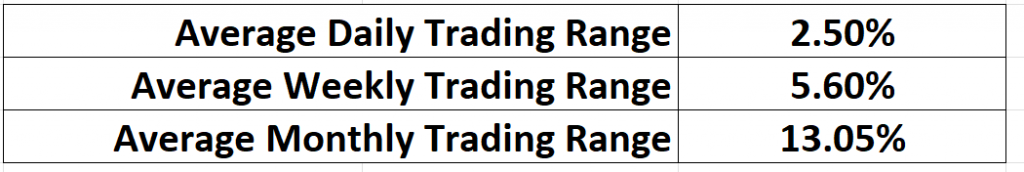
Here’s the kicker: knowing these ranges isn’t the end game. The real deal is pinpointing those critical price levels for buying and selling. Enter the Daily Range Forecast chart, a modern-day tool for the agile short-term swing trader. This chart isn’t just another piece of the puzzle; it’s the map that reveals the probable path for each trading day. Armed with FB Finance Institute A.I., this tool goes beyond old-school methods, tapping into the market’s very heartbeat. It’s a lifeline for Power Traders, allowing them to cut through market noise with extraordinary precision, spotting the best spots to enter and exit with crystal clear clarity.
Observe how clearly the trend is delineated!
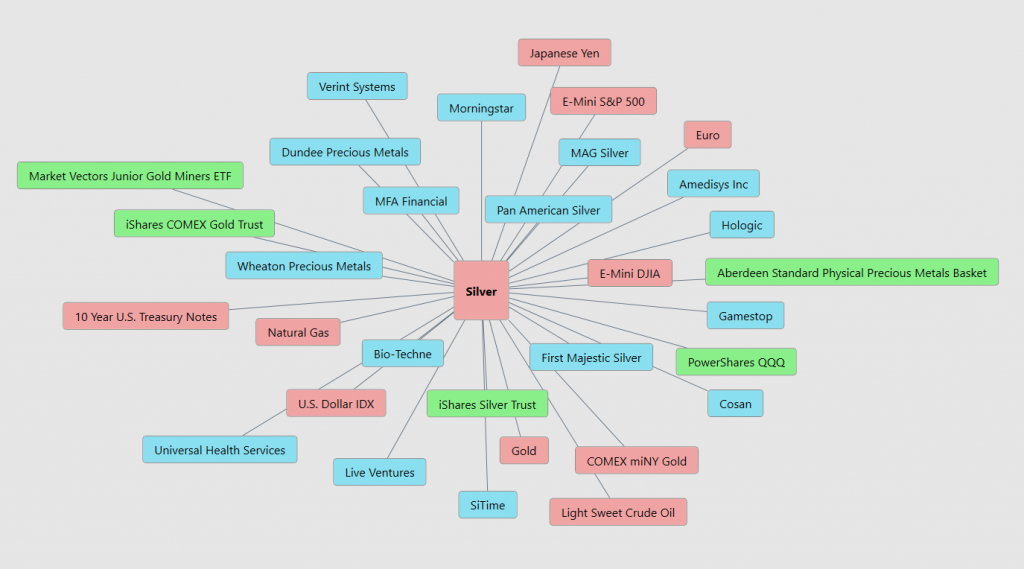
Intermarket Analysis
The bullish outlook for silver hinges on growing industrial demand from green technologies, increased investment as a hedge against inflation, a weakening US dollar, and low interest rates, all of which support higher prices amid supply constraints from mining disruptions. Conversely, the bearish outlook is based on a strong economic recovery that reduces safe-haven demand, a stronger US dollar, rising interest rates, and potential oversupply due to increased production and recycling, which could drive prices down. Both perspectives consider key economic factors that influence silver’s market dynamics. These are the prevailing theories that try and explain the price action in the silver market today.
Intermarket analysis is a method of evaluating the relationships between different financial markets to understand the broader economic environment and its impact on specific assets like silver. It involves analyzing correlations between silver prices and other markets such as currencies, bonds, equities, and other commodities. By understanding these interconnections, traders can gain insights into how movements in one market can influence silver prices.
To fine-tune prevailing theories on silver’s price action, traders can use intermarket analysis to cross-reference the 31 key price drivers of silver. These drivers might include the US dollar index, interest rates, gold prices, industrial metals like copper, crude oil prices, and stock market indices. For example, a weakening US dollar generally supports higher silver prices because it makes silver cheaper for foreign buyers. Conversely, rising interest rates can pressure silver prices by increasing the opportunity cost of holding non-yielding assets.
Traders use intermarket analysis to better their decision-making process by identifying trends and potential turning points in silver prices based on the behavior of these key drivers. For instance, if industrial metals like copper are trending upwards due to increased industrial activity, it might signal stronger demand for silver as well. Additionally, if bond yields rise, indicating higher interest rates, traders might anticipate downward pressure on silver and adjust their positions accordingly.
By incorporating intermarket analysis, traders can validate or challenge their theories about silver’s price action. They can observe how these key drivers interact with each other and with silver prices, allowing for more informed and strategic trading decisions. This comprehensive approach helps traders anticipate market movements more accurately and enhances their ability to manage risks and capitalize on opportunities.
Our Suggestion
When silver outperforms the S&P 500, it often signals significant market shifts and creates financial fireworks that captivate traders and investors alike. Such outperformance can indicate a surge in safe-haven demand, heightened economic uncertainty, or substantial industrial demand, all of which drive silver prices higher relative to equities. This dynamic can lead to notable volatility and trading opportunities, as market participants react to the changing landscape by reallocating assets. The impressive rallies in silver prices can sometimes overshadow those in traditional stock markets, showcasing the metal’s unique role in the financial ecosystem.
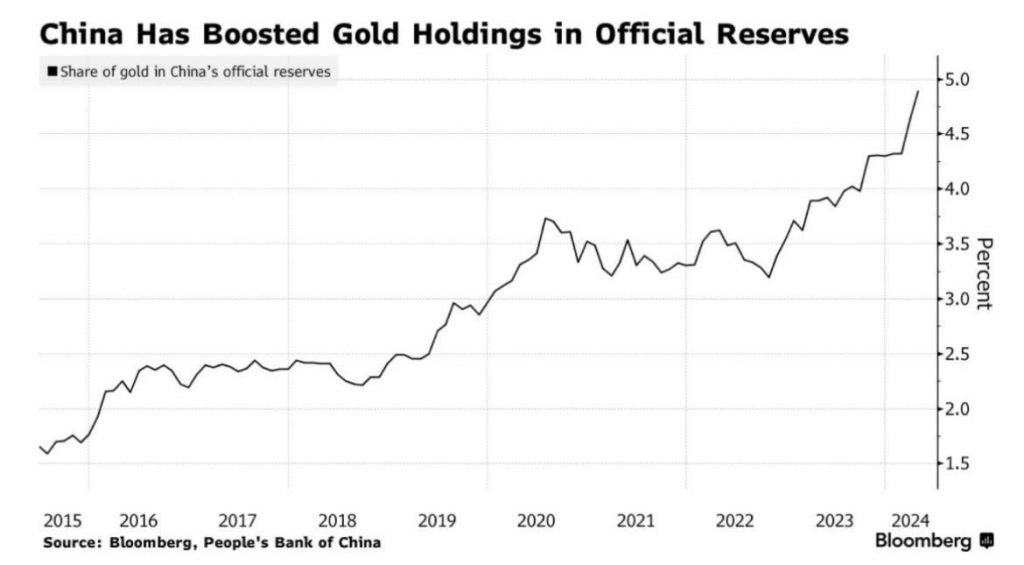
While it is challenging to pinpoint a single fundamental driver behind recent price actions, one plausible clue is China’s aggressive accumulation of precious metals for its reserves. China’s strategic move to bolster its holdings, including silver, has likely contributed to the upward pressure on prices. Silver, often referred to as the “poor man’s gold,” benefits from such actions as it becomes more attractive to investors seeking lower-cost alternatives to gold. This behavior underscores silver’s dual appeal as both an industrial metal and a store of value, reinforcing its potential for dramatic price movements and offering a fascinating narrative in the broader financial market dynamics.
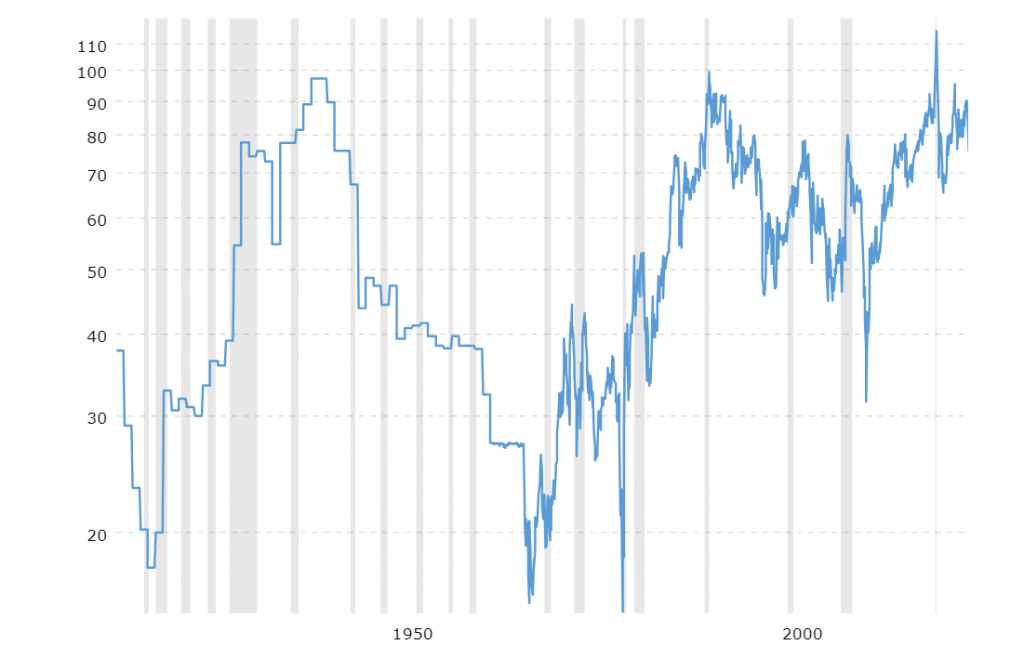
One fascinating statistic which is worth pondering is the price relationship between silver and gold historically.
In 1980 when the precious metals had their massive rally the price of Silver peaked at $50 while the price of Gold ran to $800. Silver is the only precious metal which has not passed its 1980 peaks. As a matter of fact, it is down 40% from those highs while the rest of the precious metals complex has rallied 200%.
Also consider the gold/silver ratio. Currently it is trading at roughly 75 to 1 which historically is very high. Meaning that silver is very much undervalued by this metric. In 1980 the gold/silver ratio was roughly 16.
We think Silver is just getting started.
The opportunity is Silver looks even brighter when you look at it from a non-dollar centric perspective.
We advise that you rely upon the ai forecast for further trend analysis in validating this trading opportunity.
Practice good money management on all of your trades.
Let’s Be Careful Out There!
It’s not magic.
It’s machine learning.
Disclaimer: THERE IS A HIGH DEGREE OF RISK INVOLVED IN TRADING. IT IS NOT PRUDENT OR ADVISABLE TO MAKE TRADING DECISIONS THAT ARE BEYOND YOUR FINANCIAL MEANS OR INVOLVE TRADING CAPITAL THAT YOU ARE NOT WILLING AND CAPABLE OF LOSING.
FB Finance Institute’S MARKETING CAMPAIGNS, OF ANY KIND, DO NOT CONSTITUTE TRADING ADVICE OR AN ENDORSEMENT OR RECOMMENDATION BY AI Financial Genie 4.0 OR ANY ASSOCIATED AFFILIATES OF ANY TRADING METHODS, PROGRAMS, SYSTEMS OR ROUTINES. FB Finance Institute’S PERSONNEL ARE NOT LICENSED BROKERS OR ADVISORS AND DO NOT OFFER TRADING ADVICE.