| This week’s a.i. Stock Spotlight is Microsoft ($MSFT) |

Microsoft is a multinational technology company that develops, manufactures, licenses, supports, and sells a wide range of software products and services. It’s best-known software products include the Microsoft Windows line of operating systems, the Microsoft Office suite, and Internet Explorer and Edge web browsers. Microsoft also offers a wide range of services, including cloud computing, data storage, and enterprise software.
Microsoft’s products and services can be broadly categorized into the following areas: Operating systems, Office productivity software, Web browsers, Cloud computing, Data storage, and Enterprise software. It also owns numerous gaming software platforms and brands through the XBOX studio suite.
To comprehend Microsoft, we need to Rewind to 1975, the dawn of the personal computing era. Enter Bill Gates and Paul Allen, two young trailblazers who set forth to reshape the tech landscape. Their groundbreaking idea? Separating software from hardware. This radical thought laid the foundation for Microsoft, a company that would soon lead the tech race, not just partake in it.
Bill Gates, a maestro of strategy, known for his almost military-like approach, didn’t just respond to the market trends; he was ahead of them. His ability to foresee and shape technological shifts set Microsoft on a path of dominance. Alongside him, Paul Allen, a programming virtuoso, whose work on the BASIC interpreter for the Altair 8800 not only established Microsoft’s software prowess but also signaled a new era in personal computing.
Microsoft, headquartered in Redmond, Washington, quickly expanded its empire. Beyond the well-known Windows and Office suite, it ventured into cloud computing with Azure, and gaming with Xbox. But it’s not just about diversification; it’s about vision. Gates’s deep understanding of the competition, often better than they knew themselves, became Microsoft’s strategic edge.
As the company evolved, it didn’t just follow the tech industry; it often steered its direction. Microsoft’s resilience and adaptability were on full display as it embraced cloud computing, under the stewardship of leaders like Steve Ballmer and Satya Nadella, transitioning from a software-centric entity to a cloud computing juggernaut.
Investors take note: Microsoft’s stability and growth, underscored by its shrewd acquisition strategy, solid market capitalization, and consistent stock performance, speak volumes. The company’s balance of profitability with continuous innovation is a rare corporate feat.
If you had invested $1,000 in Microsoft ($MSFT) when it first went public on March 13, 1986, and held onto your shares until today, your investment would be worth approximately **$5,180,227.20** as of November 29, 2023.
Here’s the breakdown of the calculation:
* **Initial investment:** $1,000
* **Number of shares purchased:** $1,000 ÷ $21 per share = 47 shares
* **Stock splits:** Microsoft has had nine stock splits since its IPO:
2-for-1 on September 21, 1987
2-for-1 on April 16, 1990
1.5-for-1 on June 27, 1991
1.5-for-1 on June 15, 1992
2-for-1 on May 23, 1994
2-for-1 on December 9, 1996
2-for-1 on February 23, 1998
2-for-1 on March 29, 1999
2-for-1 on February 18, 2003
Adjusted number of shares = 47 shares × 2 × 2 × 1.5 × 1.5 × 2 × 2 × 2× 2 × 2
= 13,536 shares
* **Current share price:** $382.70 per share (as of November 29, 2023)
* **Total value of investment:**
13,536 shares × $382.70 per share = $5,180,227.20.
Please understand that this calculation assumes that you held onto your shares for the entire period and did not sell any at any point. This growth and metric explains why Microsoft has become a leader in the tech space and one of the largest companies as measured by market capitalization.
Today, as we observe Microsoft, with its 181,000 employees and a commanding position in cloud computing, its story is one of relentless innovation and astute strategic planning. This narrative is a testament to the power of visionary leadership and strategic agility, a blueprint for success in the turbulent tech industry.
In essence, Microsoft’s journey from a garage startup to a global tech titan is a lesson in strategic vision, adaptability, and the unwavering pursuit of innovation. For traders and investors alike, it’s a story that not only shaped the tech industry but also offers key insights into the world of technology and investment.
In the world of Wall Street analysis, Microsoft Corporation ($MSFT) stands out for its compelling fundamental metrics, underscoring why analysts are bullish on the company’s prospects. A critical highlight is its Price-To-Earnings (P/E) ratio of 36.9x, notably below the software industry average of 46.5x, indicating a more attractive valuation relative to its peers. This is complemented by robust earnings forecasts, with an anticipated growth rate of 12.21% per year. Furthermore, the company’s track record of earnings growth is impressive, having expanded at an annual rate of 18.4% over the past five years. These metrics collectively paint a picture of a company not just maintaining financial health but also poised for continued growth, a fact that has not gone unnoticed by analysts and investors alike.
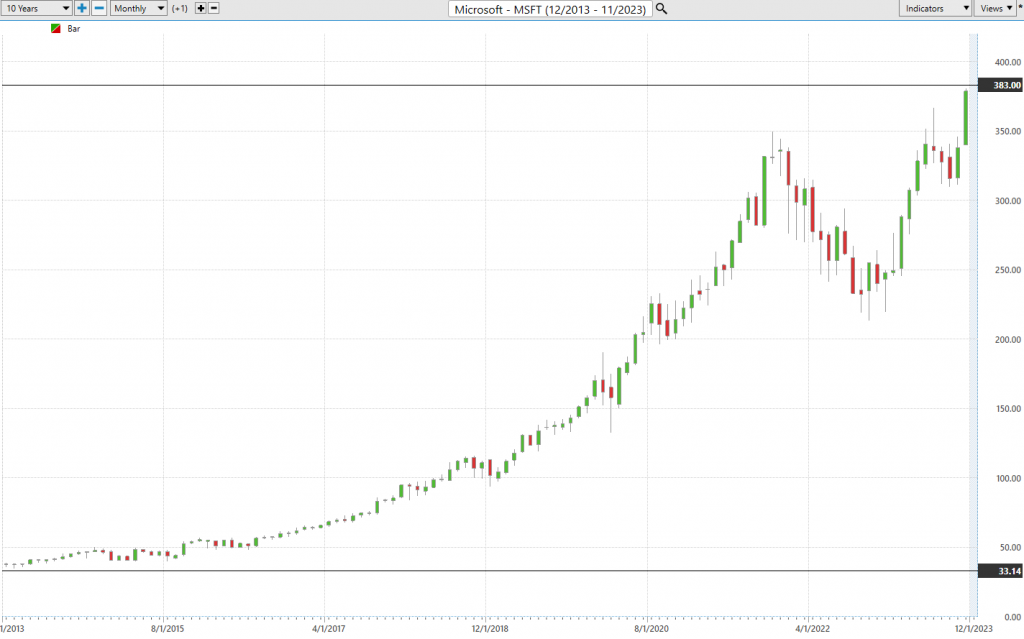
With Microsoft ($MSFT) as one of the key players in the artificial intelligence race, it is worthy of every investor and traders time to put this company on your trading radar. For the past several weeks $MSFT has entered a favorite setup. It’s simultaneously making 10 year and 52-week highs. Whenever this occurs in an asset it is an indication that the company is overcoming all barriers to growth.
In this weekly stock study, we will look at and analyze the following indicators and metrics as are our guidelines which dictate our behavior in deciding whether to buy, sell, or stand aside on a particular stock.
- Wall Street Analysts’ Estimates
- 52-week high and low boundaries
- Best Case – Worst Case Analysis and Takeaways
- FB Finance Institute A.I. Forecast (Predictive Blue Line)
- Neural Network Forecast
- FB Finance Institute A.I. Daily Range Forecast
- Intermarket Analysis
- Our trading suggestion
We don’t base our trading decisions on things like earnings or fundamental cash flow valuations. However, we do look at them to better understand the financial landscape that a company is operating under.
Wall Street Analysts’ Estimates
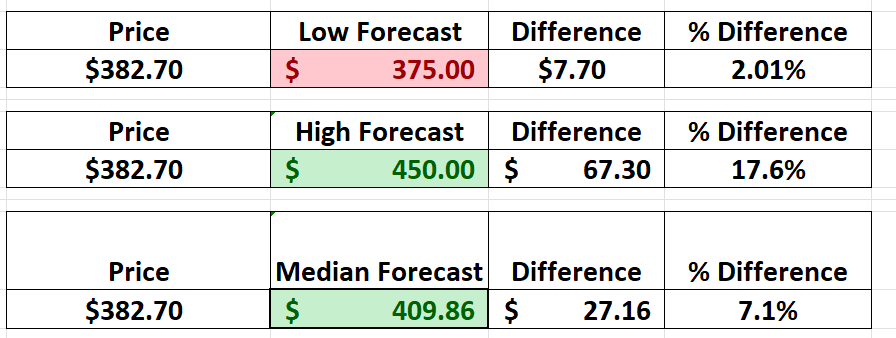
Based on 34 Wall Street analysts offering 12-month price targets for Microsoft in the last 3 months. The average price target is $409.86 with a high forecast of $450.00 and a low forecast of $375.00. The average price target represents a 7.66% change from the last price of $382.70.
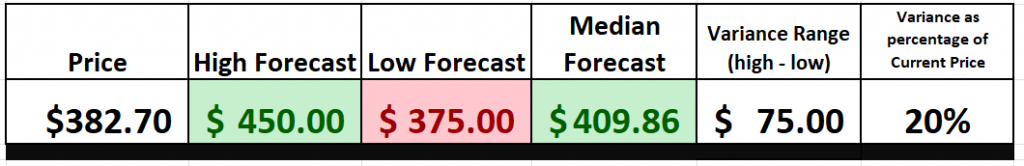
We focus our attention on the variance between the high forecast and the low forecast which is $75 and represents a difference of 20% in price perspective. The larger the variance the larger the volatility that a company will exhibit and the greater the trading opportunity.
There are several perspectives that are very enticing to traders and investors. First and foremost is that Wall Street analysts have aggressively been upgrading their price targets on $MSFT over the past few weeks. This implies an extremely bullish and optimistic environment.
Also observe that the most bearish 12-month forecast represents a 2.01% decline from its most recent close. Meanwhile, the most optimistic forecast of $450 represents a 17.6% potential upside. This backdrop creates an extremely favorite risk/reward profile from Wall Street analysts.
It is important to acknowledge that this favorable environment does not guarantee that Wall Street analysts will be correct in their evaluations. It simply highlights how favorable the financial landscape is looking for $MSFT according to Wall Street analysts.
52-Week High and Low Boundaries
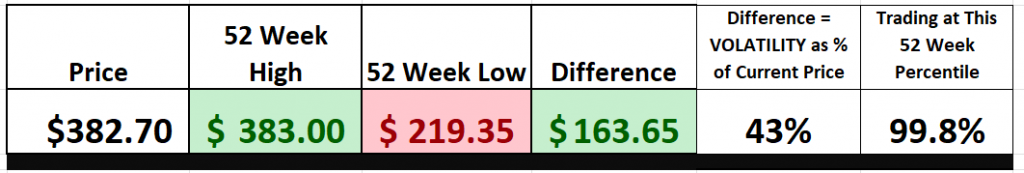
Over the last 52 weeks, $MSFT has traded as high as $383 and as low as $219.35. From this very simple but practical analysis we subtract the annual low price ($219.35) from the high price ($38) to calculate the difference (163.65). When we divide the difference (163.65) by the current price (382.70) this is a broad-based measure of volatility and tells us that it would be perfectly normal to expect $MSFT to trade as much as 43% higher and or lower over the coming 52 weeks.
In today’s deep dive on $MSFT, we’re putting the spotlight on a crucial aspect of trading – understanding the significance of the 52-week high and low boundaries. These metrics are not just numbers; they are pivotal indicators that traders and investors watch like hawks. Here’s why:
First up, let’s talk about the psychological impact. The 52-week high is like a ceiling that a stock has hit in the past year. Breaking through this barrier isn’t just a numerical change; it’s a signal of shifting investor sentiment, potentially sparking a bullish charge in the stock.
Now, let’s consider trend continuation and reversals. When Microsoft, or any stock for that matter, pushes past its 52-week high and stays there, it’s not just breaking a record. It’s a clear indication that the bears are out, and the bulls are in control, potentially flipping the script from a downward to an upward trajectory.
But it’s not just about breaking records; it’s about momentum. A surge past the 52-week high often comes with a spike in trading volume, a tell-tale sign that more investors are joining the rally, bolstering the stock’s upward march.
Then there’s the target setting. The 52-week high becomes a beacon for traders, a level they aim to hit and surpass, driving forward the stock’s upward momentum.
Let’s not forget risk management. This metric isn’t just about chasing highs; it’s a crucial tool in limiting losses. Setting stop-loss orders below the previous 52-week high can be a savvy move to safeguard against unexpected downturns.
Comparative analysis also comes into play here. By looking at how stocks stack up against their 52-week highs, traders can get a sense of their relative strength and momentum, crucial for making informed decisions.
Lastly, for those crafting trading strategies, the 52-week high is a cornerstone. Whether it’s breakout, momentum, or trend-following, this metric is a key piece of the puzzle.
In sum, the 52-week high and low are much more than just boundaries. They’re indicators of market sentiment, momentum, and potential turning points, vital for anyone looking to make strategic moves in the market, especially with stocks as dynamic as Microsoft. Keep your eyes on these levels; they could be the key to your next successful trade.
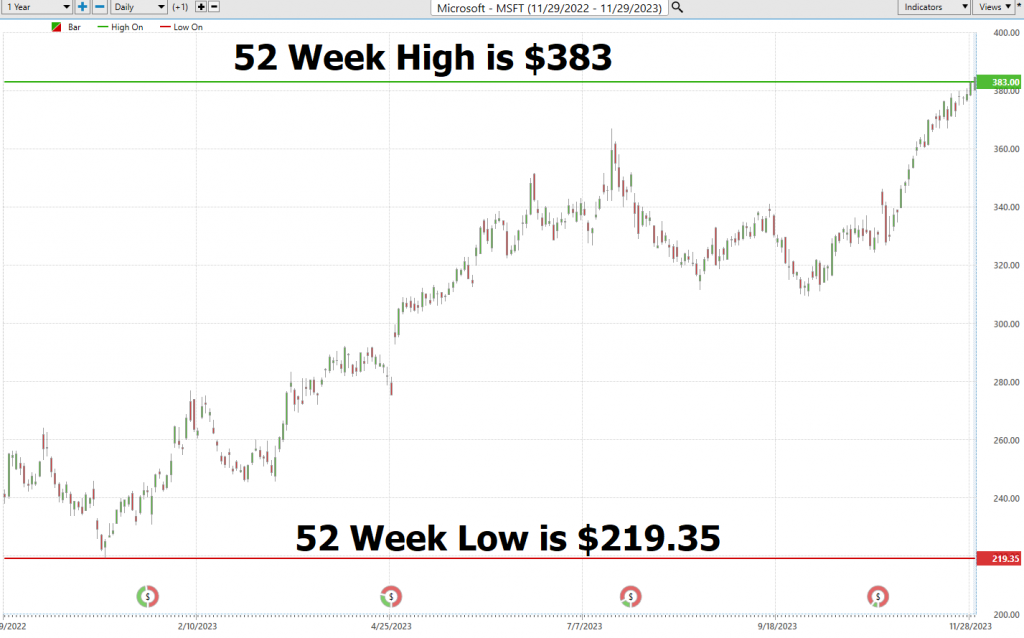
Lastly, we zoom out to a longer-term chart to better understand the trajectory the stock has been on. This is also where we can observe that $MSFT is simultaneously making 10 year and 52-week highs. This is a clear indication the company is overcoming all barriers to growth.
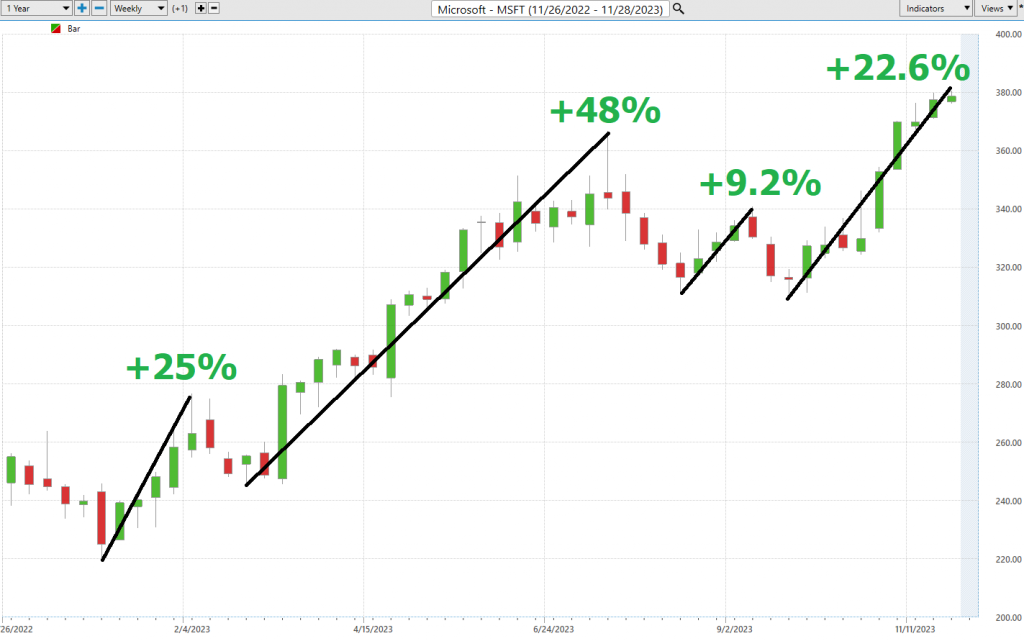
Best Case – Worst Case Scenario
In the dynamic world of trading, where each decision carries weight, approaching the market demands a strategy as precise and calculated as that of a General overseeing the battlefield. For those in the trenches of trading and investing, it’s essential to operate with a mindset that melds calculated optimism with a clear understanding of real-world implications, always weighing the delicate balance of risk and reward.
Imagine you’re peering through two sets of binoculars, each offering a unique AI Financial Genie 4.0 of the terrain ahead. This symbolizes the essence of in-depth market analysis. You might wonder, why is such a dual-focused approach pivotal? The reason is straightforward. By examining both the potential highs and the inevitable lows, you arm yourself with a comprehensive view of a stock’s trajectory and potential. This approach isn’t just about chasing the allure of profit; it’s about a judicious appraisal of the risks that may cast shadows on your path. Adopting this dual-vision strategy is fundamental in understanding the volatility of an asset, acting as your guide through the unpredictable waves of the stock market.
This isn’t mere speculation; it’s about plotting a course with deliberate intention. It involves fine-tuning your market exposure, recognizing the moments to stand your ground, and identifying when a strategic shift is necessary. This is about discerning the intrinsic value of a stock, looking beyond its superficial appeal.
In the vast landscape of the market, this methodology is more than a mere tactic – it’s a philosophical approach. It’s about achieving equilibrium between the scales of risk and reward, ensuring that your portfolio is not only fortified for the transient now but is also strategically aligned for lasting growth. The ultimate aim is to be ready for any scenario. In the arena of trading, knowledge isn’t just a form of power—it’s your map to navigate the intricate journey to prosperity.
First, we do the Best-Case analysis:
Followed by the WORST-CASE Analysis:
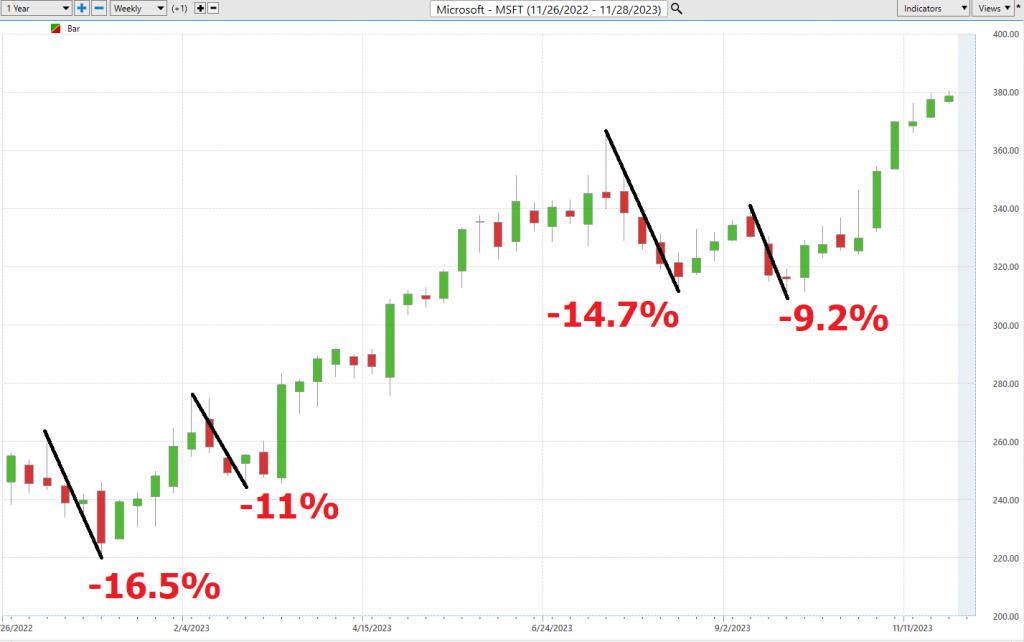
This initial analysis lets us see how quickly $MSFT falls in comparison to its rallies.
Next, we want to compare the performance of $MSFT to the major broad market indexes.
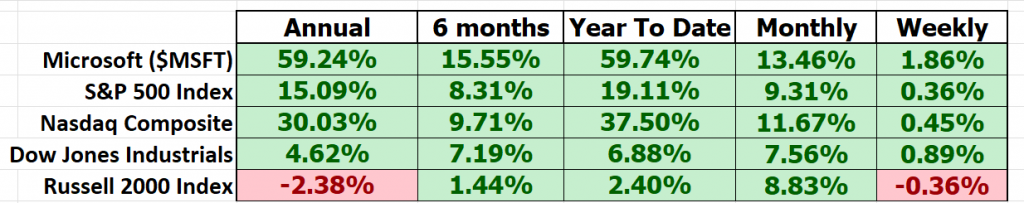
$MSFT, has been a standout performer, consistently outshining the broader market indices across all time frames. Its stellar performance warrants a closer look, particularly in terms of volatility and its comparison with market heavyweights. In the world of traders, this is often encapsulated by a metric known as “BETA.”
Amidst the frenetic trading floors of Wall Street, beta (β) reigns supreme, a financial barometer that serves as the Richter scale of the stock universe. This metric measures how sensitive a stock is to the broader market’s movements, akin to a seismograph capturing the earth’s tremors. Beta quantifies a stock’s susceptibility to the market’s ebbs and flows, typically benchmarked against a major index like the S&P 500.
Beta = 1: A Mirror of the Market’s Mood
Envision a stock with a beta of 1, mirroring the market’s movements with unwavering fidelity. When the market surges 5%, this stock, like a faithful dance partner, rises 5% in tandem, a testament to their perfect harmony.
Beta > 1: Embracing the Thrill Ride
Imagine a high-speed rollercoaster, it’s exhilarating yet nerve-wracking plunges and ascents. A beta exceeding 1, say 1.5, sends the stock on a thrilling ride, 50% more volatile than the market itself. When the market climbs 5%, this high-beta stock takes off on a heart-pounding 7.5% ascent (or descent, for that matter), a roller coaster of emotions.
Beta < 1: Stability Amidst the Chaos
Step into a tranquil meadow amidst the bustling stock market. A beta below 1, like 0.5, instills a sense of calm amidst the volatility. If the market enjoys a 5% ascent, this low-beta stock embarks on a more measured 2.5% rise, a serene stroll through the park amidst the market’s turbulence.
Now, let’s focus on Microsoft (MSFT), a company that has captivated the market with its innovative products. Over the 5-year horizon, MSFT exhibits a beta of 0.95, implying that it is 5% less volatile than the broader stock market. Yet, in spite of this lower volatility, it has massively outperformed both the S&P 500 and the NASDAQ composite.
MSFT’s low beta doesn’t mean it lacks growth potential. It’s a testament to the company’s resilience and ability to navigate market fluctuations. MSFT stands as a beacon of stability amidst the volatile stock market, offering investors a chance to ride the wave of growth without the rollercoaster of emotions.
Now, it’s important to understand that beta isn’t some kind of crystal ball guaranteeing investment success. It’s a tool, a vital one at that, used by investors to make more informed decisions, balancing the prospects of lucrative rewards against the risks that are part and parcel of the market.
Turning our attention to Microsoft, or $MSFT, we see a company that presents a potentially exciting but volatile opportunity for those who can stomach the ups and downs. This is a company with a unique suite of products and a robust track record of growth. But here’s the kicker: a high beta value, while promising high returns, also brings with it the specter of significant losses. It’s a double-edged sword.
So, where does that leave investors? It’s a choice, a crossroads if you will. Do you embrace the adrenaline rush of potentially high gains with $MSFT, or do you play it safe, looking for more stable ground? This decision is crucial and deeply personal for every investor/trader.
But let’s not forget beta, much like the Richter scale in seismology, remains a fundamental barometer in the stock market universe. It’s a measure that will continue to shape investment strategies and guide decisions. Whether you’re a thrill-seeker or a safety-first investor, understanding and respecting the role of beta is essential in navigating the often-turbulent waters of the stock market. Remember, knowledge is power, especially in the dynamic world of investing.
FB Finance Institute A.I. Predictive Blue Line Forecast
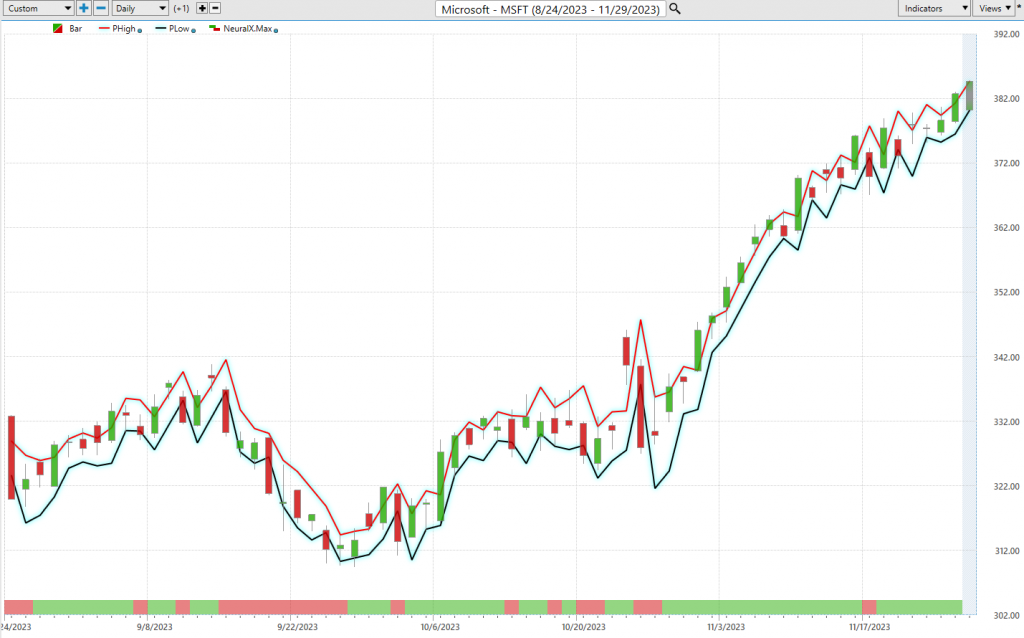
On the following chart you will see the power of the FB Finance Institute Predictive blue line which determines the medium-term trend price forecast.
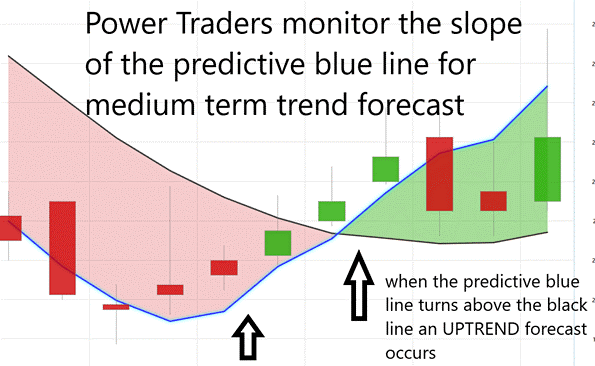
In the fast-paced, ever-evolving world of today’s market, traders are constantly on the lookout for the most effective tools and strategies to steer them through this intricate financial terrain. Enter FB Finance Institute Software, a trailblazer in the realm of artificial intelligence, offering traders a unique and precision-focused lens into risk and reward analysis. Its predictive blue line is at the heart of this innovation, a guiding light in forecasting market trends.
Picture this predictive blue line as your financial lighthouse, its slope a reliable indicator of market direction. When this line trends upward, it’s a clear signal of a rising market, opening the door for savvy buying opportunities. On the flip side, a downward slope points to a market on the decline, hinting at potential selling points.
But there’s more to this story. The predictive blue line also pinpoints the ‘value zone’ – a strategic sweet spot for traders. In an uptrend, this zone, marked just below the blue line, is where astute investors look to buy. It represents a critical convergence of price and intrinsic value, revealing the true worth of an asset.
This predictive tool isn’t just a shot in the dark. It’s the culmination of FB Finance Institute’s groundbreaking A.I. technology, a harmonious blend of neural networks and intermarket analysis. This potent combination dives deep, dissecting the key price drivers of an asset, leveraging A.I. to unveil its core value.
Alongside the predictive blue line, we also have the black line, a reflection of the recent past, essentially our market rearview mirror. It traces the 10-day moving average of prices, providing context to the blue line’s forward-looking insights. The interplay between these lines is where the magic happens, offering traders a clear view of market momentum and emerging opportunities.
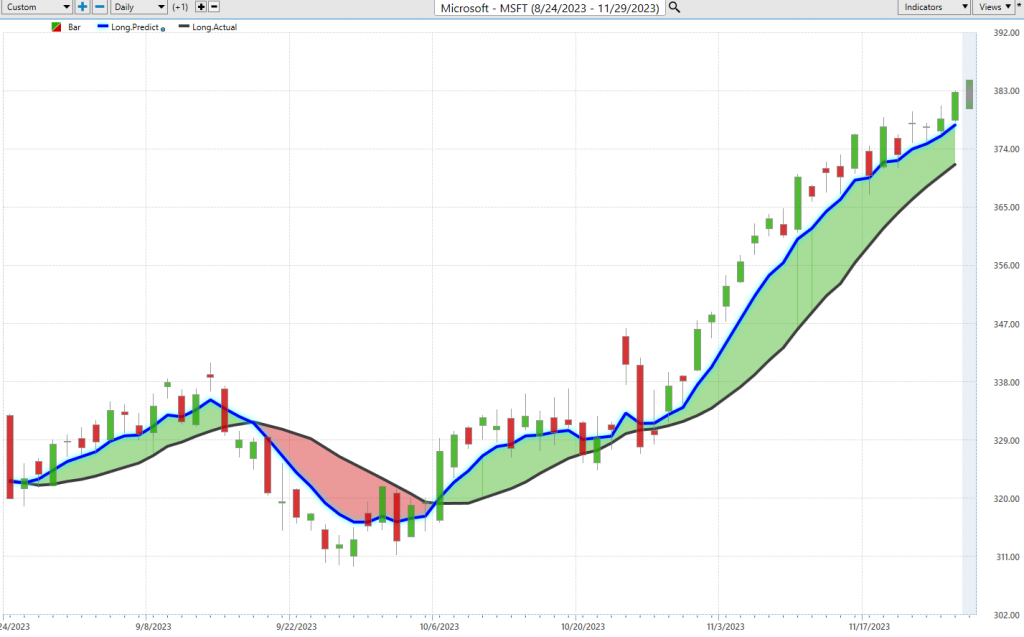
Here’s a key takeaway for traders: when the predictive blue line overtakes the black line, think of it as the market’s green light, signaling a prime entry point for an upward trend. This intersection of price and potential value is a clear indicator of an undervalued asset ready for a rise.
As you navigate the complexities of the market, keep a close eye on the predictive blue line. Understanding its dance with the black line can be your ticket to informed decision-making and successful trading. Stay sharp, stay ahead, and let FB Finance Institute Software be your compass in the dynamic world of trading.
Neural Network Indicator (Machine Learning)
At the very bottom of that chart, right there, you’ve got what we call the Neural Network Indicator. Now, this little gem right here, it’s like having a crystal ball for the market’s short-term moves. When that Neural Net Indicator goes green, well, it’s screaming strength. But when it goes all red on us, it’s sounding the alarm for short-term market weakness. And don’t forget about yellow – that’s the signal for sideways action, folks.
But what’s the secret sauce behind this Neural Net Indicator, you’re probably wondering? Well, let me tell you, it’s all about neural networks – these digital brains that are like the rock stars of the trading world. They’re equipped with all these fancy functions, crunching through mountains of data to give us traders the insights we crave. It’s like having the sharpest minds in the business, and they’re always getting better, always adapting.
These neural networks, inspired by the intricate workings of the human brain, are becoming the go-to tool for traders seeking an edge in the high-stakes world of finance.
Now, let’s break it down, shall we? How exactly are these neural networks for trading constructed? Well, it’s all about deep learning, a process that involves feeding massive amounts of financial data into these AI marvels. Then, we let them do what they do best: learn. They do this by adjusting the weights of their connections, just like our own brains do when we learn from experience. As these networks learn, they become masters at spotting complex patterns and making predictions about future price movements.
The benefits? Oh, they’re plenty. First off, we’re talking about improved accuracy. These neural networks can dissect data in ways that even the sharpest human minds can’t. They uncover hidden gems in the data, and that can translate into some big gains.
But that’s not all. Automation is another key perk. Imagine freeing up traders from the mundane task of making every trading decision. Neural networks can handle a lot of that heavy lifting, allowing traders to focus on more critical aspects of their craft, like research and analysis.
And let’s not forget about risk reduction. These networks are like market sentinels, tirelessly scanning for potential threats and opportunities. When they spot them, they alert the trader, helping to safeguard their hard-earned capital.
But how do these neural networks help traders make better decisions? Well, that’s where the magic happens. They’re like wizards of pattern recognition, spotting intricate patterns in the data that our human eyes might miss. This alone can be a game-changer for traders, guiding them on when to buy and sell securities.
Then there’s the predictive power. Neural networks can gaze into their digital algorithms and offer insights into future price movements. This kind of foresight can be the key to strategically positioning portfolios for maximum gains.
And once again, we can’t forget about risk. These networks are like your financial guardian angels, spotting potential risks and rewards in the market. Armed with this knowledge, traders can make more informed decisions and protect their investments.
In a nutshell, neural networks are the trader’s best friend, a high-tech ally that sharpens decision-making processes and leads to more profitable trades. It’s a brave new world, my friends, and these neural networks are at the forefront of it all. The future of trading is here, and it’s neural.
Now, here’s the golden rule for all you traders out there: confirmation is king. The real pros, the Power Traders, are checking that predictive blue line against our trusty Neural Network Indicator. When both of them are pointing in the same direction, that’s a clear-as-day signal. But if they’re both singing a cautionary tune, well, it’s time to take a step back and reevaluate your strategy.
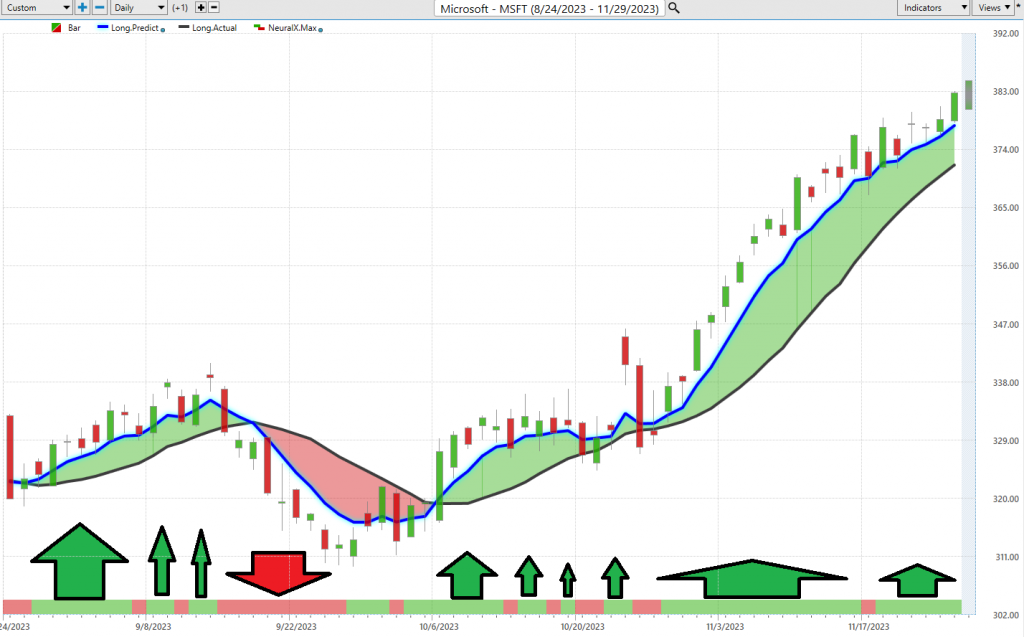
Now, take a look at this chart of $MSFT. See that Neural Index down there at the bottom? That’s your ticket to the future of trading, my friends. It’s uncovering insights that those old-school methods can only dream of. For you Power Traders, the combo of the Neural Network and A.I. forecasts, it’s like striking gold. When they align, it’s time to make your move. But when they’re going in different directions, proceed with caution. Remember, in trading, double-checking is the name of the game.
So, here’s my advice to all you Power Traders: harness the full potential of this tool. Cross-reference that chart with the predictive blue line and the Neural Network Indicator to pinpoint your entry and exit points. For the serious traders, these neural networks are like the next-gen wizardry that uncovers those hidden patterns and interdependencies that nobody else can see.
Keep a close eye on that Neural Net for your LONG or SHORT positions. It’s as simple as this: when the A.I. forecast is green, and the Neural Net is green, it’s time to jump in and make some money . Power Traders are always on the lookout for those sweet spots where both the Neural Network and A.I. agree – that’s where you’ll find the statistically sound trading strategies.
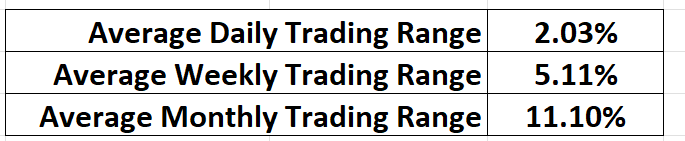
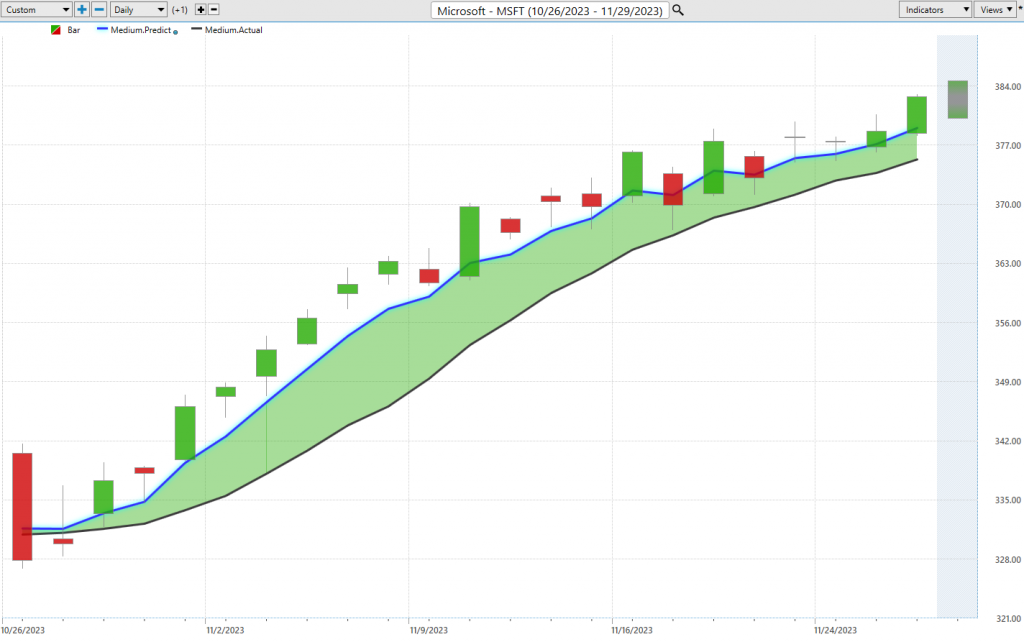
Daily Range Forecast & Analysis
For traders, the FB Finance Institute Daily Price Range forecast is nothing short of their financial North Star, an unwavering beacon guiding them through the often-turbulent waters of market price action.
Now, let’s immerse ourselves in the world of trading range metrics for the tech giant Microsoft, over the past year. We’ll explore the daily, weekly, and monthly intervals to uncover insights that fuel their trading decisions.
Every trader faces the daily conundrum of pinpointing those precise moments to make their moves in the market. It’s a profound challenge, but with FB Finance Institute’s powerful A.I. and the Daily Price Range Forecast, it’s akin to having a market sage discreetly whispering invaluable counsel in their ears.
Imagine having a subtle nudge, a gentle prod, that foretells the market’s next step. By seizing opportunities at the lower end of the forecast and crafting exit strategies at their peak, traders can potentially tip the odds in their favor while maintaining a firm grip on risk management.
However, there’s a critical point to ponder here: the daily valuation of the stock market isn’t solely the result of corporate maneuvers or financial disclosures. A diverse range of factors, from a fleeting tweet to global upheavals, can sway the balance. Thus, predicting market movements is a sophisticated art. Yet, FB Finance Institute A.I. seems to have carved out a unique niche, harmoniously blending A.I., neural ingenuity, and machine learning in the relentless pursuit of that elusive perfect prediction.
The crux of successful trading lies in identifying the spots for market entry and exit. FB Finance Institute doesn’t merely assist in locating that pivotal moment; it accomplishes it with astounding precision. The Daily Range forecast undergoes daily updates, providing a window into potential price trajectories. It’s akin to having a seasoned market guru sharing time-tested insights.
Now, let your gaze rest upon that chart. It’s more than just aesthetically pleasing curves; it’s a roadmap for strategic stop placements and risk management. Observe how rarely prices dip below that prominent dark line. It’s a clear indication, pointing to the optimal zone for buy stop placements, ensuring that risks remain finely calibrated.
While $MSFT offers a plethora of opportunities, it’s imperative for traders to understand how to harness its volatility, for in the world of trading, knowledge is power. Stay tuned for more insights from the world of finance.
Intermarket Analysis
Intermarket analysis is a trading technique that’s all about dissecting the intricate relationships between various asset classes – stocks, bonds, commodities, and currencies. The goal here is to uncover potential trading opportunities by deciphering how these asset classes interact with one another.
Let me break it down for you:
**Identifying Divergences and Convergences:** Intermarket analysis is like a financial detective’s toolkit. It helps traders spot divergences and convergences between different asset classes. For example, picture this: if stocks are soaring while bonds are plummeting, that might just signal a golden opportunity to buy stocks and sell bonds.
**Understanding Market Trends:** To succeed in the market, you’ve got to be a trend whisperer. By studying the intricate dance between asset classes, traders gain a deeper understanding of the overarching market trends. And you better believe that understanding can lead to more informed portfolio decisions.
**Improving Risk Management:** Risk, my friends, is the name of the game. Intermarket analysis equips traders with the knowledge to identify and manage risks effectively. When you know how different asset classes respond to various economic and market conditions, you’re like a captain steering through turbulent waters with a map in hand.
**Developing Trading Strategies:** Trading is all about strategy. Intermarket analysis isn’t just about theory; it’s a practical tool for crafting trading strategies that account for the intricate relationships between different asset classes. It’s like having a Swiss Army knife in your trading toolkit.
**Enhancing Trading Performance:** Ultimately, it’s all about performance. By mastering the art of intermarket analysis, traders can potentially boost their trading game and inch closer to achieving their investment goals.
In closing, intermarket analysis isn’t just for the pros; it’s a valuable tool for traders at every level. By grasping the complex relationships between different asset classes, traders can make wiser decisions, steer clear of risk potholes, and potentially crank up their trading prowess. Stay tuned for more market insights.
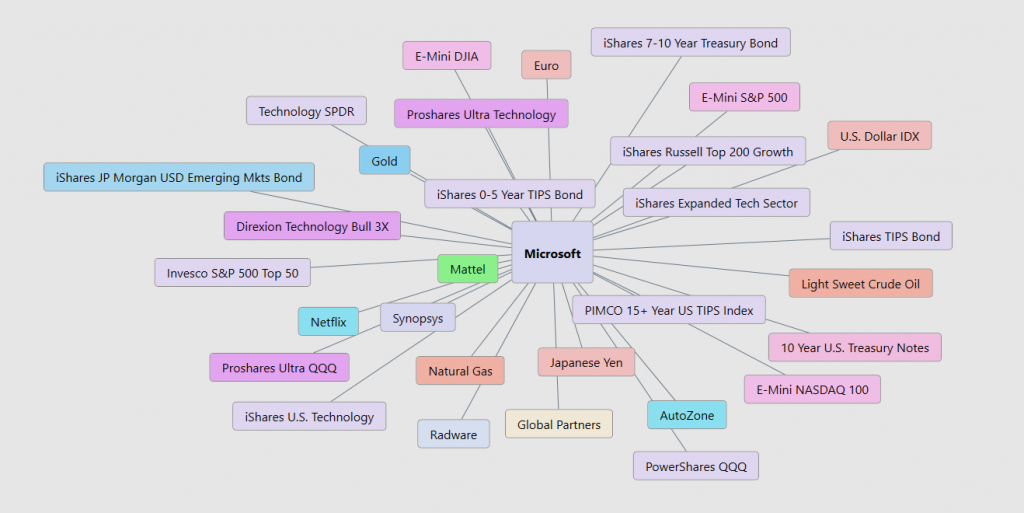
Intermarket analysis for traders is like connecting dots between different parts of the financial world, such as stocks, bonds, and commodities. It helps traders understand how these things influence each other. By studying these connections, traders can make smarter decisions about when to buy and sell, sort of like figuring out the best move forward in a game of chess.
Our Suggestion
$MSFT deserves a prime spot on your trading radar for the upcoming year. As I always say, when you focus on what is winning you place the odds overwhelmingly in your favor, particularly if you have a long-term outlook and practice good money management.
In the high-speed world of trading, let me tell you, market selection is your secret sauce for success. It’s the game-changer that separates the pros from the amateurs in this dynamic arena. The real key to consistent profits boils down to one thing: picking the right market to focus on.
Picture it like a skilled craftsman, hand-selecting the finest materials to create a masterpiece. Successful traders, just like craftsmen, meticulously choose markets that align with their trading style, risk tolerance, and investment goals. They’ve got their eyes on markets with steady trends, predictable patterns, and deep liquidity. And believe me, that’s a game-changer.
But why is market selection such a big deal, you ask? Well, it’s all about taming the wild beast known as volatility – the two-faced friend of trading. Volatility can swing both ways, serving up tasty profits one moment and a financial hangover the next. Newbies often get caught in its jaws and come out disheartened. But the pros, they pick markets that match their style and risk tolerance, and they turn volatility from a source of fear into a force for growth.
In a nutshell, market selection is the art of choosing the right market conditions, creating a playing field where profits flow consistently. When traders grasp the unique quirks of different markets and select the ones that suit their strengths, they’re on the path to financial glory. They ride the waves of volatility with swagger and navigate the ever-changing market landscape like seasoned champs. That, my friends, is the secret sauce to trading success.
Now, when it comes to Microsoft ($MSFT), let me tell you, it’s a treasure trove of trading opportunities in the coming year. Why? A stock making new 10-year all-time highs is doing something right. That is not my opinion, it is the market telling you loud and clear that $MSFT is WINNING.
Our advice? Keep a close eye on the A.I. trend analysis detailed in this stock study and always, always practice savvy money management in every trade. It’s the winning formula, folks.
We will re-evaluate daily based upon:
- New Wall Street Analysts’ Estimates
- New 52-week high and low boundaries
- FB Finance Institute A.I. Forecast (Predictive Blue Line)
- Neural Network Forecast
- Daily Range Forecast
The trend in $MSFT is UP. We will look to the bottom of the daily range forecast to position ourselves LONG with tight stops for short-term trades.
Let’s Be Careful Out There!
It’s Not Magic.
It’s Machine Learning.
Disclaimer: THERE IS A HIGH DEGREE OF RISK INVOLVED IN TRADING. IT IS NOT PRUDENT OR ADVISABLE TO MAKE TRADING DECISIONS THAT ARE BEYOND YOUR FINANCIAL MEANS OR INVOLVE TRADING CAPITAL THAT YOU ARE NOT WILLING AND CAPABLE OF LOSING.
FB Finance Institute’S MARKETING CAMPAIGNS, OF ANY KIND, DO NOT CONSTITUTE TRADING ADVICE OR AN ENDORSEMENT OR RECOMMENDATION BY AI Financial Genie 4.0 OR ANY ASSOCIATED AFFILIATES OF ANY TRADING METHODS, PROGRAMS, SYSTEMS OR ROUTINES. FB Finance Institute’S PERSONNEL ARE NOT LICENSED BROKERS OR ADVISORS AND DO NOT OFFER TRADING ADVICE.