Gold (XAU/USD) and Silver (XAG/USD) Analysis and Charts
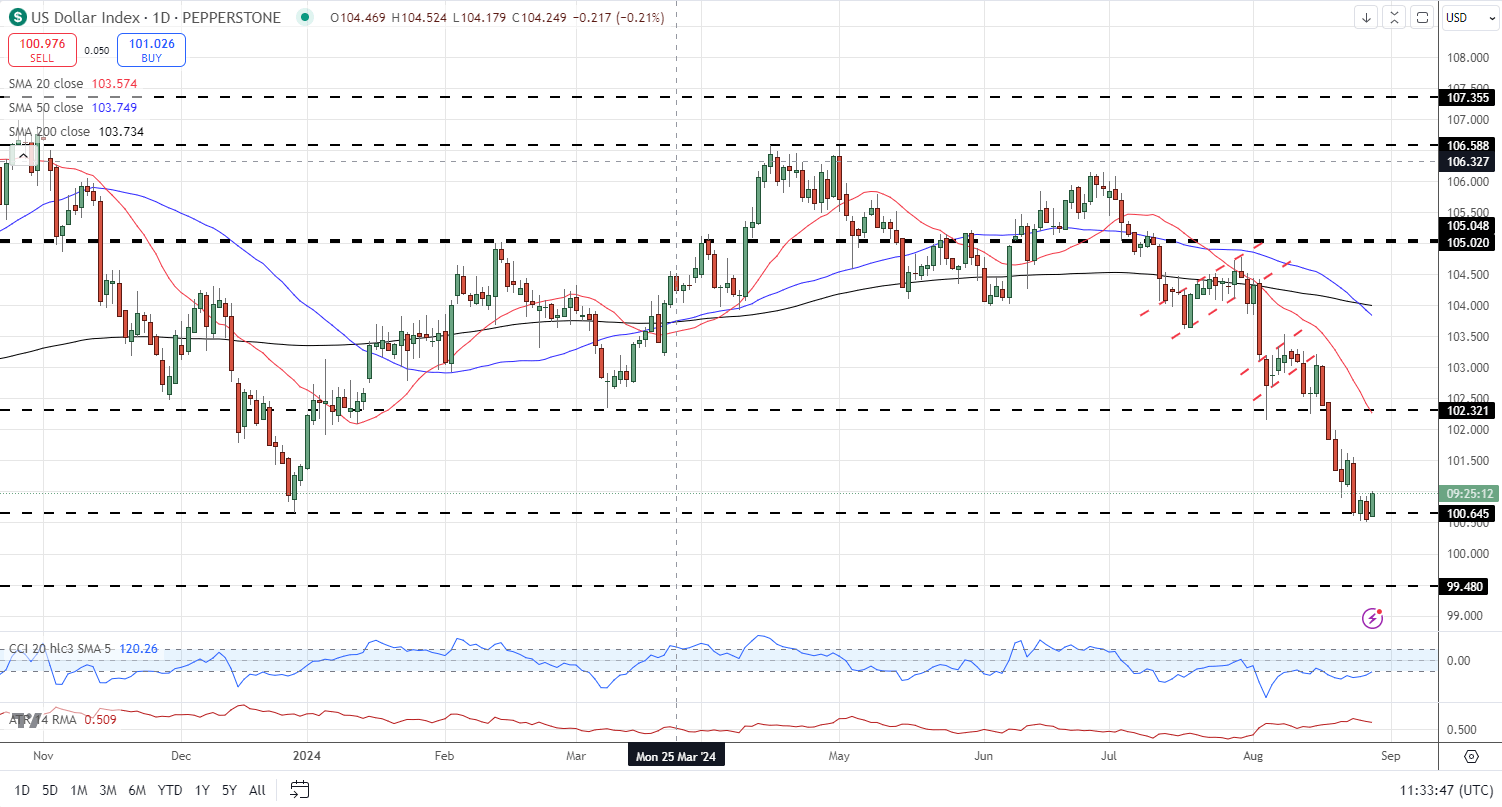
The US dollar Index (DXY) is around 0.4% higher in European trade after steadying around a 9-month low this week. This slight move higher lacks any conviction and a further move lower is expected in the coming weeks as US interest rate cuts come into play. The next driver of price action, and sentiment, is likely to be Nvidia’s quarterly earnings released after the US market close today.
US Dollar Index (DXY) Daily Chart
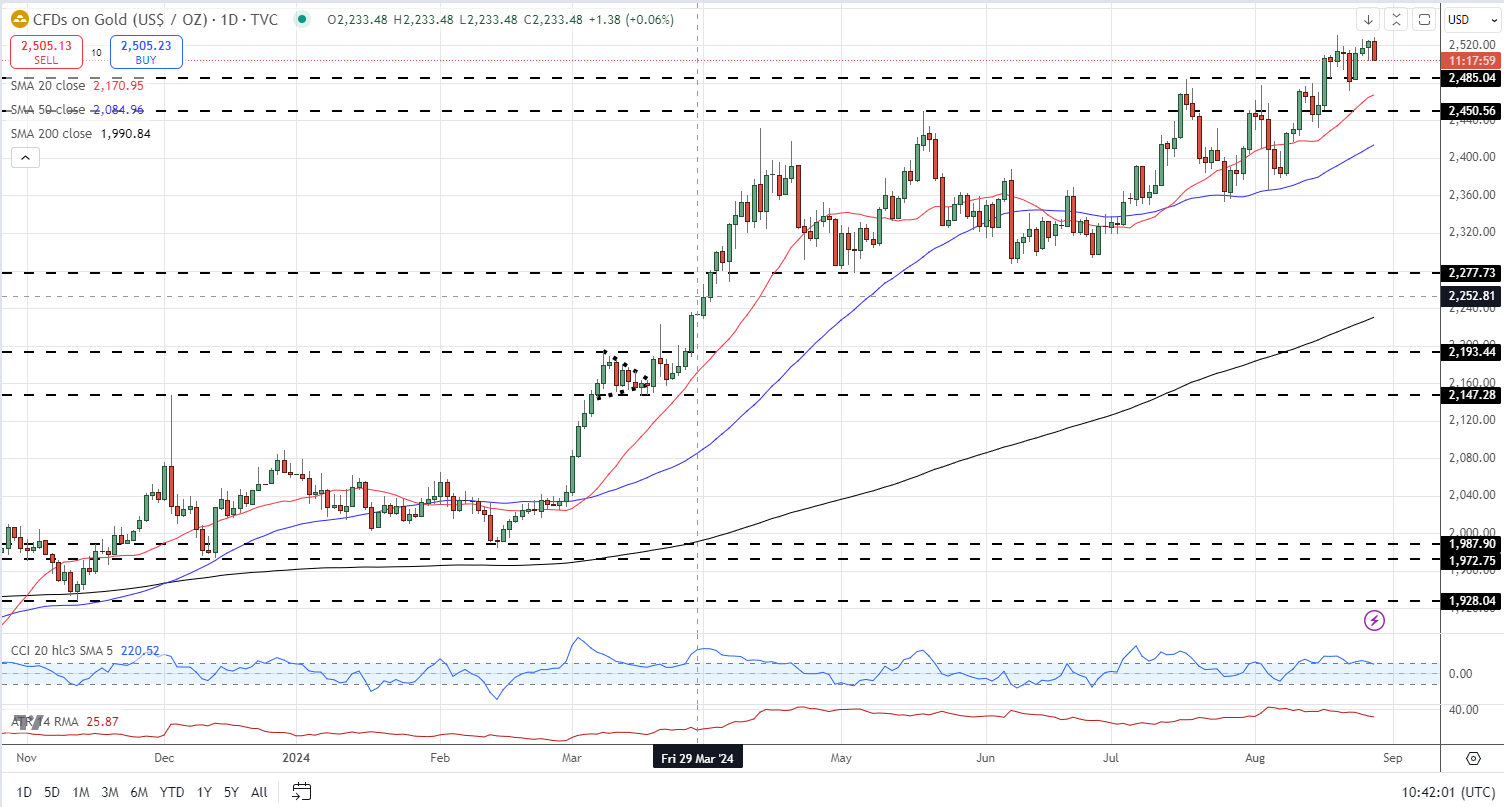
The outlook for gold remains positive for the weeks ahead after the precious metal reached another multi-decade high last week. The demand for gold remains at, or close to, the highest level in 14 years, driven higher by Middle East tensions and a dovish US interest rate outlook. Initial support is around $2,485/oz. followed by $2,450/oz.
Gold Daily Price Chart
Retail trader data shows 53.66% of traders are net-long with the ratio of traders long to short at 1.16 to 1.The number of traders net-long is 10.14% higher than yesterday and 13.05% higher from last week, while the number of traders net-short is 5.69% lower than yesterday and 9.76% lower from last week.
We typically take a contrarian view to crowd sentiment, and the fact traders are net-long suggests Gold prices may continue to fall. Traders are further net-long than yesterday and last week, and the combination of current sentiment and recent changes gives us a stronger Gold-bearish contrarian trading bias.
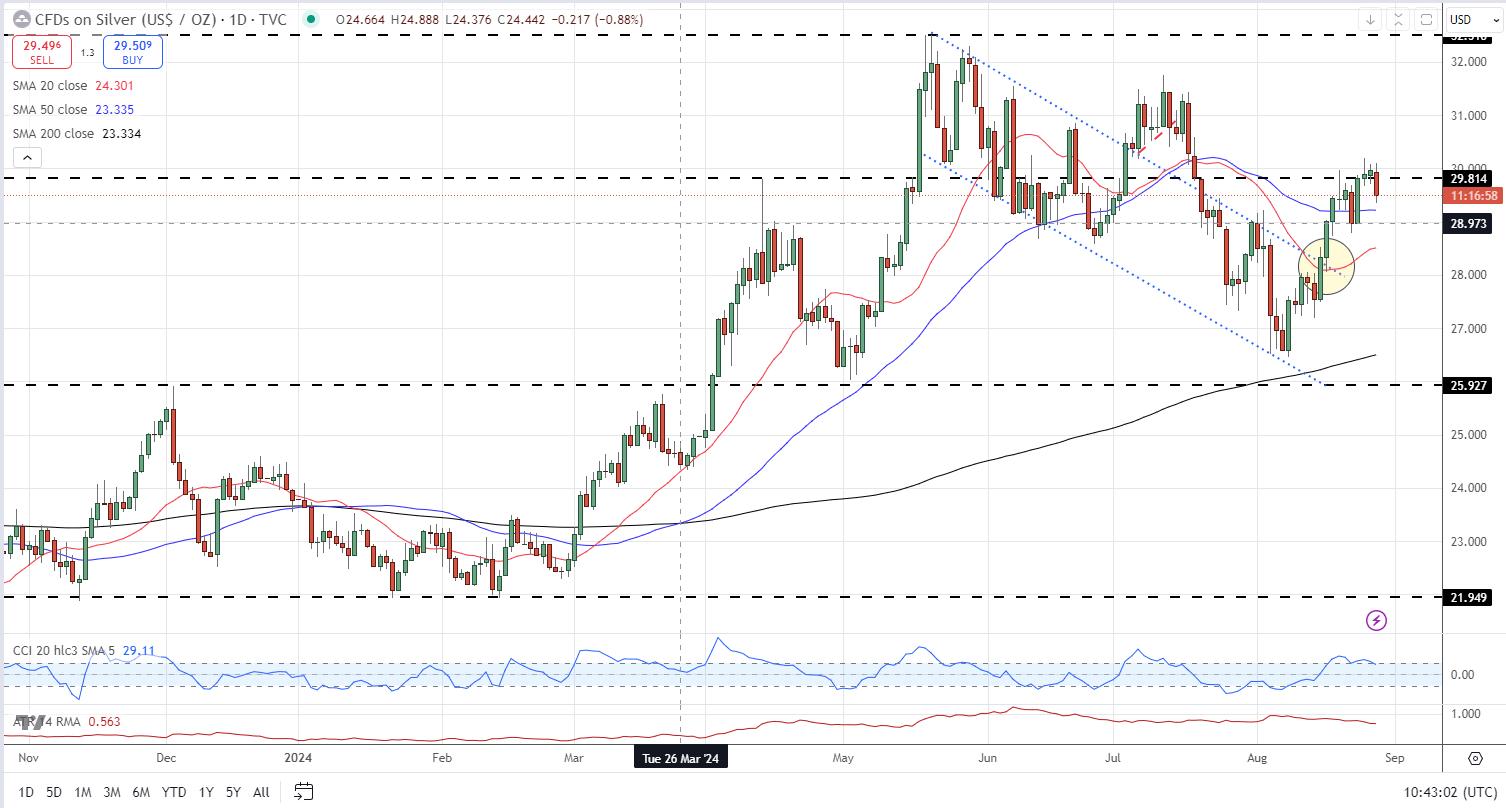
Silver broke through a bullish flag pattern on August 16th and posted a fresh six-week high at the start of this week. This bullish pattern remains in control of silver’s outlook and a clear break above $29.82/oz. should bring the July 11th high at $31.75/oz. into play.
Silver Daily Price Chart