NASDAD 100, USD/JPY FORECAST:
- Nasdaq 100 rises for the seventh straight day, but gains are capped by rising U.S. rates
- U.S. Treasury yields resume their advance after last week’s pullback
- Meanwhile, USD/JPY perks up, putting an end to a three-day losing streak, with the broader U.S. dollar benefiting from the move in bonds
After struggling for direction for much of the trading session, the Nasdaq 100 finished the day slightly higher, but gains were contained by rising rates. Last week, Treasury yields fell after the Federal Reserve adopted a more cautious tone and macro data raised concerns about the state of the economy, but the move was overdone, prompting a large recovery today. The rally in yields boosted the broader U.S. dollar, paving the way for USD / JPY to reclaim the psychological 150.00 threshold.
This article focuses on the Nasdaq 100 and USD/JPY from a technical perspective, examining critical price levels worth watching in the coming days.
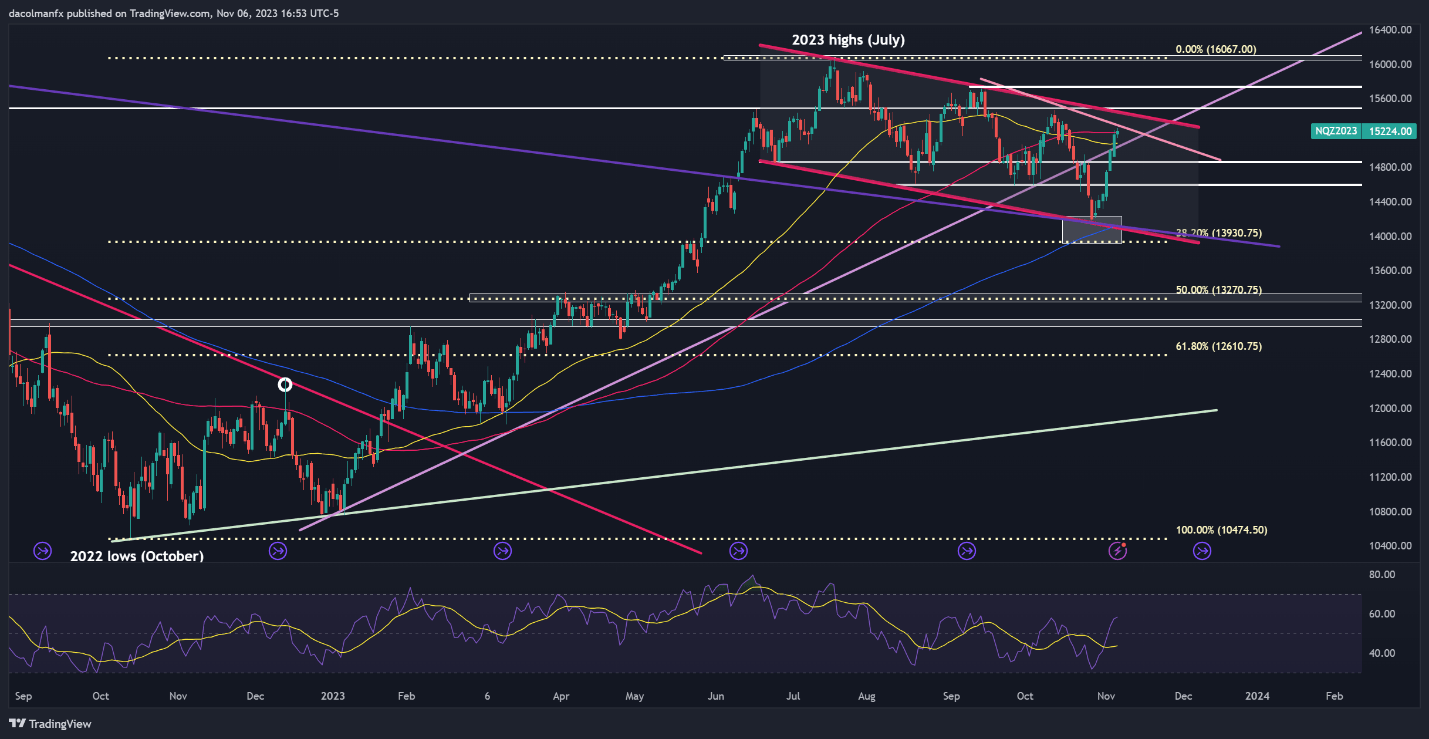
NASDAQ 100 TECHNICAL ANALYSIS
The Nasdaq 100 rose for the seventh straight day after rebounding from confluence support at 14,150/ 13,930. Following this remarkable winning streak, prices have broken above key technical levels and are currently flirting with a major trendline at 15,230. If this ceiling is breached, a push towards cluster resistance at 15,400/15,475 becomes a tangible possibility. On further strength, the focus shifts to 15,740.
On the flip side, if the bullish camp starts liquidating positions to take profits on the recent rally and sellers return, initial support stretches from 15,075 to 15,040. Below this area, attention transitions to 14,865, followed by 14,600. The tech index may establish a foothold around the 14,600 area on a pullback, but in the event of a breakdown, the bears may set their sights on the October lows.
NASDAQ 100 TECHNICAL CHART
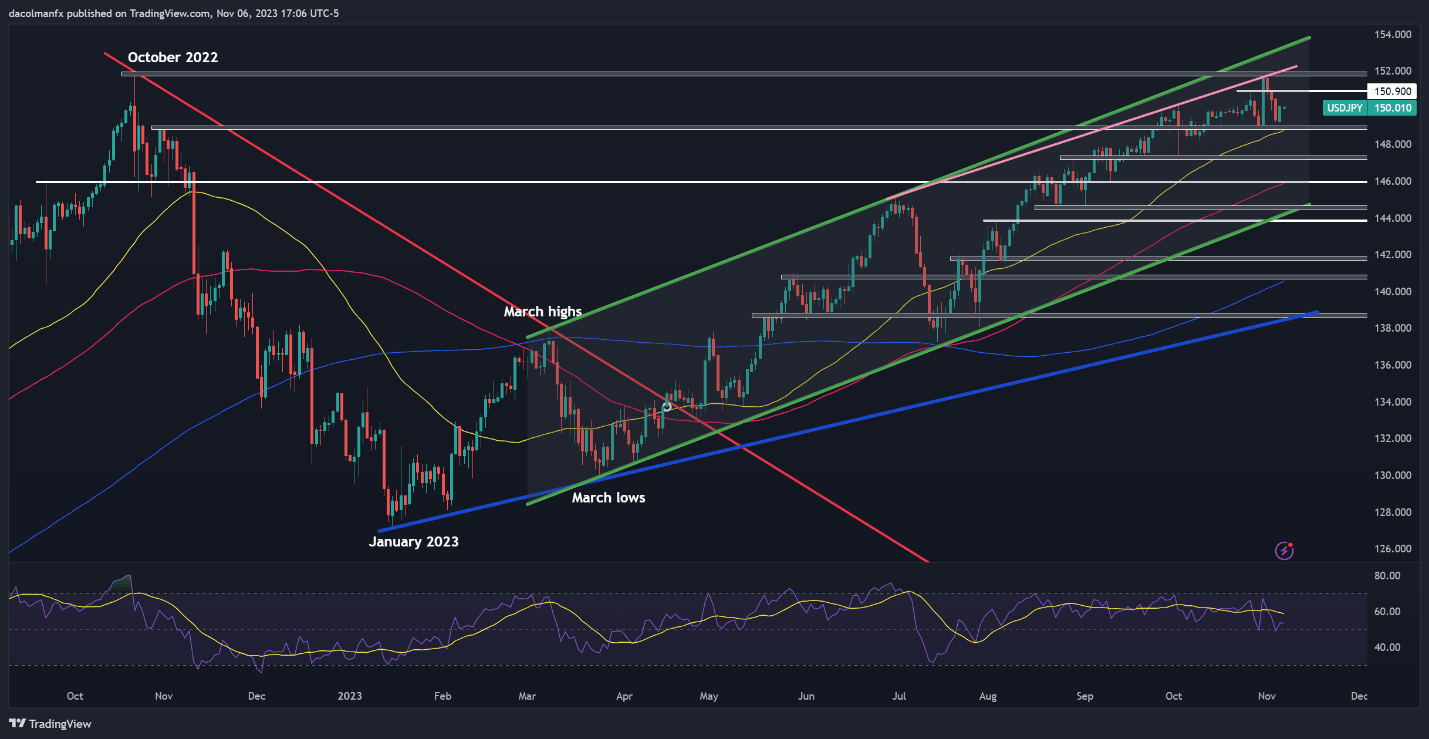
USD/JPY TECHNICAL ANALYSIS
USD/JPY rebounded on Monday and ended a three-day losing streak, boosted by a rally in U.S. yields. If gains accelerate in the coming days, resistance lies at 150.90, followed by the 2023 peak located around the 152.00 handle. Successfully piloting above this ceiling could reinforce upward impetus, paving the way for a move towards the upper boundary of a medium-term rising channel at 153.000.
On the other hand, if sellers regain control of the market and spark a bearish reversal from current levels, technical support appears at the psychological 149.00 mark, near the 50-day simple moving average. Should this floor cave in, we could witness a pullback towards 147.25 and 146.00 thereafter. Below those levels, the next area of interest is situated around 144.50.
USD/JPY TECHNICAL CHART