RAND TALKING POINTS & ANALYSIS
- Rand remains buoyant on weaker USD and positive leading business cycle figures.
- FOMC minutes to come later today.
- Bullish divergence progressing off long-term support.
USD/ZAR FUNDAMENTAL BACKDROP
Foundational Trading Knowledge
Macro Fundamentals
Recommended by Warren Venketas
Start Course
The South African rand has been consolidating of recent against the US dollar due to global markets digesting recent US economic data and what that means for the Federal Reserve’s monetary policy outlook. Sentiment has shifted from a hawkish dynamic to one more neutral particularly via the US labor market. The FOMC minutes later this evening will likely be dismissive of any hawkish speak and may favor additional ZAR upside.
From a South African perspective, this week provides several high impact data reports including CPI and the South African Reserve Banks’s (SARB) interest rate announcement. Although forecasts are for a rate pause, lower inflationary pressures could weigh negatively on the rand considering the greenback is quickly reaching oversold levels. Today’s data (refer to economic calendar below), paints a mixed picture with the leading business cycle indicator increasing by its highest percentage this year while business confidence slipped from the Q3 read and remains well below the neutral mark (i.e. low confidence).
USD/ZAR ECONOMIC CALENDAR (GMT +02:00)
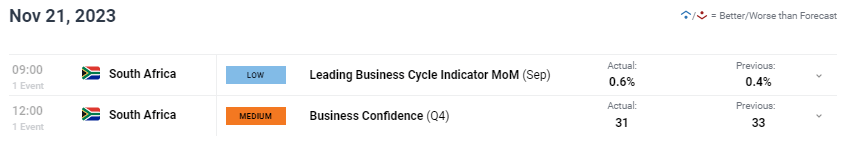
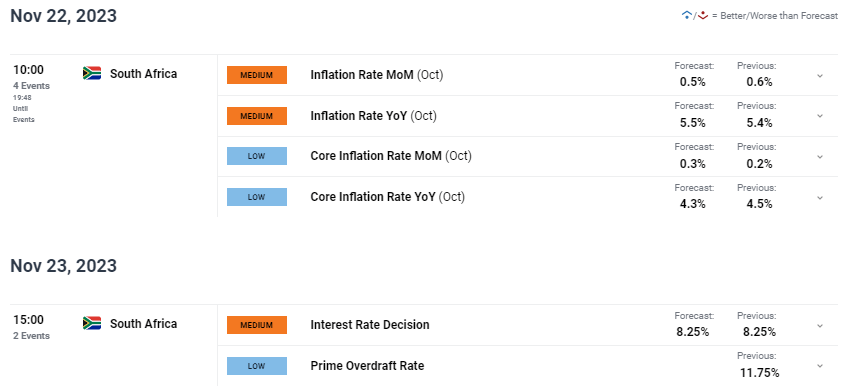
Source: DailyFX Economic Calendar
The weaker USD has contributed to an increase in many dollar based commodities including South Africa’s major exports including gold , iron ore and other precious metals. A more positive outlook from a Chinese perspective supplemented this upside and should China’s economic growth continue to show improvement, the ZAR may follow suit.
TECHNICAL ANALYSIS
USD/ZAR DAILY CHART
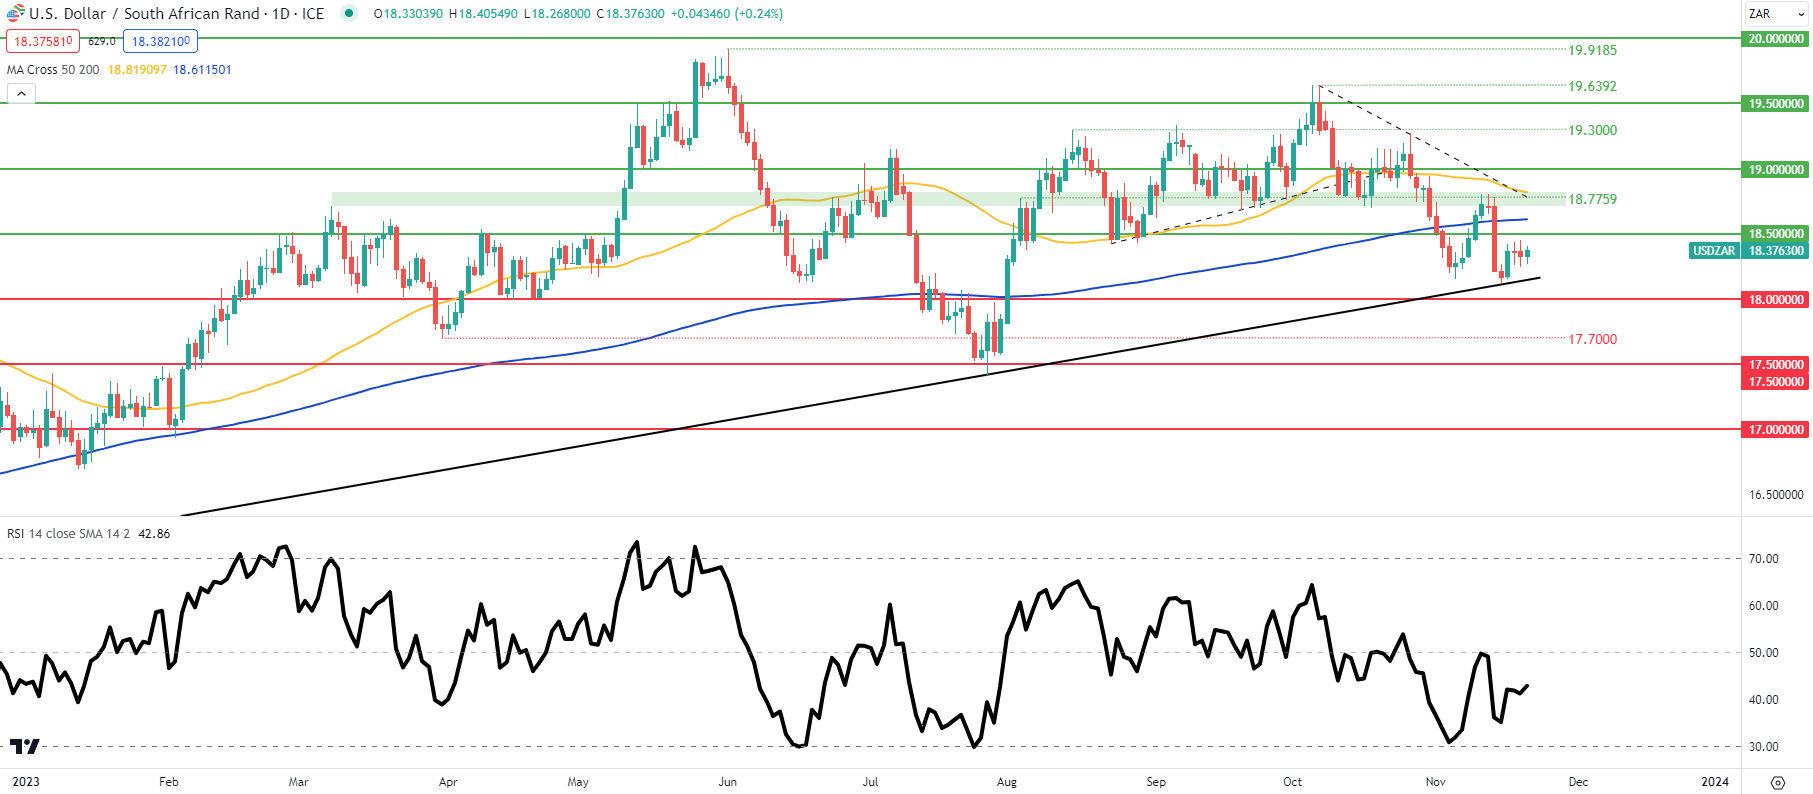
Chart prepared by Warren Venketas , TradingView
The daily USD/ZAR chart above shows traders being respectful of the long-term trendline support (black) zone as mentioned in my previous analysis that coinciding with the bullish/positive divergence factor measured via the Relative Strength Index (RSI) . Recent doji candles suggest indecision at this point and is predictable in an environment where key economic data looms. The week’s end should give us a more accurate picture of the local market as well as more information around the US economy with jobless claims under the spotlight after last week’s 3-month high.
- 18.7759/50-day MA (yellow)
- 200-day MA (blue)
- 18.5000
- Trendline support
- 18.0000
- 17.7000