GBP/USD Analysis and Charts
- Better than expected PMI data underpins Sterling’s recent rally.
- Cable ( GBP/USD ) prints a fresh 10-week high.
For all market-moving economic data and events, see the
The latest UK S&P Global PMIs beat both last month’s prints and expectations earlier today, with the all-important services sector leading the way.

According to Tim Moore, economics director at data provider S&P Global Market Intelligence,
‘The UK economy found its feet again in November as the service sector arrested a three-month sequence of decline and manufacturers began to report less severe cutbacks to production schedules. Relief at the pause in interest rate hikes and a clear slowdown in headline measures of inflation are helping to support business activity, although the latest survey data merely suggests broadly flat UK GDP in the final quarter of 2023.’
While the data shows a mildly better UK economy, albeit with worries about growth and inflation in the coming months, Sterling traders took a positive view on the release and pushed the Pound higher. GBP/ USD made a new ten-week high post-release and the pair are now four-and-a-half big figures higher from the 1.2100 print seen at the start of the month. A lot of the move in cable has been due to US dollar weakness, but today’s rally is being led by Sterling's strength and this may well continue.
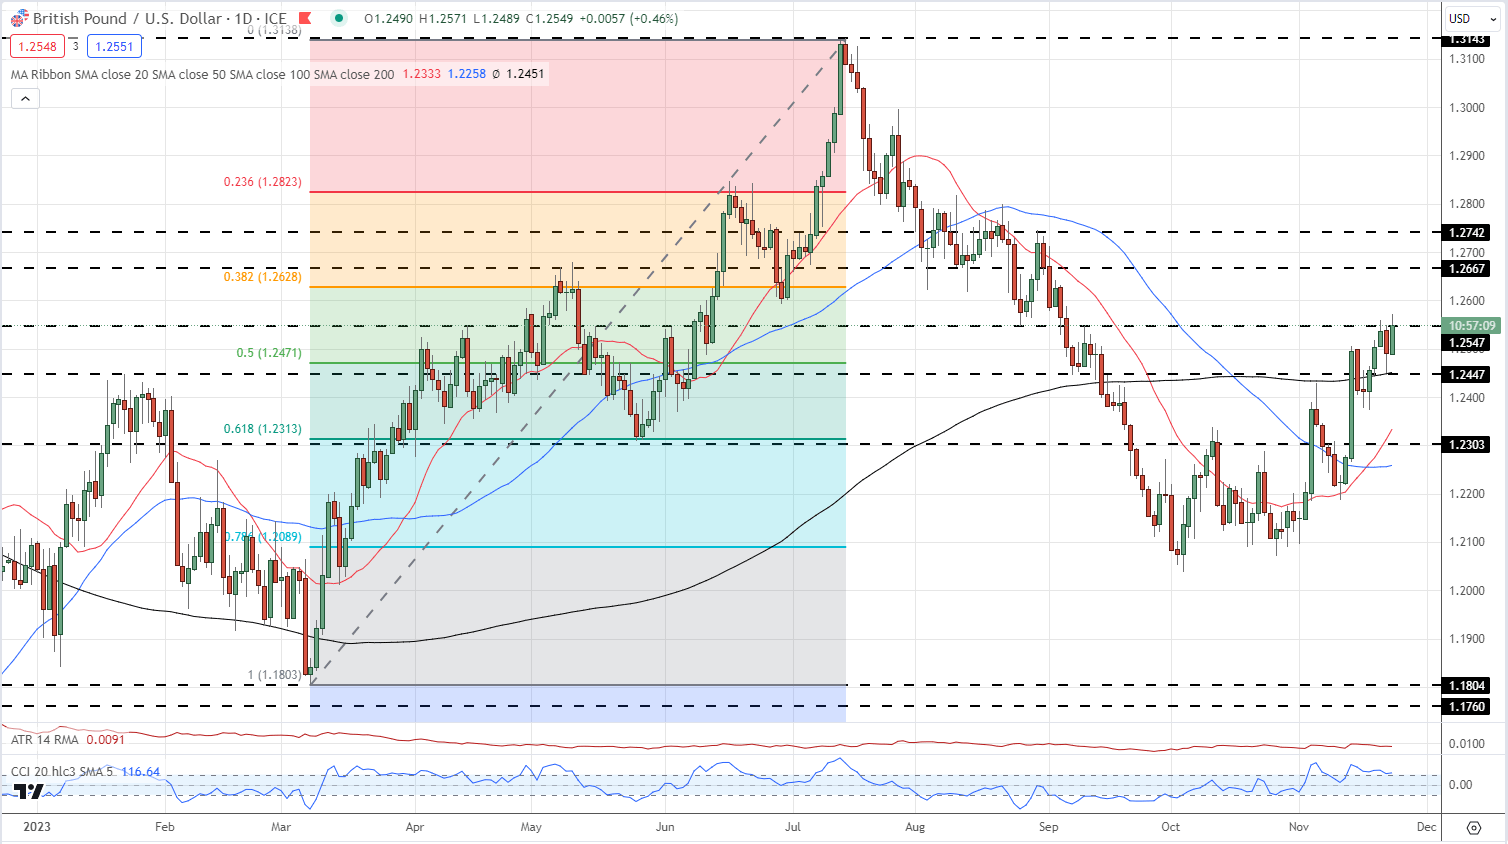
From a technical perspective, GBP/USD remains biased to further upside. The pair recently broke above the 200-day simple moving average (sma) for the first time since early September and this longer-dated moving average now turns supportive. Above the 200-dsma, the 50% Fibonacci retracement at 1.2471 adds further support. A clean break above 1.2547 would leave the 38.2% Fib retracement at 1.2628 vulnerable.
GBP/USD Daily Price Chart

Retail trader data shows 52.97% of traders are net-long with the ratio of traders long to short at 1.13 to 1.The number of traders net-long is 2.78% higher than yesterday and 1.60% lower than last week, while the number of traders net-short is 11.97% lower than yesterday and 5.62% higher from last week.
