GOLD PRICE (XAU/USD), AUD/USD FORECAST:
- Gold prices climb and challenge technical resistance on the back of falling U.S. yields and U.S. dollar softness
- AUD/USD also pushes higher, breaking above its 200-day simple moving average
- This article looks at key technical levels to watch on XAU/ USD and AUD /USD this week
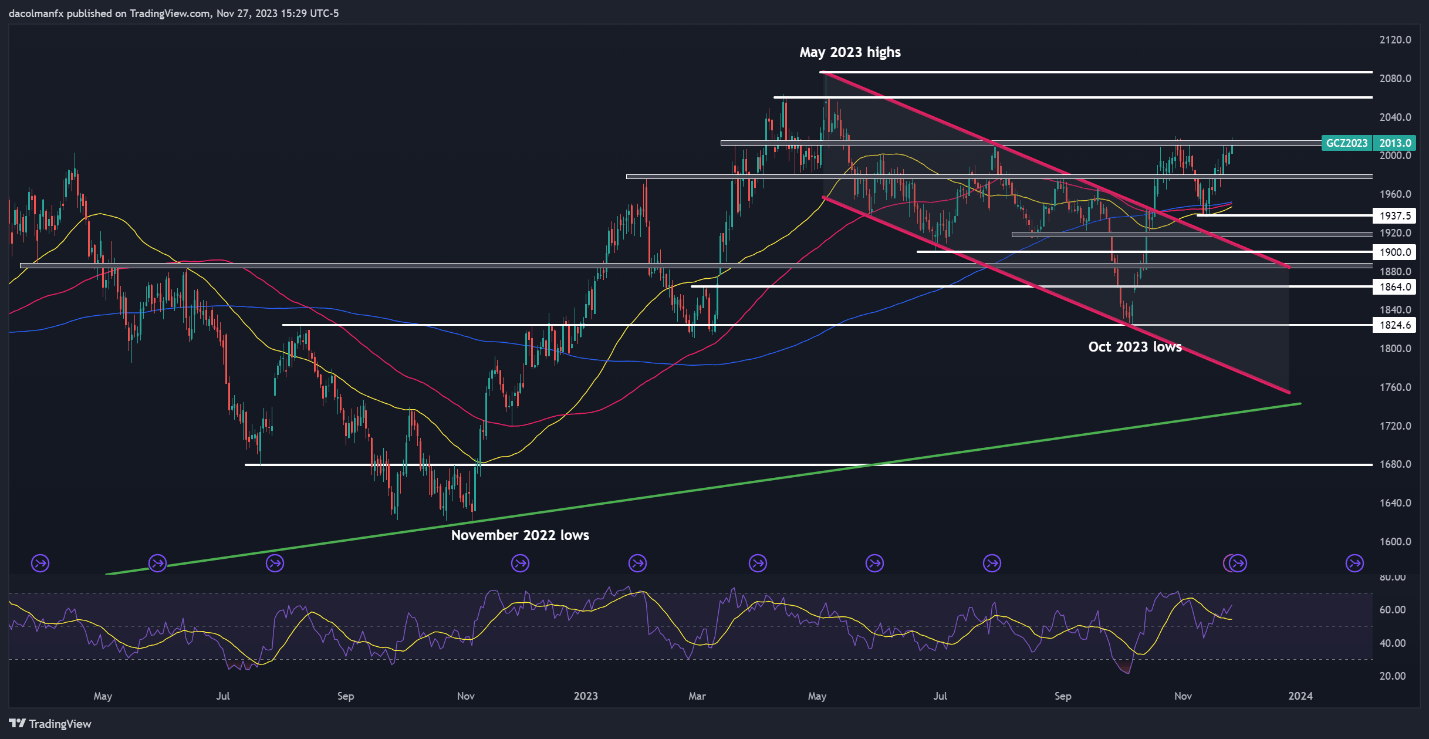
GOLD PRICE TECHNICAL ANALYSIS
Gold prices climbed on Monday, buoyed by the drop in U.S. yields and the U.S. dollar’s softness. With recent performance in mind, XAU/USD has risen more than 8% since October, firmly eclipsing its 200-day simple moving average and ascending beyond the psychological $2,000 level – two technical signals that have strengthened the metal’s constructive bias.
For stronger conviction in the bullish thesis and to validate the potential for further upward momentum, a clear and decisive move above $2,010/$2,015 is required – a major resistance zone that has consistently thwarted advances since the beginning of the year. While clearing this hurdle might pose a challenge for bulls, a breakout could catalyze a rally towards $2,060, followed by $2,085, May’s high.
In the event that gold gets rejected to the downside from its current position, the asset might trend towards support spanning from $1,980 to $1,975. Prices could potentially stabilize in this area on a bearish reversal, but a push below this floor could lead to a retreat towards the 200-day simple moving average situated around the $1,950 mark. Beneath this threshold, attention might refocus on $1,937.
GOLD PRICE TECHNICAL CHART
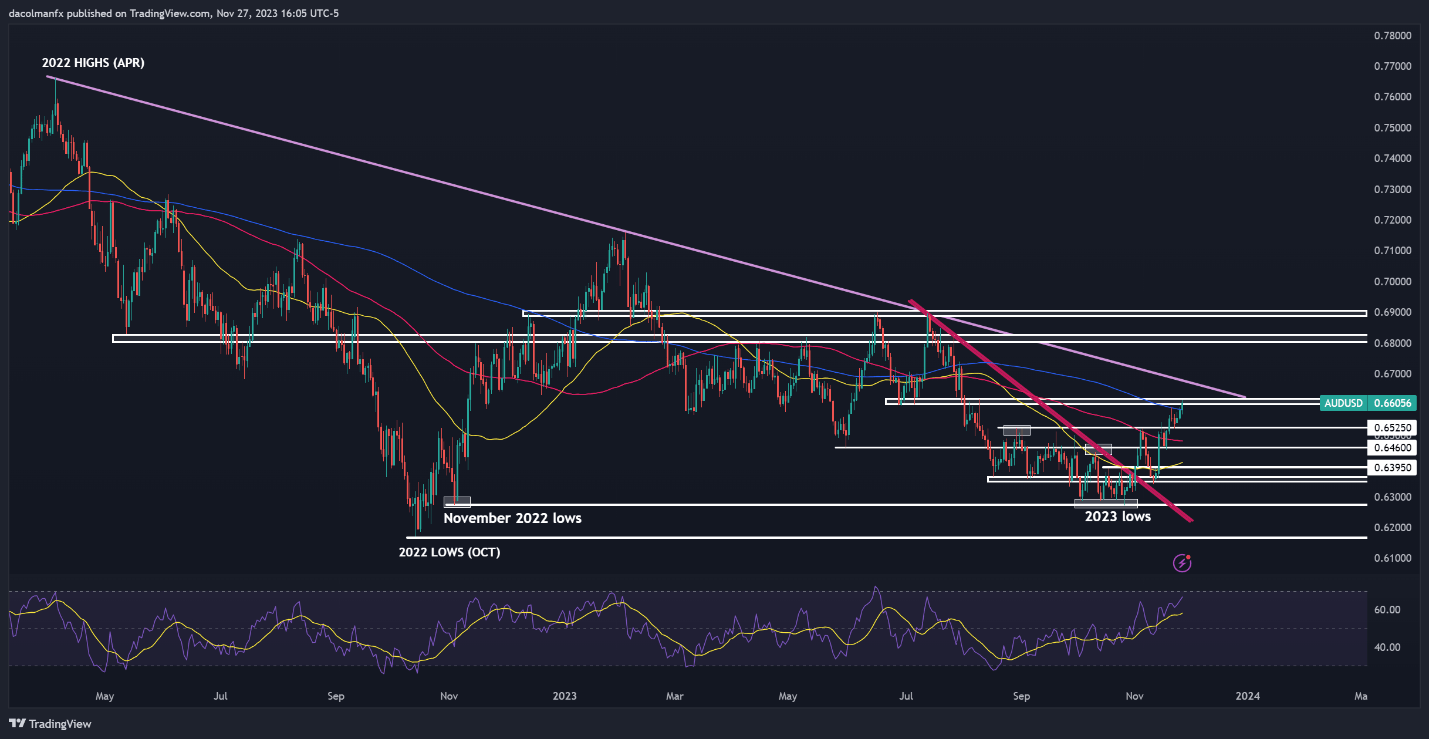
AUD/USD TECHNICAL ANALYSIS
AUD/USD trekked upwards at the start of the new week, climbing above its 200-day simple moving average and coming within a whisker of taking out technical resistance located in the 0.6600-0.6620 band. With the RSI indicator approaching overbought territory, the recent rally could soon run out of steam, but a move above 0.6600-0.6620 could breathe new life into the pair and reinvigorate the bulls, propelling prices towards trendline resistance at 0.6670. On further strength, we may see a move towards 0.6815.
On the other hand, if market sentiment shifts in favor of sellers and AUD/USD takes a turn to the downside, primary support looms at 0.6525, but further losses could be in store on a push below this threshold, with the next downside target corresponding to the 100-day simple moving average, followed by 0.6460. It is of utmost importance for the bulls to robustly defend this floor; any failure to do so could catalyze a pullback towards 0.6395.
AUD/USD TECHNICAL CHART