FTSE 100, DAX 40, Russell 2000 - Analysis and Charts
FTSE 100 under pressure as UK GDP shrinks
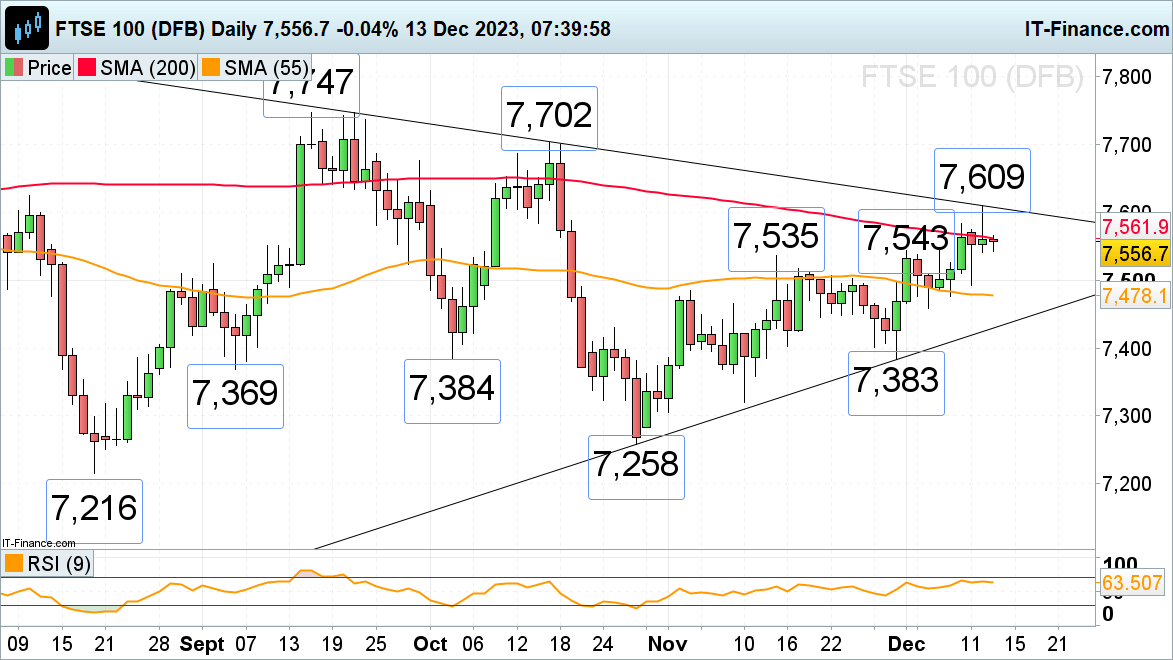
The FTSE 100 briefly made a new two-month high at 7,609 on Tuesday, along the September-to-December downtrend line, before falling back to its 200-day simple moving average (SMA) at 7,562 as UK GDP disappoints. The services sector was the largest faller, followed by production and construction.
Further sideways trading ahead of this evening’s Federal Open Market Committee (FOMC) and Thursday’s Bank of England (BoE) meetings is likely to be seen. A fall through Tuesday’s 7,541 low may lead to Monday’s low and the 55-day simple moving average (SMA) at 7,493 to 7,478 being revisited. Minor resistance above Friday’s 7,583 high comes in at this week’s 7,609 peak.
FTSE 100 Daily Chart
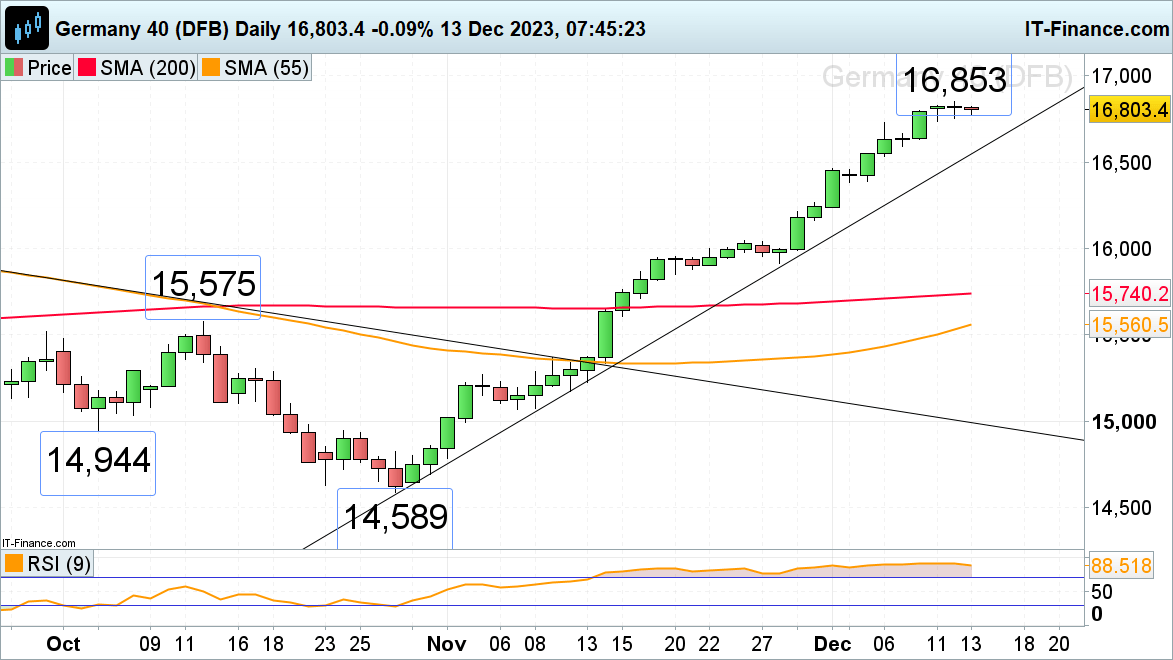
DAX 40 consolidates below a new record high
The DAX 40’s strong advance from its October low over six consecutive bullish weeks led to a new record high being made above the 16,850 mark on Tuesday but did so in low volume and volatility despite better-than-expected German ZEW consumer morale.
All eyes are now on Thursday’s European Central Bank (ECB) monetary policy meeting and the press conference which will follow it.
A rise above Tuesday’s all-time high at 16,853 would eye the 16,900 mark whereas a slip through Monday’s 16,735 low could lead to a drop back towards the October-to-December uptrend line at 16,544 being witnessed.
DAX 40 Daily Chart
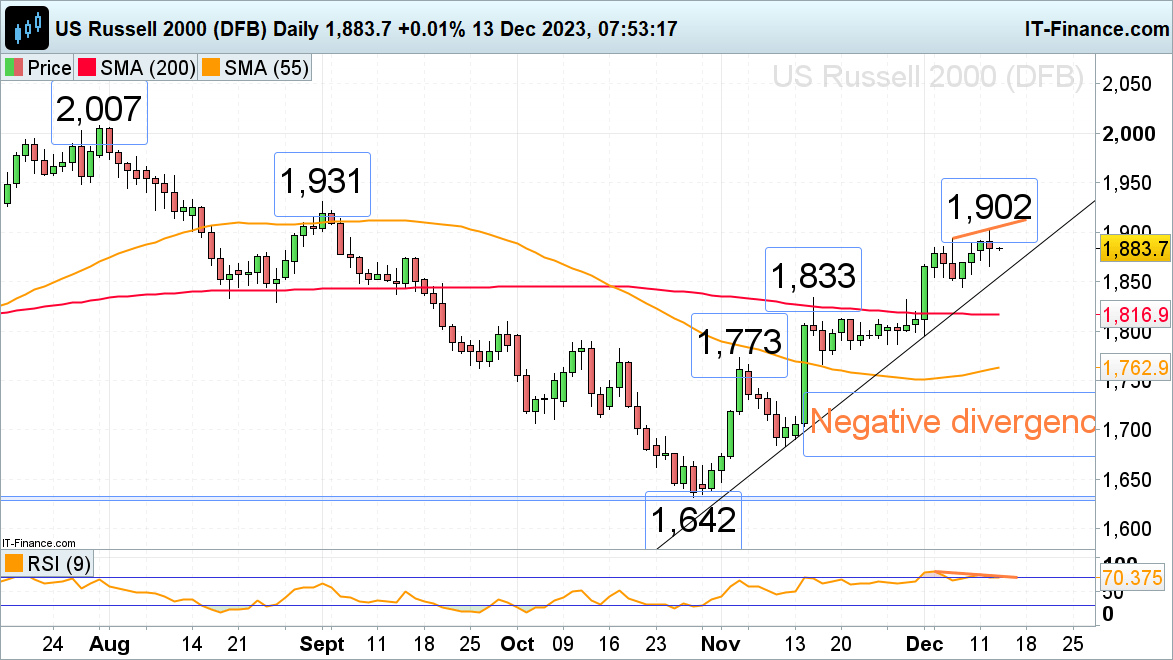
Russell 2000 trades at three-month highs but looks potentially toppish
The Russell 2000, the great underperformer of US stock indices with only a 7.5% gain year-to-date, hit a three-month high at 1,902 on Tuesday ahead of Wednesday’s Federal Reserve (Fed) meeting and rate announcement. Since this week’s high has been accompanied by negative divergence on the daily Relative Strength Index (RSI), there is a potential for a bearish reversal soon rearing its head.
A fall through Tuesday’s 1,866 low would eye the October-to-November uptrend line at 1,856 as well as last week’s low at 1,844. Further down meanders the 200-day simple moving average (SMA) at 1,817 which may act as support, if reached.
A rise above 1,902 would put the September peak at 1,931 on the cards, though.
Russell 200 Daily Chart