RAND TALKING POINTS & ANALYSIS
- Fed narrative changes leaving rand supported.
- SARB Quarterly Bulletin and US retail sales under the spotlight.
- USD/ZAR rising wedge breakout but yet to prove.
Foundational Trading Knowledge
Macro Fundamentals
Recommended by Warren Venketas
Start Course
USD/ZAR FUNDAMENTAL BACKDROP
The South African rand attempts to extend yesterday’s gains after the Fed decided to increase its rate cut forecast for 2024 by an additional . Although the central bank was expected to hold rates, the dovish response by Fed Chair Jerome Powell was hailed by risk assets across financial markets including most Emerging Market (EM) currencies . Key metrics cited by Mr. Powell were slowing GDP , softening inflation and a normalizing labor market. The focus moving forward from this point will be timing and size of upcoming rate cuts and where the Fed will end up settling between their forecasts for 2024 of - and current money market pricing revealing - .
From a South African perspective, inflation data was clearly overshadowed yesterday but the actual data is encouraging for the South African Reserve Bank (SARB) . A negative MoM print and a miss on YoY brings inflation back on the downward trend after recent upside surprises.
Later today (see economic calendar below), USD /ZAR will be shaped by the SARB’s Quarterly Bulletin, SA PPI and US retail sales data with the latter being the most influential. Jobless claims will be closely monitored particularly the initial jobless claims line item. Other ZAR crosses including GBP /ZAR and EUR /ZAR should provide more volatility as both the Bank of England (BoE) and European Central Bank (ECB) are scheduled to announce their rate decisions . Should they follow on from the Fed, the rand may find additional support across these currency pairs as well.
USD/ZAR ECONOMIC CALENDAR (GMT +02:00)
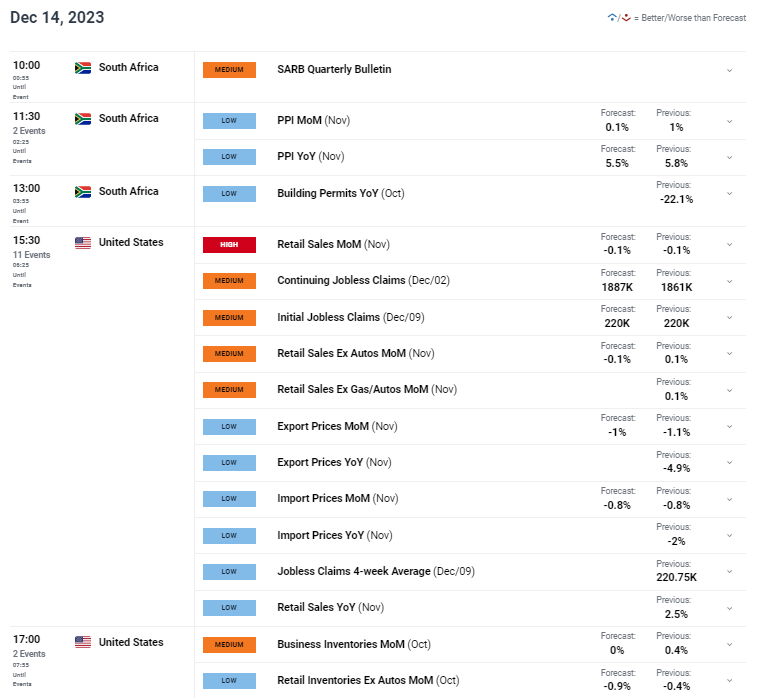
Source: DailyFX Economic Calendar
TECHNICAL ANALYSIS
USD/ZAR DAILY CHART
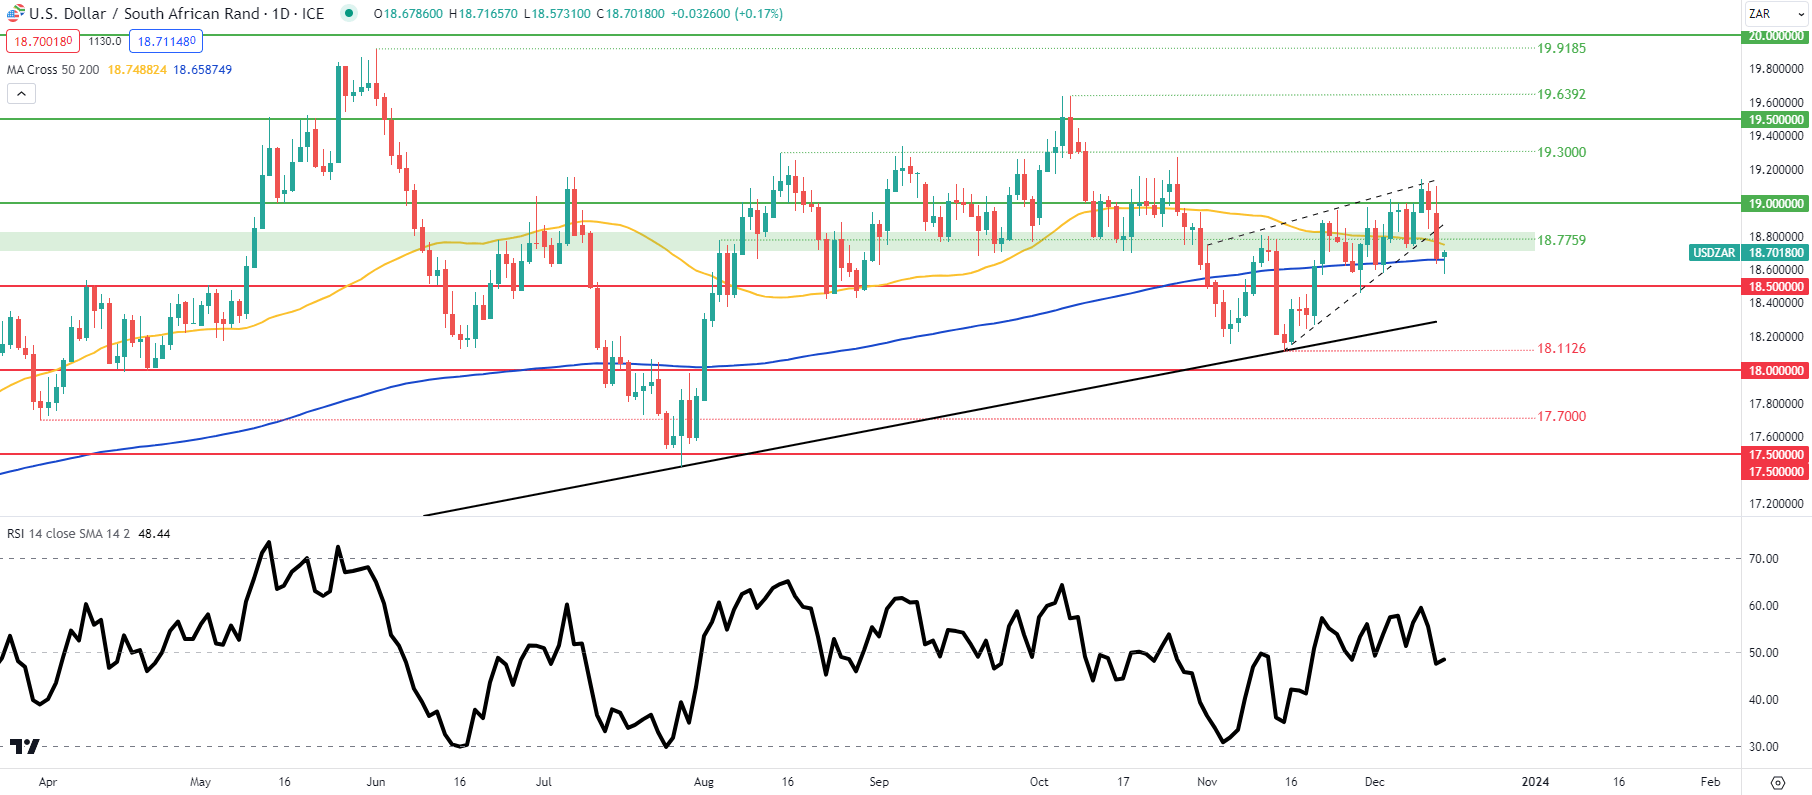
Chart prepared by Warren Venketas , TradingView
The daily USD/ZAR chart has broken below the rising wedge chart pattern (dashed black line) but is not confirmed in my opinion. I would want to see a confirmation close below the 200-day moving average (blue) which may then expose the psychological handle and potentially a retest of the long-term trendline support level (black). The current daily candle reflects a long lower wick and could see the pair pullback higher should it close in this fashion.
- 19.0000
- 18.7759
- 50-day MA (yellow)
- 200-day MA (blue)
- 18.5000
- Trendline support