US Core PCE Key Points:
- Core PCE Price Index YoY(NOV) Actual 3.2% Vs 3.5% Previous.
- PCE Price Index YoY(NOV) Actual 2.6% Vs 2.9% Previous (Revised Down).
- The Data Today Will Only Further Fuel the Fire Regarding Rate Cuts in 2024.
- To Learn More About Price Action , Chart Patterns and Moving Averages , Check out the DailyFX Education Section .
The PCE prices MoM declined in November coming in at -0.1%following last month’s flat reading. The COREPCE price index MoMcame in at 0.1% down from the 0.2% print from last month in what will be a welcome print for the US Federal Reserve.
The annual CORE PCE rate cooled to 3.2% from 3.5%, afresh low since mid-2021.
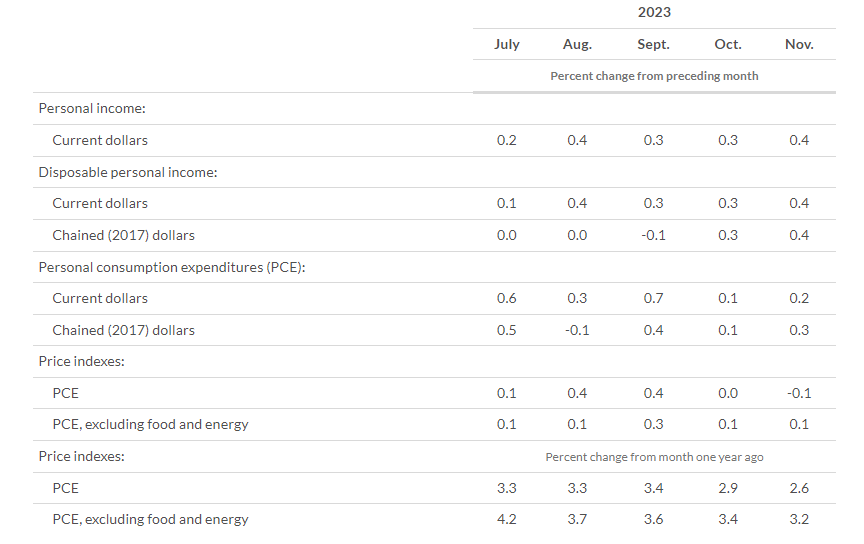
Meanwhile, annual core PCE inflation which excludes food and energy, slowed to 3.5% from 3.7%, a fresh low since mid-2021. Meanwhile, monthly core PCE inflation which excludes food and energy and is preferred Fed inflation measure, was steady at 0.1%, after a downwardly revised reading in October.
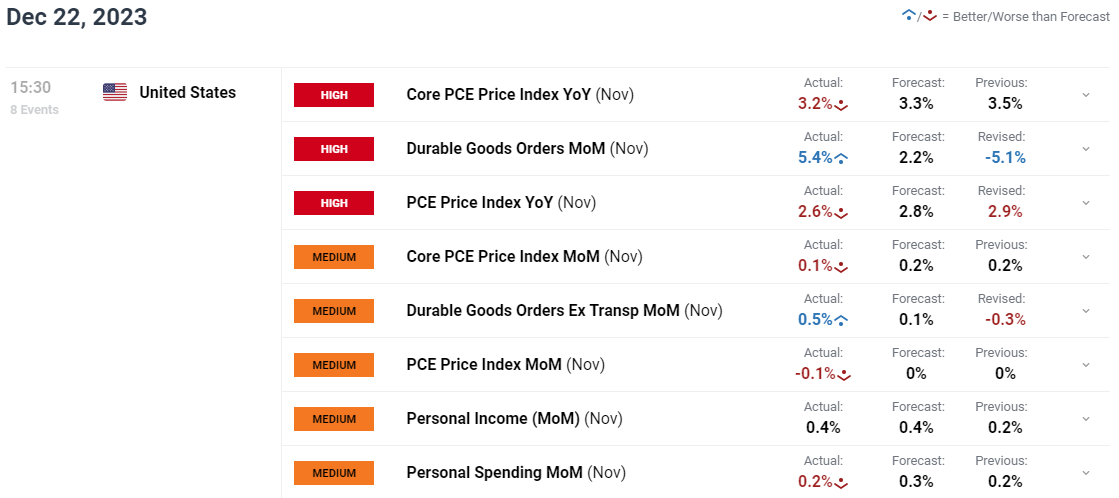
Personal incomeincreased $81.6 billion (0.4 percent at a monthly rate) in November, according to estimates released today by the Bureau of Economic Analysis
From the preceding month, thePCE price indexfor November decreased 0.1 percent. Prices for goods decreased 0.7 percent and prices for services increased 0.2 percent. Food prices decreased 0.1 percent and energy prices decreased 2.7 percent. Excluding food and energy, the PCE price index increased 0.1 percent.
IMPLICATIONS FOR THE US ECONOMY
The US GDP data added a further feather in the ca for market participants punting for 150bps of rate cuts in 2024. Today’s data will only add fuel to that fire as the PCE inflation remains the Fed's preferred inflation metric. The November figures showed again inflationary pressures continue to moderate at a slow pace. The Federal Reserve predicts PCE inflation to be 2.8%, and core PCE inflation at 3.2% in 2023, both decreasing to 2.4% in the following year.
MARKET REACTION
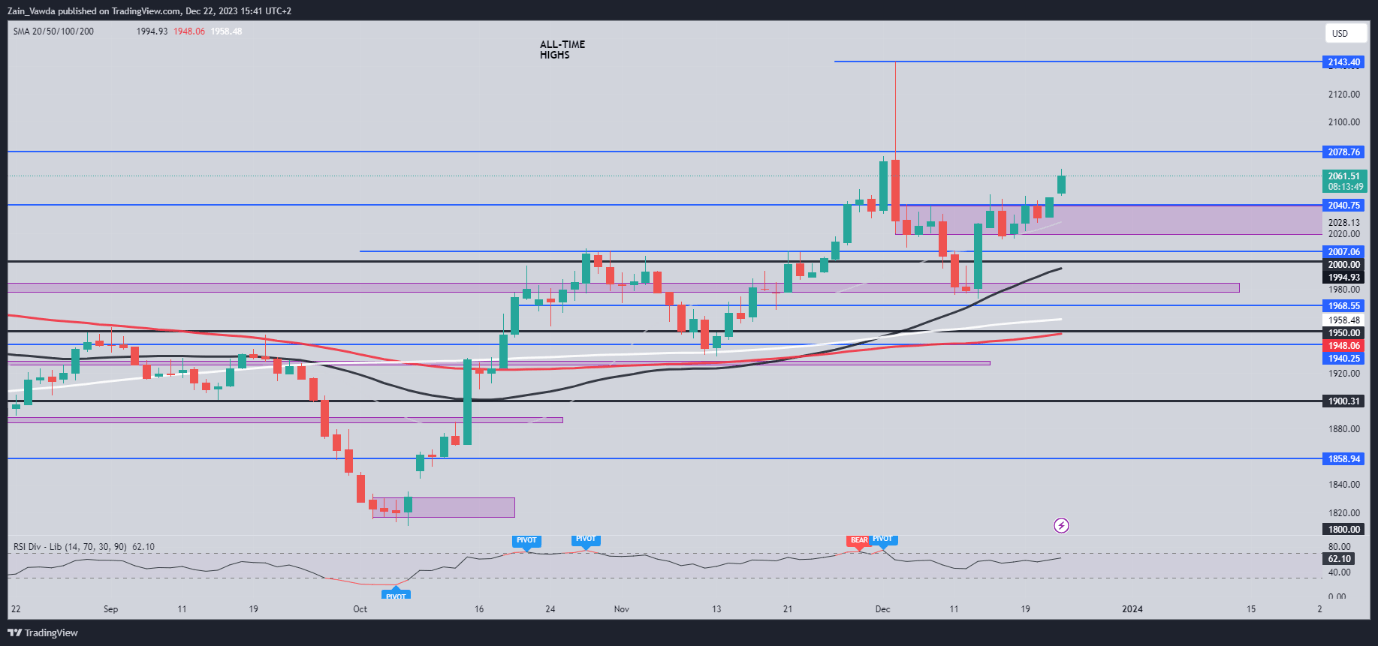
Following the data release the dollar index extended its slide with Gold proving to be a beneficiary. Gold prices spiked to an immediate high around the $2066-$2068/OZ area before some pullback.
Earlier in the week I had discussed how a potential breakout may require a catalyst and US data over the last two days have finally provided a shot in the arm. Immediate resistance above the $2068 area rests in the $1978-$1983 area and this could prove a sticky point if we do arrive there later today.
- 2078
- 2100
- 2125
- 2050
- 2041
- 2030