GOLD PRICE FORECAST
- Gold prices advance following disappointing U.S. economic data
- All eyes will be on the U.S. PPI report on Friday
- This article explores key tech levels to keep an eye on in XAU/ USD
Gold prices (XAU/USD) rose and reclaimed the psychological $2,000 level on Thursday, propelled upward by a weaker U.S. dollar and depressed U.S. Treasury yields in the aftermath of lackluster U.S. macro data. By way of context, January U.S. retail sales disappointed estimates, contracting 0.8% instead of the expected 0.1% decline, a sign that household consumption is starting to soften.
Under normal circumstances, weaker consumer spending might prompt the Fed to expedite policy easing; however, the current landscape is far from ordinary, with inflation running well ahead of the 2.0% target and displaying extreme stickiness. For this reason, policymakers might refrain from taking preemptive action in response to indications of economic fragility.
With the U.S. central bank singularly focused on restoring price stability and prioritizing this part of its mandate for now, traders should closely monitor the upcoming release of the producer price index survey on Friday. Forecasts suggest that January's headline PPI eased to 0.6% year-on-year from 1.0% previously, and that the core gauge moderated to 1.6% from 1.8% in December.
While subdued PPI figures are likely to be bullish for gold prices, an upside surprise mirroring the results of the CPI report unveiled earlier in the week , which depicted stalling progress on disinflation, should have the opposite effect. In the latter scenario, we could see yields and the U.S. dollar rise in tandem, as markets unwind dovish interest rate bets. This should be bearish for precious metals.
GOLD PRICE TECHNICAL ANALYSIS
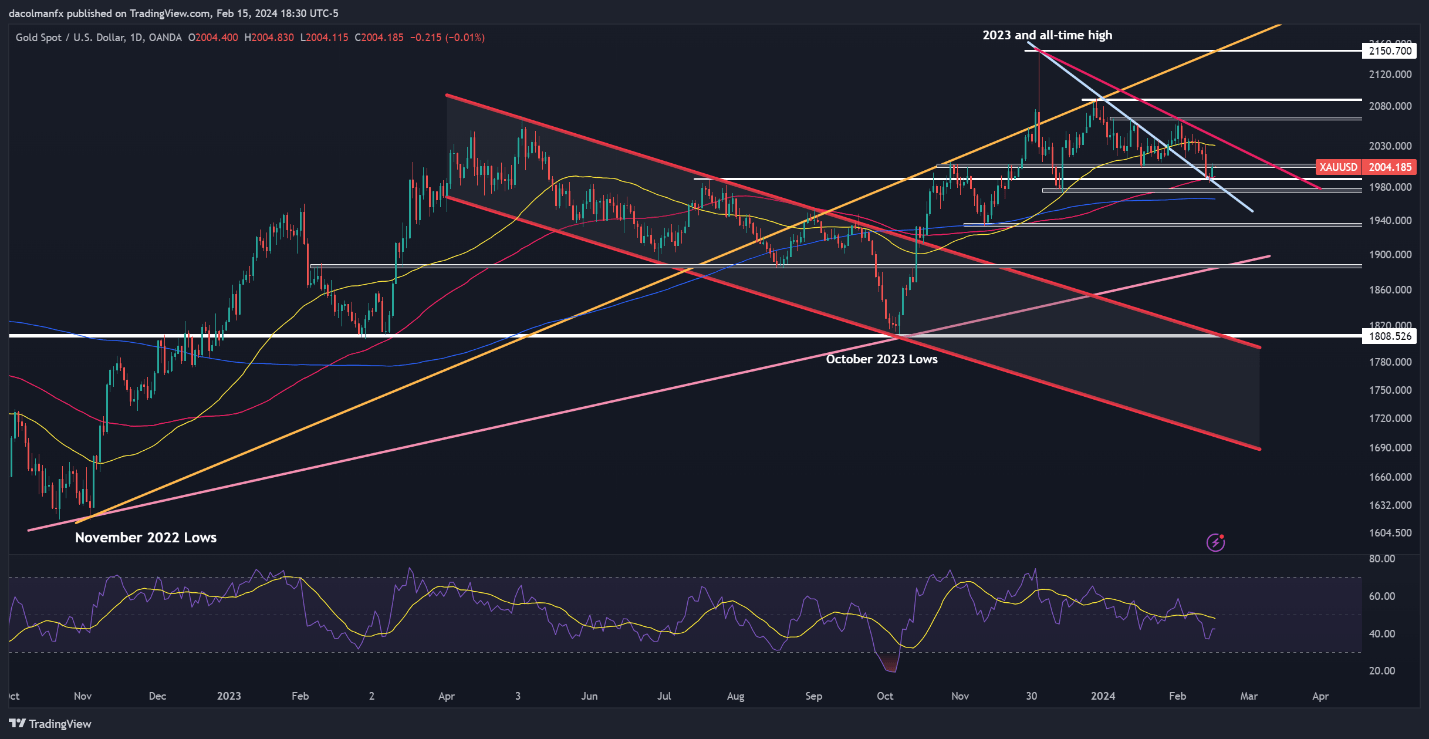
Gold advanced on Thursday after bouncing off confluence support at $1,990, with prices pushing towards technical resistance at $2,005. If the bulls manage to clear this barrier in the coming days, we could see a rally towards the 50-day simple moving average at $2,030. On further strength, all eyes will be on $2,065.
On the other hand, if sellers regain the upper hand and trigger a bearish reversal off current levels, the first floor to watch looms at $1,990, followed by $1,975. From here onwards, additional losses could shine a spotlight on the 200-day simple moving average near $1,965.
GOLD PRICE CHART – TECHNICAL ANALYSIS