Gold, VIX, and Tesla Latest Outlooks and Analysis
- The VIX falls 27% from Friday’s high
- Tesla rallies 14% after hours despite missing expectations.
- Gold pops higher on a weaker US dollar .
For expert Q2 US dollar analysis, download our complimentary guide below:
For all economic data releases and events see the Economic Calendar
The feelgood factor remains across a range of risk markets with equity indices brushing off last week’s sell-off and pushing further ahead. The current lull in the Israel-Iran conflict is helping market sentiment while positive US earnings are adding to the move. Three important US data releases this week – durable goods (today), US Q1 GDP (Thursday), and US Core PCE (Friday) – may derail the current move. There are also some heavyweight US companies reporting earnings this week, including IBM, Meta, Alphabet, Intel, and Microsoft.
The VIX highlights the recent change in mood with the closely followed ‘fear gauge’ falling by over a quarter from Friday’s high print.
What is the VIX? A Guide to the S&P Volatility Index
VIX Daily Price Chart
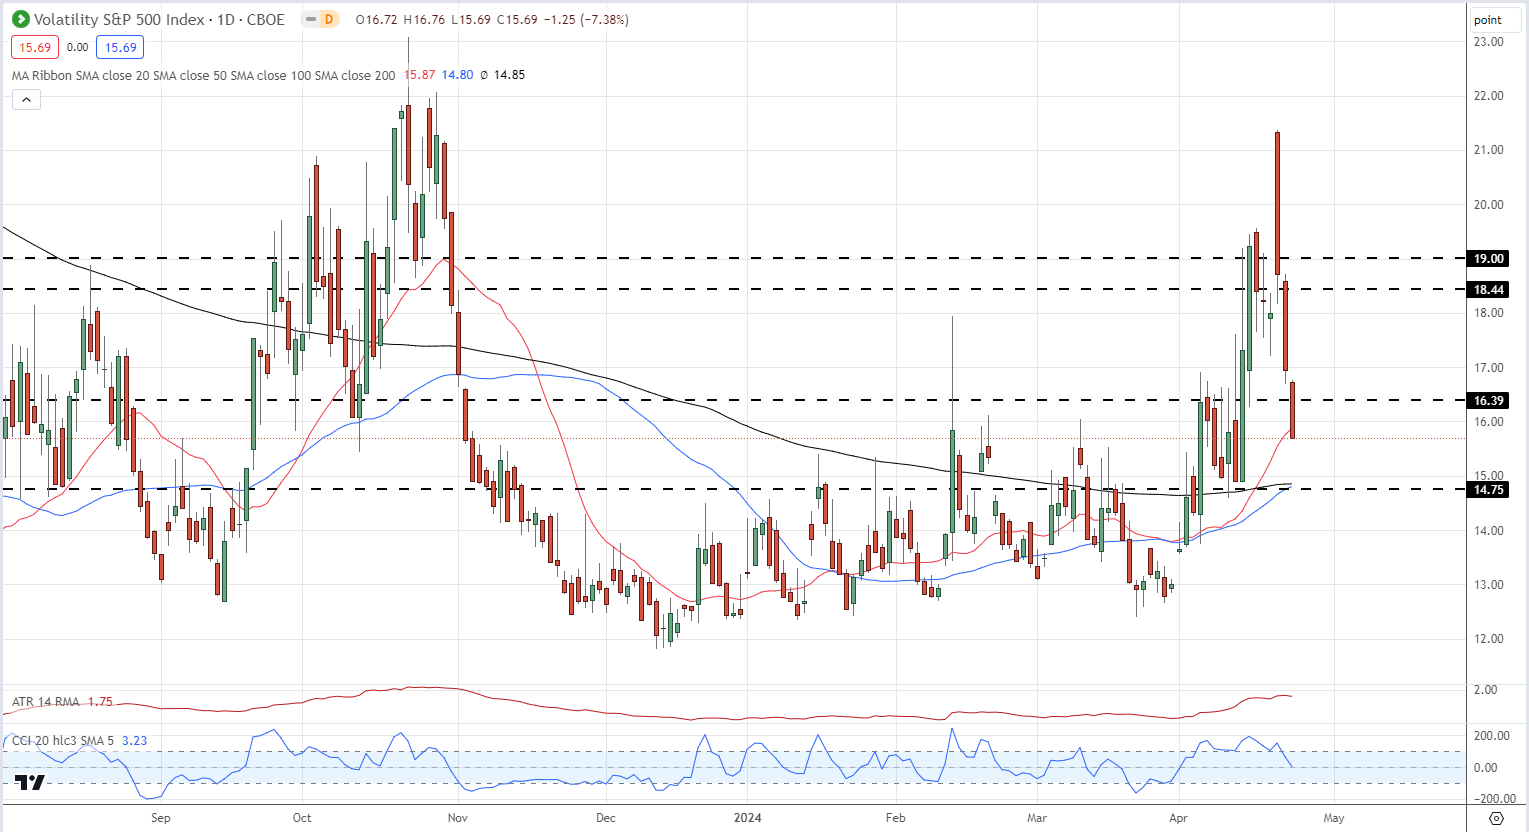
Chart by TradingView
Overnight price action in Tesla (TSLA) underlines the risk-on sentiment with the EV car giant up 14% after hours. Tesla dropped its latest results yesterday and missed both revenue and profit expectations. Markets however ignored traditional metrics and instead were buoyed by the company’s decision to bring forward the launch of its more affordable new models from the second half of 2025, although no dates or pricing details were announced.
Keep informed of all earnings releases with the Earnings Calendar
Tesla Dollar Index Daily Chart
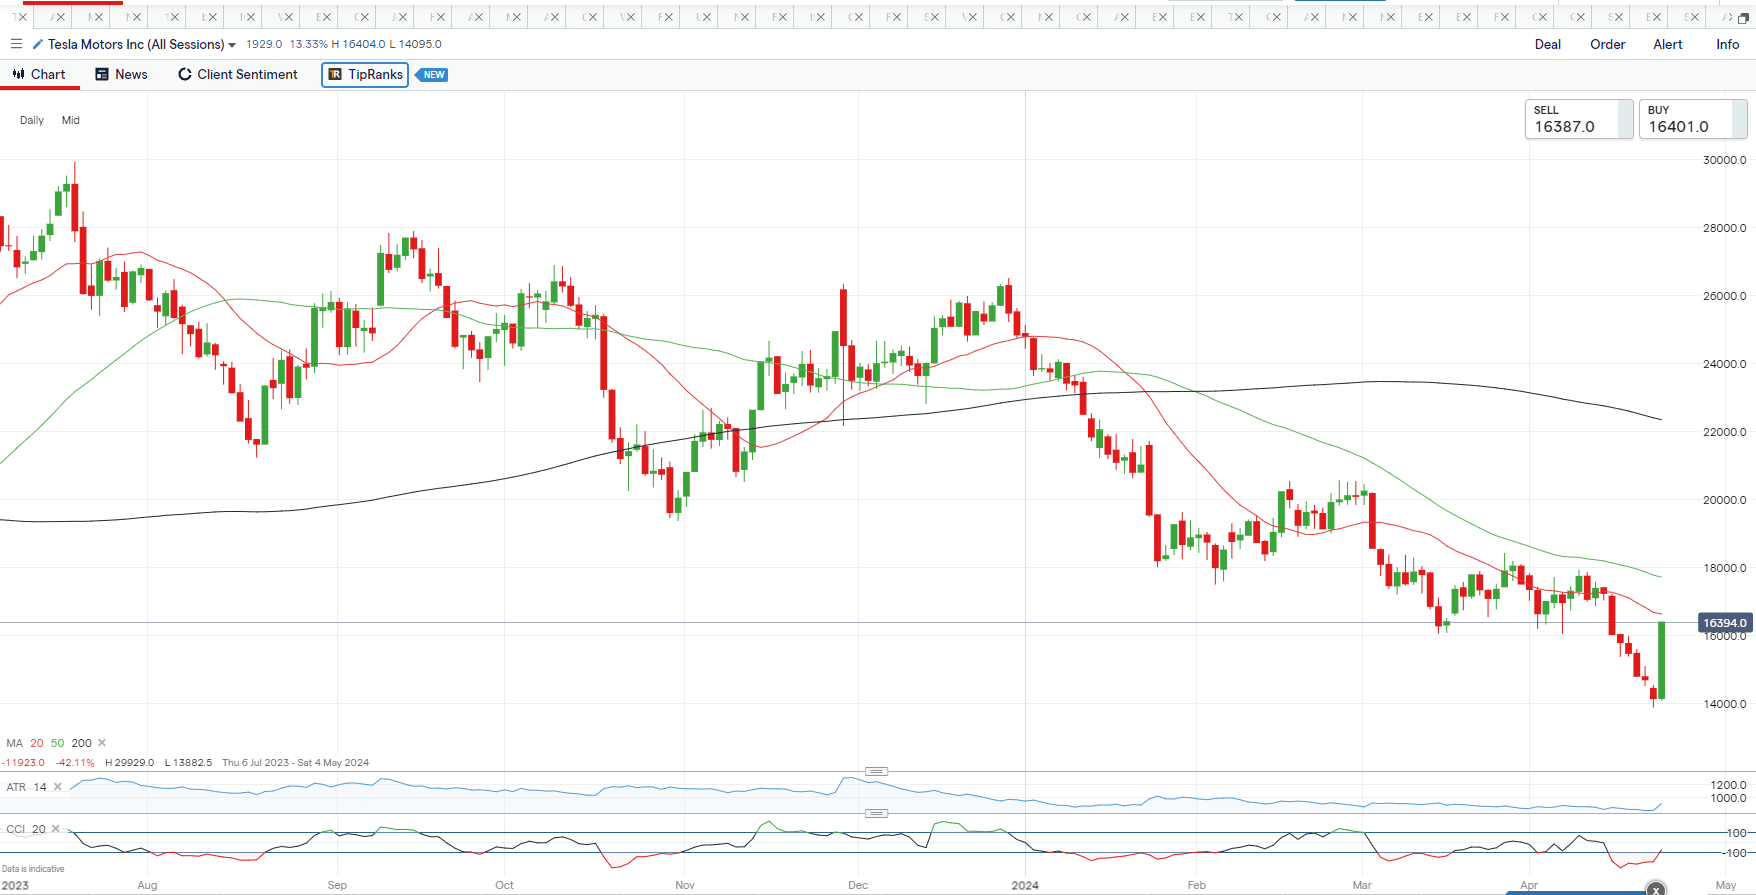
Chart by IG
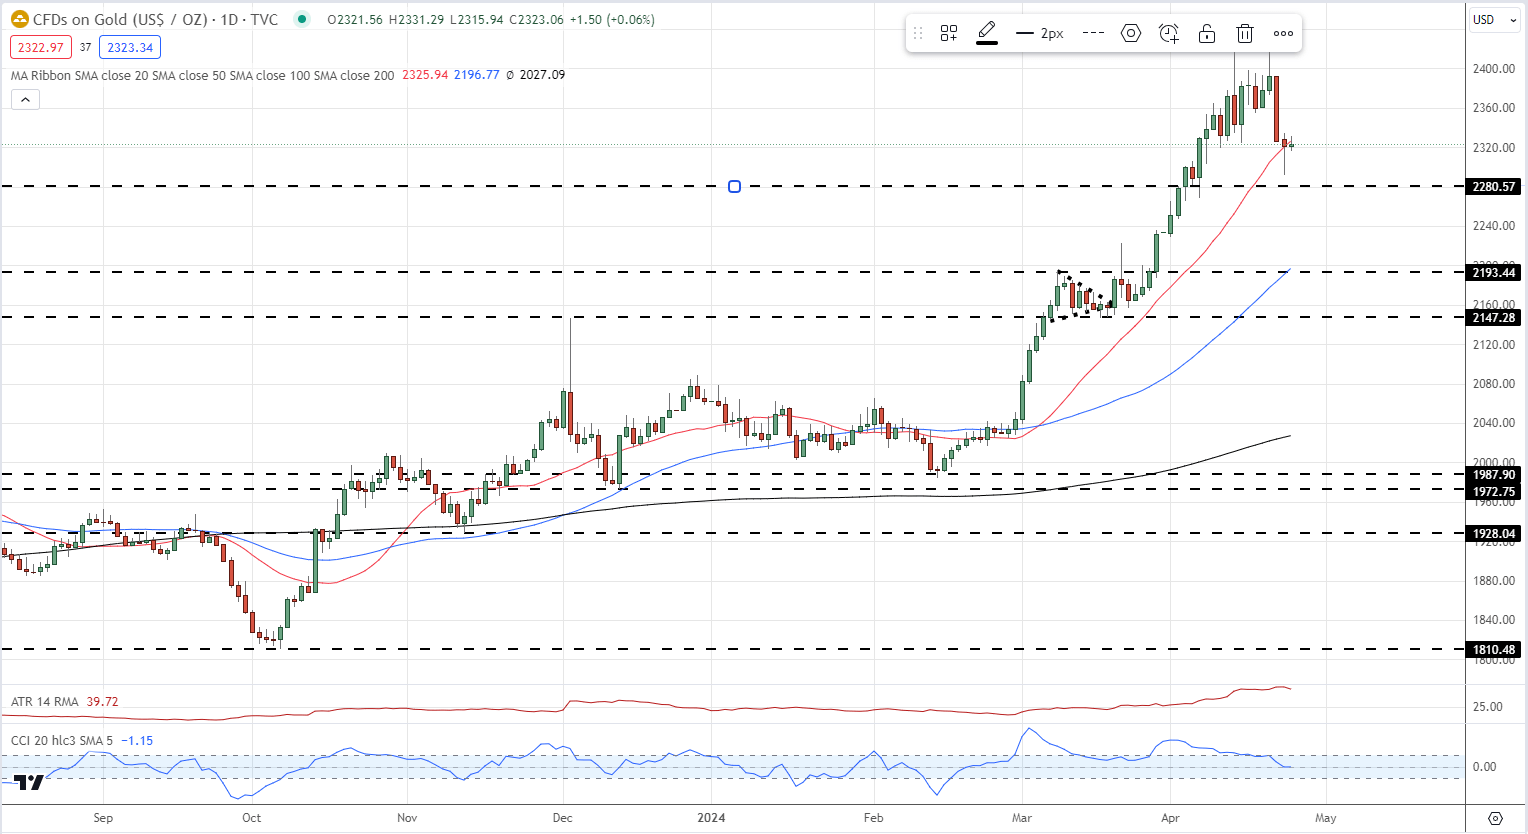
Tuesday’s weaker-than-expected US PMIs sent the US dollar lower, propping up a range of USD pairs and gold and silver . Gold has had a relentless bid over the last few weeks as investors moved into haven assets as the conflict in the Middle East worsened. Gold broke below $2,300/oz. yesterday but quickly recovered after the release of the weak US PMIs. Below this level, $2,280/oz. comes into focus. All eyes are now on US data.
US Dollar Rattled by Weak PMIs, US GDP and Core PCE Remain this Week’s Key Drivers
Gold Daily Price Chart
IG Retail Sentiment shows 52.79% of traders are net-long with the ratio of traders long to short at 1.12 to 1.The number of traders net-long is 3.25% higher than yesterday and 1.69% higher than last week, while the number of traders net-short is 8.16% higher than yesterday and 7.99% lower than last week.
We typically take a contrarian view to crowd sentiment, and the fact traders are net-long suggests Gold prices may continue to fall.
See the Full Report Below:
| Change in | Longs | Shorts | OI |
| Daily | 7% | -1% | 4% |
| Weekly | 36% | -26% | 3% |