US Dollar Analysis and Charts
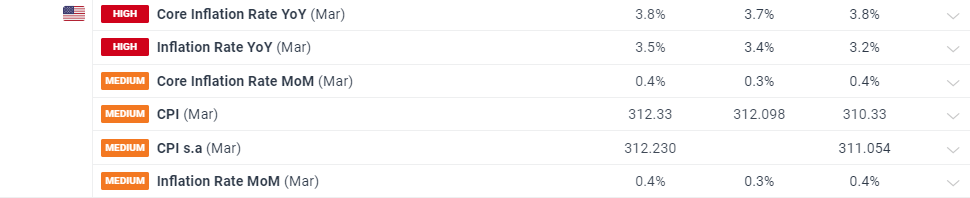
- US headline inflation y/y rises to 3.5% in March from 3.2%.
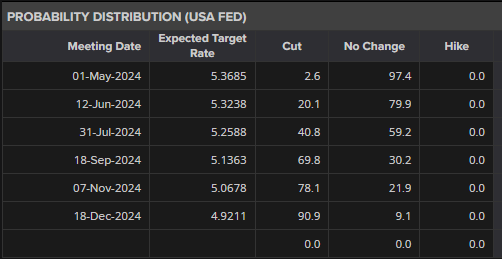
- June rate cut priced out, July cut now just seen at 40%.
For all major central bank meeting dates, see the Central Bank Calendar
You can download our free Q2 US Dollar Technical and Fundamental Forecasts below
US inflation turned higher in March with the annual headline figure now seen at 3.5%, above forecasts of 3.4% and February’s 3.2%. Monthly inflation rose by 0.4%.
For all economic data releases and events see the Economic Calendar
According to the US Bureau of Labor Statistics, ‘Over the last 12 months, the all items index increased 3.5 percent before seasonal adjustment. The index for shelter rose in March, as did the index for gasoline. Combined, these two indexes contributed over half of the monthly increase in the index for all items. The energy index rose 1.1 percent over the month. The food index rose 0.1 percent in March. The food at home index was unchanged, while the food away from home index rose 0.3 percent over the month.’
US rate cut expectations were pared back sharply after the inflation release. Going into the numbers, the June 12th meeting was shown as a 50/50 chance of a 25bp rate cut, this has now been downgraded to just 22%. The July meeting is now showing just a 40% chance of a rate cut.
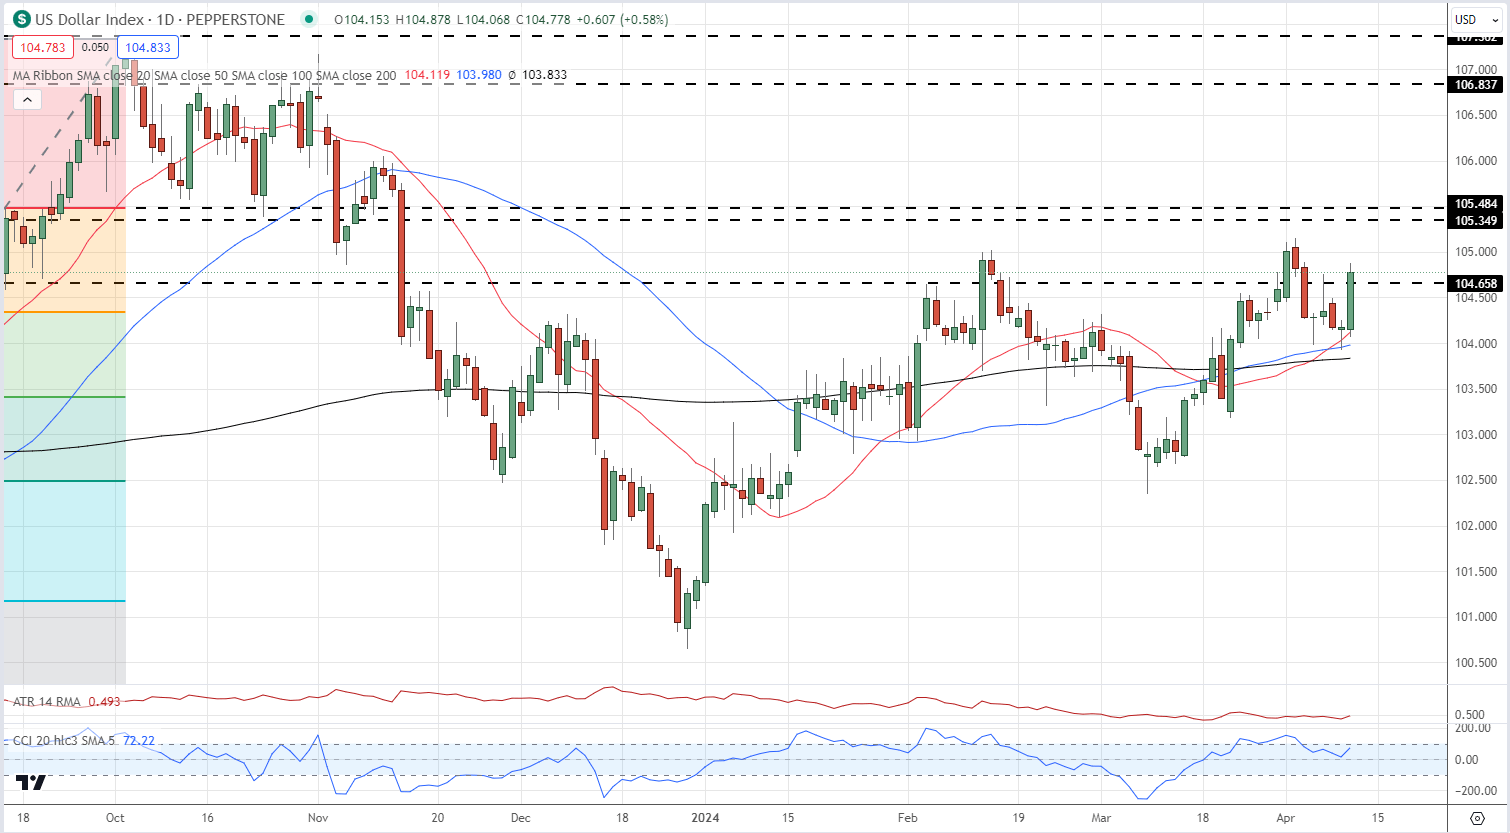
The US dollar index jumped by around 60 pips post-release…
US Dollar Index Daily Chart
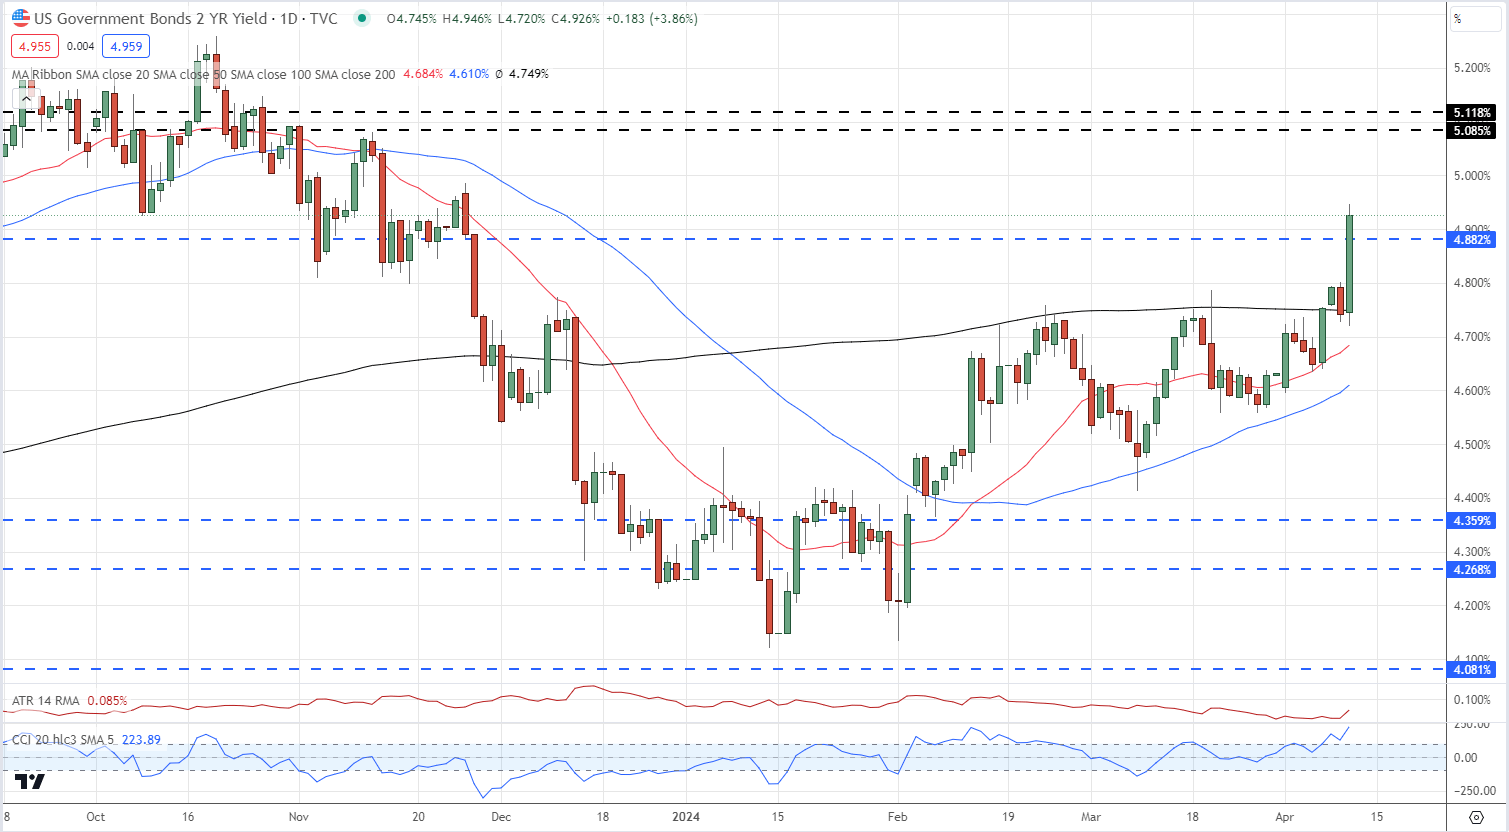
…the yield on interest rate-sensitive UST 2-year soared by 18 basis points to a multi-month high of 4.93%...
UST 2-Year Yield
…while gold shed $10/oz.
Gold Daily Price Chart
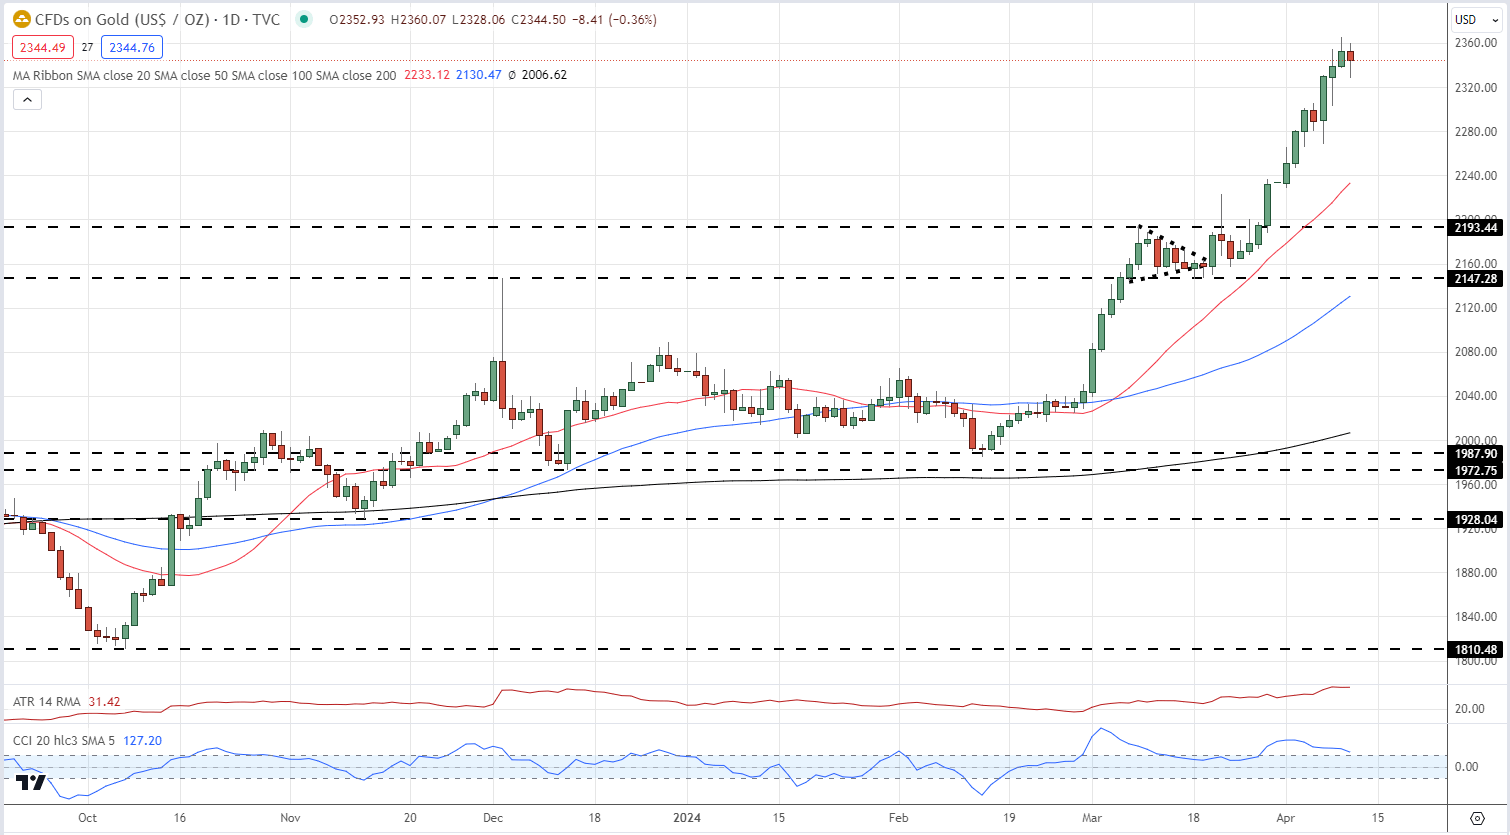
Gold Rally Continues, US Inflation Data the Next Obstacle to Clear
All Charts via TradingView