US Dollar Price and Charts
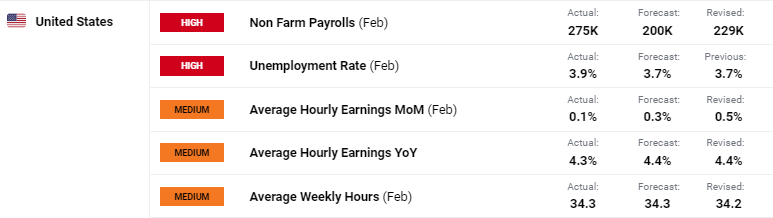
The headline NFP number beat market expectations by a healthy margin but this was more than compensated for by a steep downward revision to January’s release. In February, 275k new roles were created compared to market forecasts of 200k, while the January figure of 353k was revised down to 229K, a difference of 124k. The unemployment rate rose to 3.9%, compared to a prior level and market forecast of 3.7%, while average hourly earnings fell to 0.1% compared to 0.3% market consensus. Aside from the headline NFP figure, this month’s report shows a weaker-than-expected US labor market, and underpins market expectations of a 25 basis point cut at the June 12th FOMC meeting.
For all economic data releases and events see the Economic Calendar
The US dollar slipped further release and is currently resting on the 61.8% Fibonacci retracement level around 102.50. A cluster of old highs and lows around 102.00 may slow any move lower before the 71.8% Fib retracement at 101.17 and the December 28th multi-month low at 100.74 come into focus.
US Dollar Index Daily Chart
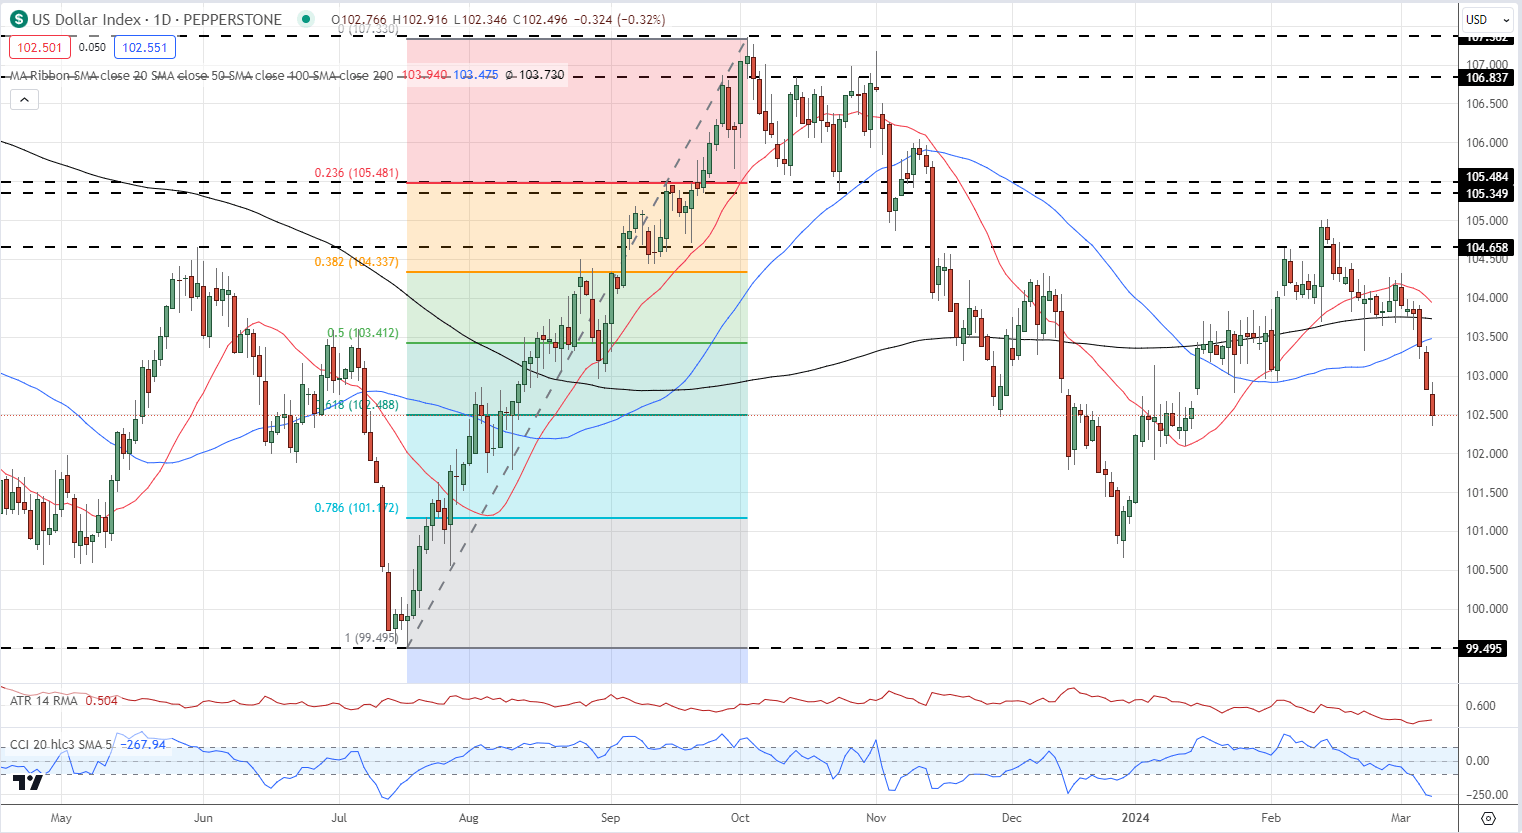
Charts via TradingView