GBP/USD and EUR/GBP Analysis and Charts
- Fed and ECB seen cutting rates in June, BoE in August.
- Rate differentials will support Sterling against the USD and Euro .
Most Read: Markets Week Ahead - Gold Soars, Rate Cuts Near, Nasdaq and Nvidia Wobble
Growing expectations that both the Federal Reserve (Fed) and the European Central Bank (ECB) will start cutting interest rates in June, while the Bank of England (BoE) waits until August, have driven Sterling higher against the US dollar and the Euro in the past couple of weeks. Current market predictions show a 73% chance of a US rate cut , and a near 100% chance of the ECB cutting by 25 basis points, while the BoE has a 50% chance of a June cut. The UK central bank is fully expected to cut rates by 25bps in August. With UK rates seen staying higher for longer, Sterling has reaped the benefit with GBP/USD hitting a multi-month high at the end of last week, while EUR/GBP is touching a notable range low.
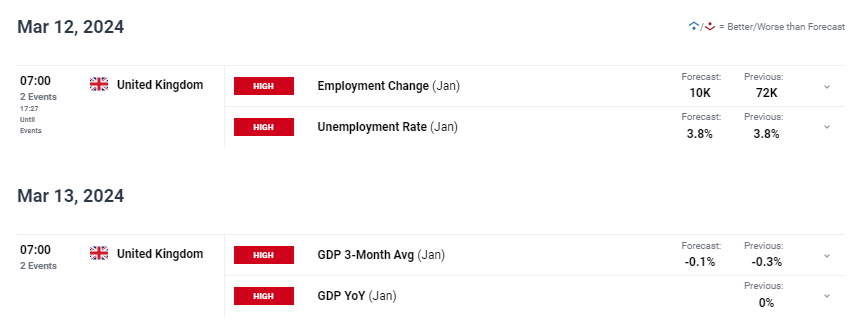
UK rate expectations may change if this week’s economic data shows the UK economy performing above current expectations. The unemployment rate remains close to the 3.5% multi-decade low, while UK growth continues to stumble. A pick-up in both growth and the unemployment rate will not change the BoE’s thinking at next week’s MPC decision but may prompt the UK central bank into changing its current rate cut narrative.
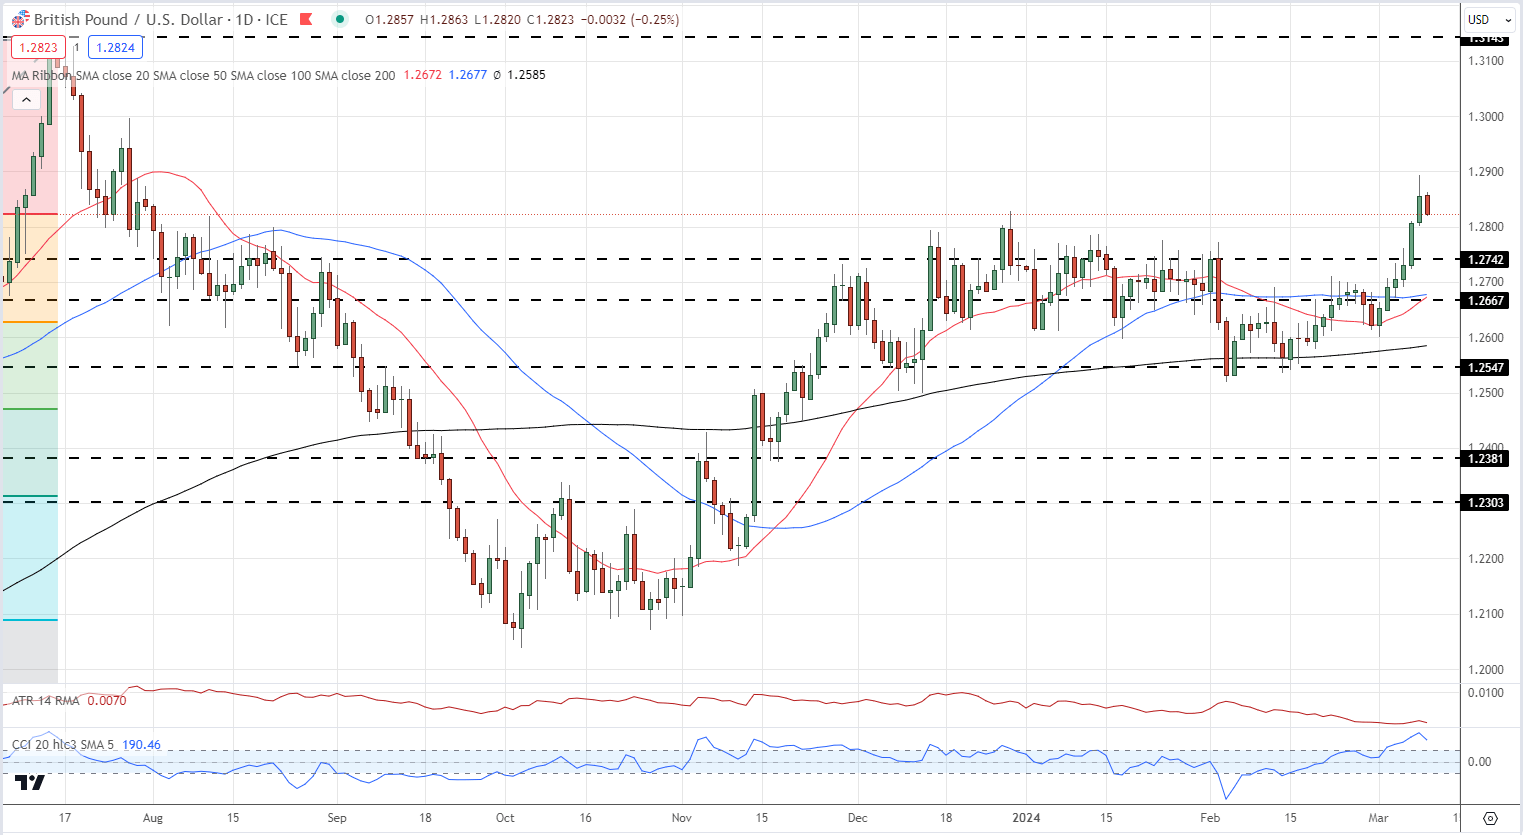
GBP /USD hit 1.2894 last Friday - a seven-month high - before settling lower and currently trades around 1.2825. A prior block of highs in the 1.2740 to 1.27.80 area should slow any move lower, while there is little in the way of resistance before 1.3000 comes into play. The CCI indicator shows the pair as overbought in the short-term, although turning lower after last Friday’s high print.
GBP/USD Daily Price Chart
See How IG Client Sentiment Can Help Your Trading Decisions
| Change in | Longs | Shorts | OI |
| Daily | 0% | -9% | -4% |
| Weekly | 2% | -6% | -1% |
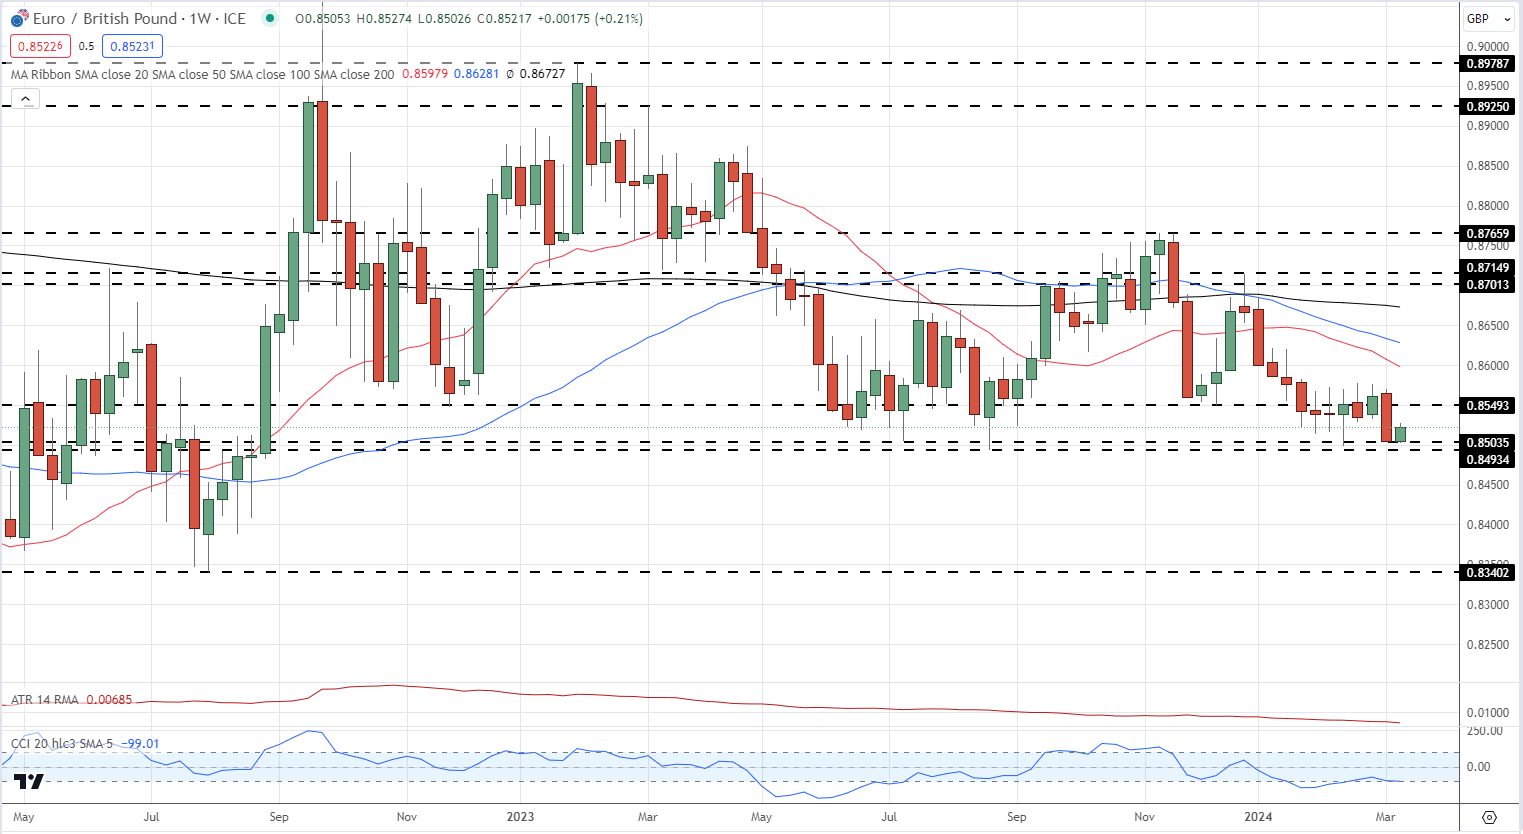
EUR/GBP is testing an area of support around the 0.8500 area that has been held over the past few months. A look at the weekly chart shows that if this support is broken, then 0.8340, the August 2022 swing low, comes into play.
EUR/GBP Weekly Price Chart