Welcome to the Artificial Intelligence Outlook for Forex trading.
U.S. Dollar Index
Okay, hello everyone, and welcome back. My name is Greg Firman, and this is the Vantage Point AI Market Outlook for the week of August 26, 2024.
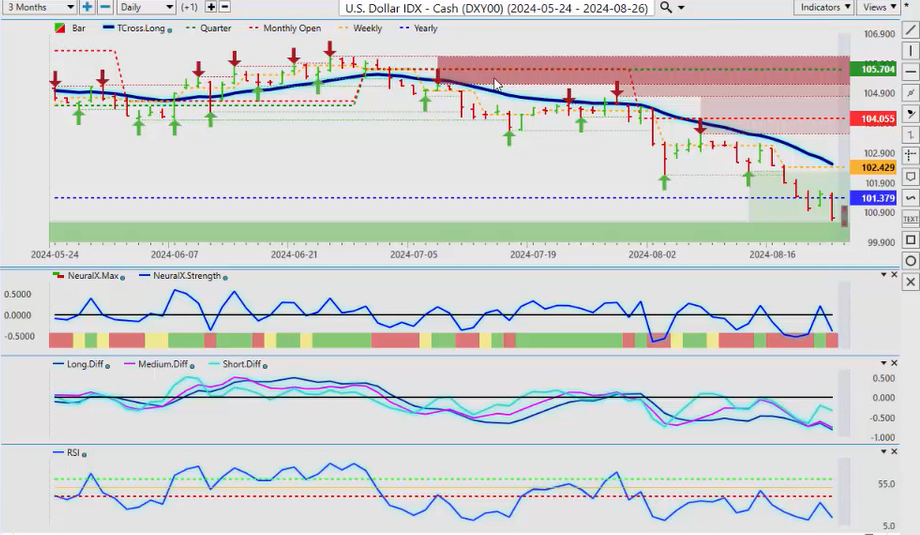
To get started this week, we’ll begin where we always do with that very important US Dollar Index . Now, the dollar is coming under significant selling pressure this week once the market had realized that the labor report over the last year has been fudged, and the US has actually lost about 68,000 jobs per month over the last 12 months. So that’s prompted the Fed to respond, and it is likely going to cut rates in September, but we already knew that anyway. So, the question is: can the dollar’s downside momentum continue? Right now, our current yearly opening price—this is the level we want to watch next week—if the Dollar Index can stay below 101.37. But, the further we move away from the T cross long at 102.53, the more likely it is we’re going to have a retracement back to this particular level. Now, the month of September, from a seasonal standpoint, usually favors the US dollar, even with the Fed rate cut. I believe that that’s already been worked into the price now, and we could still see the dollar turn around after Labor Day.
S&P 500 Index
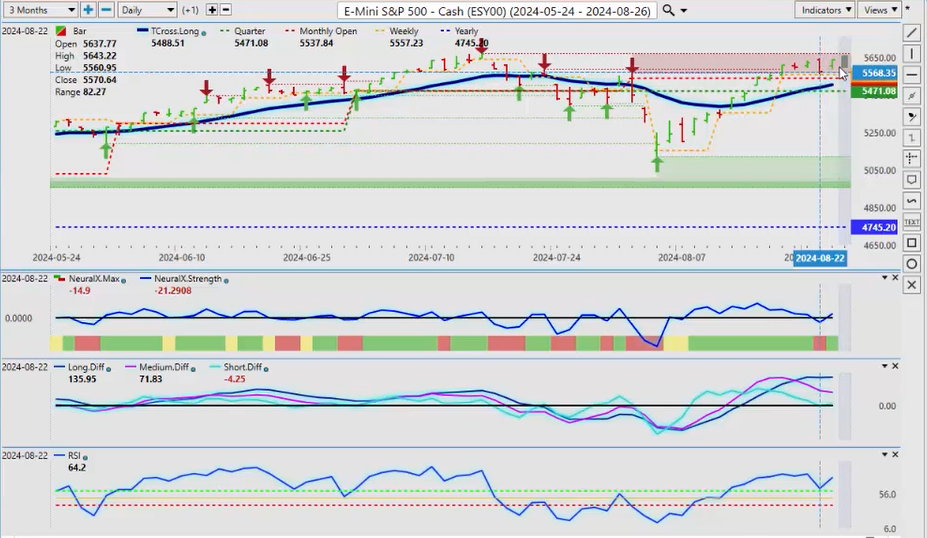
So, what I will do is look at the inverse correlation between the Dollar Index and the S&P 500 , meaning dollar down, stocks up. Well, that didn’t really happen as much as we would have thought. And as you can see, we have an MA diff cross in the VP software; this is a contrarian reversal indicator. Now, this is very likely only a corrective move lower, but a very mixed bag here, and we want to watch this going into next week’s trading because this is warning that the equity markets are actually not as strong as they appear to be. So, our retracement point, the T cross long 5503, that is very, very close to our quarterly opening price, coming in at 5471. We want to make sure we’re holding above this particular level if we’re buying stocks because, again, we’ve got a number of verified resistance zones up here, 5669. This is a significant level here that we would have to overtake. So once again, we can see the bulk of the trading week; we’ve been holding just below that particular area, and now the contrarian indicator has basically warned us to be very, very cautious with longs here because, in most cases, stocks struggle in September because of that period of required dollar buying in the US at the end of the US fiscal year, which concludes the fiscal fourth quarter for the US, concludes on October 1, and that’s when we would look for more significant dollar weakness. So, be very, very cautious with this.
Gold
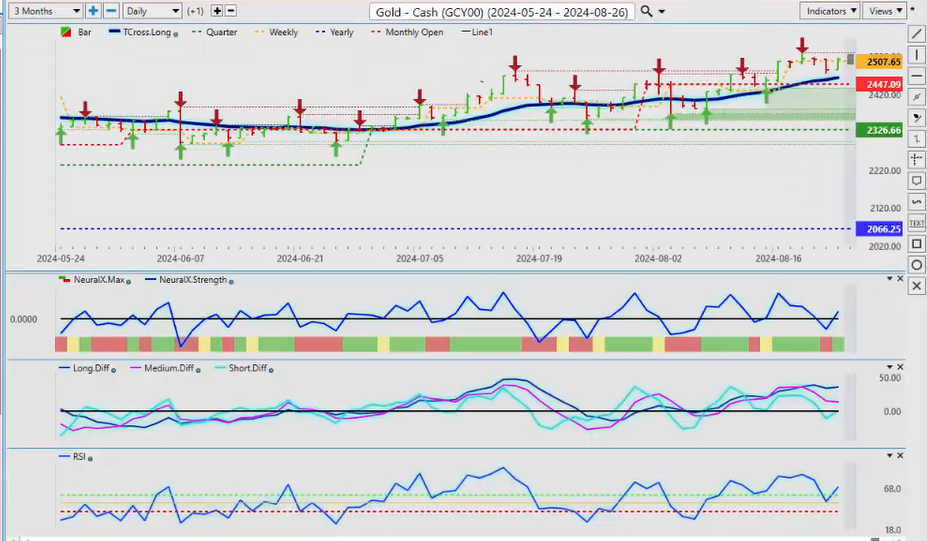
Now, the other thing we can contribute or look at here is Gold . With the dollar selling off significantly, gold has moved higher on Friday, but nothing significant, which I find interesting. We are, it is a strong close at 2511, but in most calendar years, I’m looking at Gold longs more towards late October, mid-November, and then end of December. But if the Fed, and the Fed, in my respectful opinion only, the Fed will not cut 50 basis points; that would be a huge mistake. Slow and steady wins the race. I don’t believe he will react to some of these rumors, emergency Fed meeting, no, he has shot that rumor down. A 50 basis point cut, he’s not agreeing with that. So, we’re hearing a lot of rumors from the media that, in again, in my respectful opinion only, they’re false; it’s a false narrative. But the jobs number, where they’ve cooked the books in the US over the last year, that is real, that’s significant, and what happened on Wednesday is largely what has triggered recession fears now. So again, if you go into a recession, Gold usually does very well, and equities don’t. So right now, as long as we’re above the current monthly opening and the T cross long, but we should be aware that we could see some dollar strength in September; that’s a reasonable warning.
Bitcoin
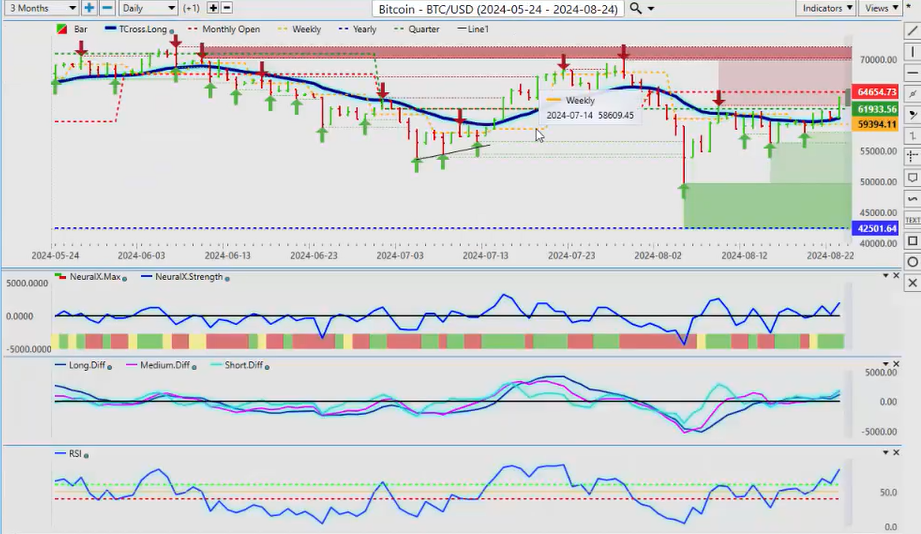
Now when we look at Bitcoin , again, Bitcoin has responded very positively, but you can see that we’re coming off that T; we closed above the T cross long over here on August the 20th, and then every single day, we retrace back to the VantagePoint predicted moving average. Now, a big hurdle for next week will be to get above 64.654. Once again, the seasonal pattern which I’ve discussed on here with Bitcoin is usually the end of September and October. So I would be cautious; longs still look good, but you want to be careful and identify critical levels. So our T Cross long 60,344—that’s the level we need to hold above next week if we are going to continue to buy Bitcoin at these particular levels.
Light Sweet Crude Oil
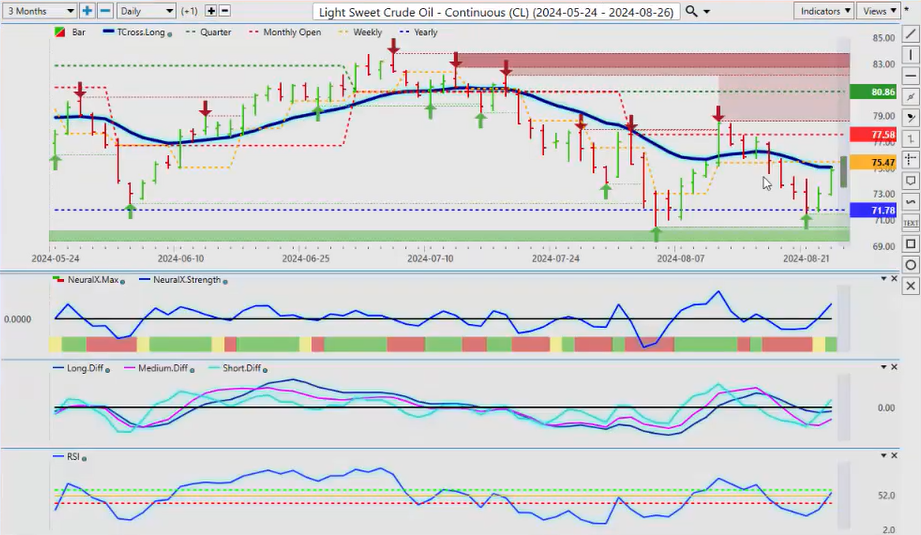
Now Light Sweet Crude Oil , once again, we’ve come off the yearly opening price. Now, this is the importance of using a proper anchor point, guys. The current yearly opening price—we want to stay away from the rolling performance model because it can be very misleading. What a market has done over the last random 30 days, the last random 5 days, we need proper anchor points. But again, in most cases, oil doesn’t fare well in September; natural gas starts to pick up steam. So, you can see that we’ve come down to the current yearly opening price in June, and that’s during the normal seasonal pattern with oil, and we had a nice run on that. We’ve come back down to the current yearly opening price again on August the 5th, and we’ve had a very shallow rally. We’ve come down to it yet again, 2 days in a row, and we had buyers coming in at the current yearly opening price 71.59, but we’re failing exactly at the TCross long. But the main thing we want to look at here: are we making, after these retracements from the yearly opening price, are we making higher highs? No, we’re not; we’re making significantly lower highs. So, I would anticipate that there will be some buying in oil for the next week or two, and that’ll be about it, guys. And then we would look to switch over to natural gas. But again, the main crossovers, the pink line, the blue line, they are still below the zero line; we do not have a medium-term crossover, and this, at least for now, appears to be corrective in nature. And again, that quarterly opening price, if we somehow manage to get to 80.86, that would be a fantastic selling opportunity.
DAX
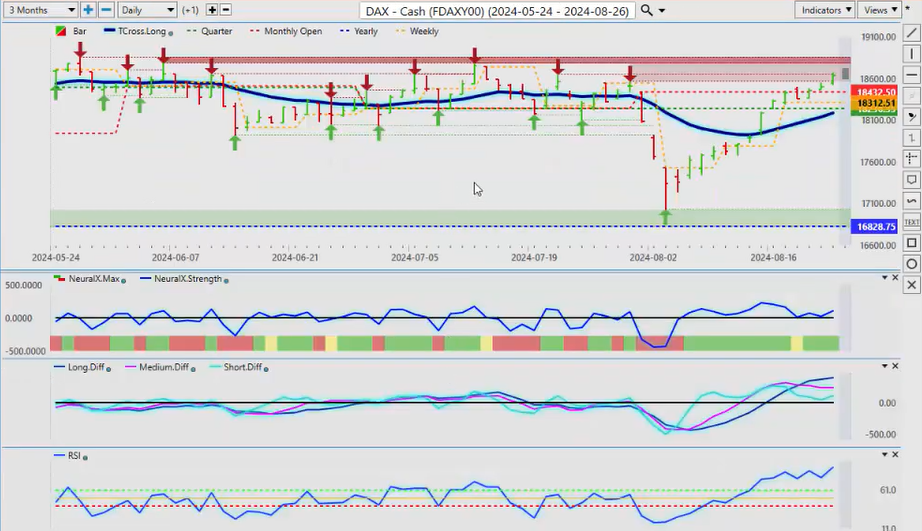
Now, when we look at the European equity markets, again following the S&P 500 , and I would argue they’re slightly more bullish than the S&P and the NASDAQ . So the DAX is looking pretty good; however, we see that same ominous contrarian signal in VP. The medium-term trend, which is the pink line, the strength of that is losing strength against the longer-term up move. So again, when we look at this, right now, we have the exact same signal on the DAX that we do on the S&Ps . So either they’re both right or they’re both wrong, but the point is, both the European equities and the S&P 500 are both up against significant resistance levels from July the 12th, and both, both equity markets, both indices, excuse me, need to clear this level if we’re going to go higher. I think that’s going to be a very tall order in the month of September because just because the Fed is going to cut doesn’t necessarily mean that’s the green light for equities to go in September. I believe that will be more towards October and November once we get past the dollar buying. But for now, that resistance high 18,779 is absolutely critical.
Volatility Index ($VIX)
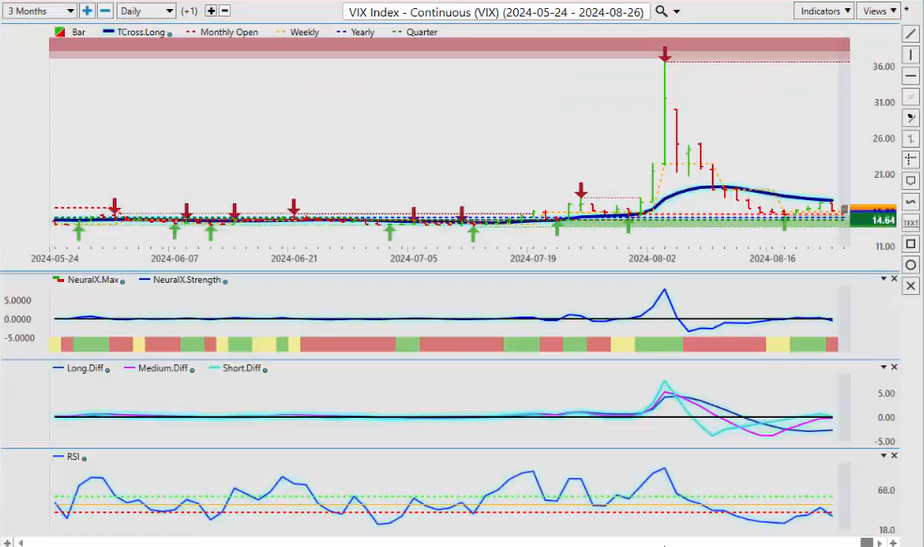
And to further sweeten the pot on this deal, we need to look at the VIX . What is the VIX doing here? So the VIX again remains below the T cross long, but all of my key anchor points—the yearly opening, the quarterly opening, the monthly—the VIX remains above those levels, and that is a huge warning sign. And the reverse contrarian signal, the VIX is showing, technically, a buy if we look at this pink line if it crosses the zero line. That’s telling me I’ve got a medium-term crossover. So once again, here, this is a mixed bag, but using correct anchor points because price action is indiscriminate; it is objective. A line in the sand: okay, are we below the yearly opening price? Then the VIX is bearish. Well, we’re not below it; we’re above it. So we want to be very, very cautious with equities for the next few weeks, or particularly into next week’s trading. What we could see is the VIX sell off a little bit on Monday. Equities like the DAX , the NASDAQ , the S&P go higher on Monday, and then mysteriously on Tuesday, they collapse because, again, always remember, guys, this is an outlook, not a recap of something that’s already happened; we’re talking about next week’s trading while these markets are closed.
Euro versus U.S. Dollar
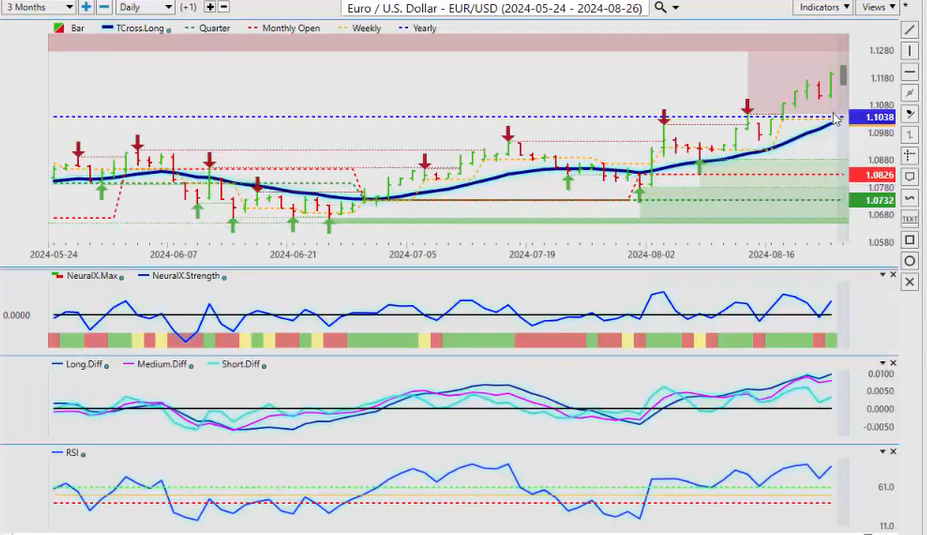
Okay, now when we look at some of our main Forex pairs, once again, all eyes are on Euro/US . The Euro/US pair accelerating for the first time this year over its current, over the current yearly opening price. So our main support—this is very easy to identify—1.1038. What I’m looking for, and another strategy you can use with your VP software, is I’m looking for the T cross long to actually cross over the yearly opening price. I believe that is going to be very, very difficult, but the levels are looking better. But September historically has not been good for the Euro, guys, and it’s because currencies are different than stocks and commodities. Nobody has to buy a stock, nobody has to buy an option contract, nobody even technically has to buy a commodity, but they have to buy fiat currencies. Okay, and in most cases, the US is buying dollars; a lot of people are buying US dollars in the month of September. So be cautious here, but that’s our retracement point, our T cross long 1.1013. So all our support is there. If I click on the F8 in my software in VP and use the long-term crossover with just the blue line, you can see that I can get an additional support level for potential buying opportunities. That comes in at 1.1113. So, that brings us up 100 pips. So, watch that level; if we break, then we know that we’re going back down towards the 1.10 area.
U.S. Dollar versus Swiss Franc
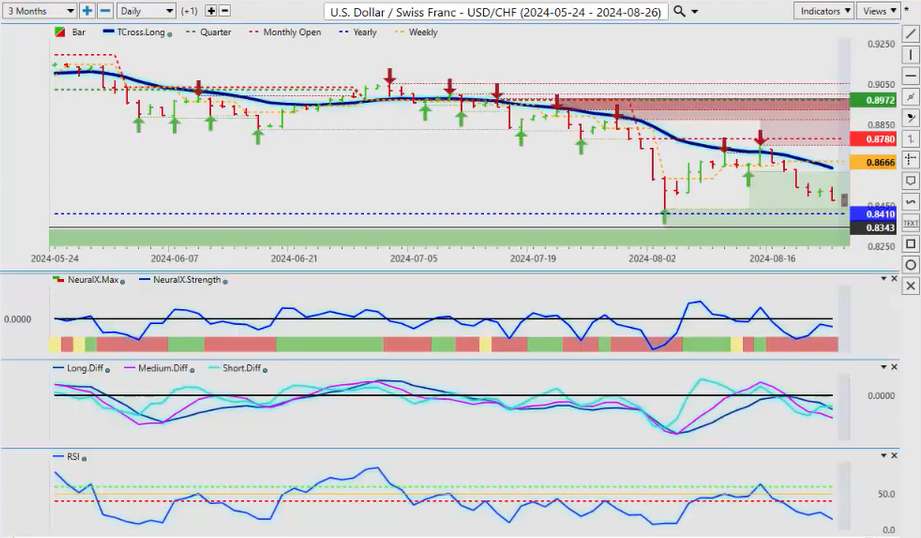
Now, US/Swiss Franc , once again, I believe that the carry trade is going to start to come unwound here, and two currencies we don’t want to sell in a scenario like that are the Swiss Franc and the Japanese Yen . So be careful here, but we are approaching a potential breakout point. The current yearly opening price—that’s 8410. If there’s going to be any buyers here, guys, that’s where it’s going to be, just like we saw over here on August the 5th. And that’s a period that I’ve coined ‘the dollar cycle,’ that I’ve coined the dollar is usually strong in the first week of the new month and then it sells off after the non-farm payroll number. I don’t see anything that’s going to change that, but in this particular scenario, this MA diff cross is showing we’re building downward momentum. Ultimately, I see 8410 breaking, probably within the next four to six weeks. So again, another way you can do this is set up sell orders below 8410, but I believe again the dollar will see some strength in the month of September, regardless of what the Fed does.
British Pound versus U.S. Dollar
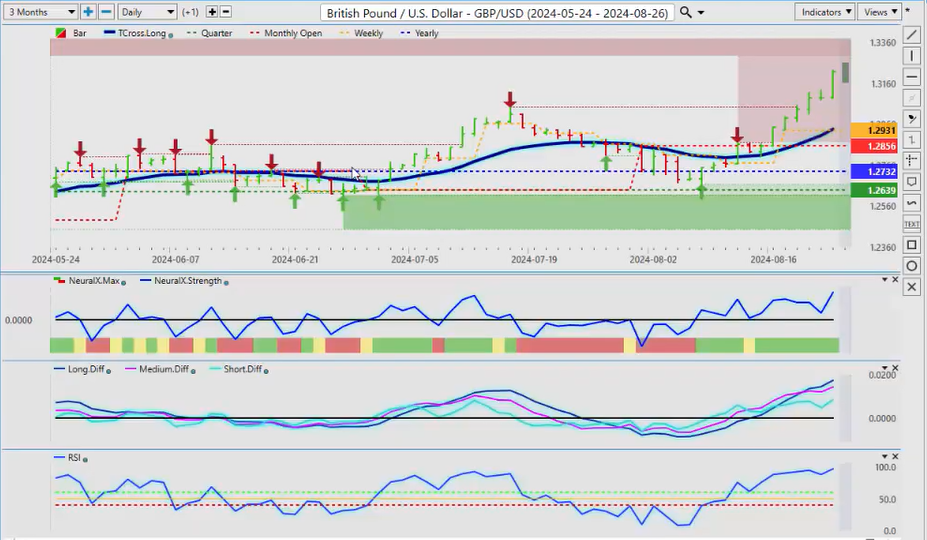
Now, the Pound/Dollar —again, this is all in the Forex market, guys—it’s mainly about buying or selling US dollars. If we have that fundamental understanding, then from there, we can make our decisions. But again, in my respectful opinion only, the Pound/Dollar has moved too far too fast; most of it based on rumors. The emergency rate cut, the emergency meeting with the Fed—somebody on CNBC, just this past week I believe it was Michelle Lee, corrected an analyst on there and said the Fed is having an emergency meeting in September. No, he’s not; that’s false, that’s fake news, guys. He’s having a scheduled meeting, and the Fed has even come out and corrected that statement, but it was good to see a reporter finally put a stop to some of the fake news and said there is no emergency rate cut, there is no emergency Fed meeting; there’s a scheduled meeting. So, I believe the Pound is going to start to potentially retrace because the further we move away from the VP predicted moving average, the T cross long at 1.2937, the more likely it is we’re going to retrace back to that area. So, the bigger this gap gets, the more attractive a potential short looks. And again, that contrarian signal remains present yet again here. The pink line over the blue line, the predicted RSI is sitting at 97.1—not a lot of room to move up here, guys. It doesn’t mean it can’t go higher, but the probability of a retracement is very, very high.
U.S. Dollar versus Japanese Yen
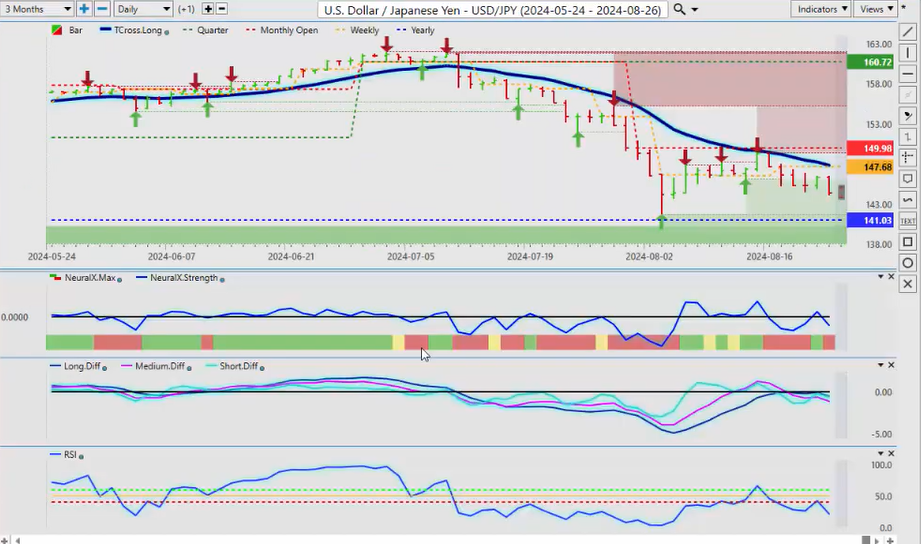
Now, when we look at the Dollar Yen , the Dollar Yen , we’re approaching another critical level that we tested over here on August the 5th, the current yearly opening price on the dollar. If we lose the yearly opening price, which I believe we will ultimately, then this pair could drop very, very quickly. And I’ve seen this carry trade fall apart before over the many years I’ve been in this business. So, I would be looking for areas to short on this thing. Our T cross long, 147.80, as long as we’re holding below that, but you can see that the quarterly opening price, 160, the monthly opening price 14.998, now I’m looking for that T cross long to continue to work its way towards 141, but I could definitely see a breach of 141 in October, November, and December of this particular calendar year.
U.S. Dollar versus Canadian Dollar
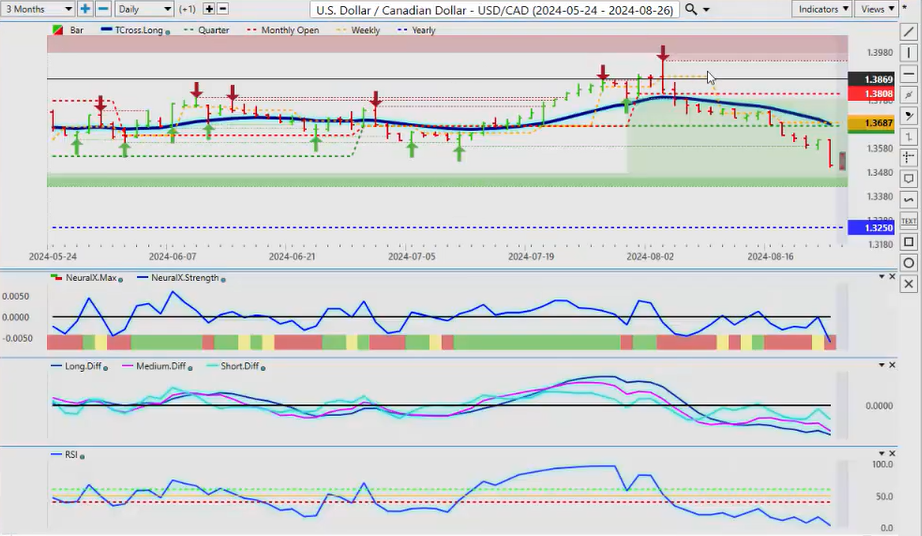
Now, with the US/Canadian , this particular pair, it too is basically taking advantage of dollar weakness, but make no mistake, the Canadian economy is far worse than the US economy right now, so I believe that while the Canadian Dollar will see some strength, it will be very little because in Canada here, the US is our biggest trading partner. So if they go in, if they sneeze, we catch a cold; if they go into recession, we really go into a recession. The Bank of Canada has already cut twice and is talking about cutting more. I don’t believe that will prompt the Fed to cut 50 basis points though. So the dollar still has that advantage over the Canadian Dollar to some degree. And again, if we have a contrarian signal on the equity markets, like the DAX , like the S&P , like the NASDAQ , the Canadian Dollar is feeding off of that equity strength. So, if it goes into a recession and the indices reverse, then the Canadian Dollar will reverse back to its upside. And this has been a pretty, hasn’t been a good year for the Canadian Dollar to say the least when you look at it going back from January 1. Again, this is how we use a proper anchor point, using our point and time indicator in BP. It only looks at the current yearly opening, the current monthly, the current quarterly, and the current weekly opening price. We need hard anchor points. So yes, we lost the quarterly opening price right there; that 132.50 is a potential target, but I don’t believe it will. I believe the Canadian Dollar will take a bigger hit than the US dollar will once the smoke clears from the Fed’s initial rate cut.
New Zealand Dollar versus U.S. Dollar
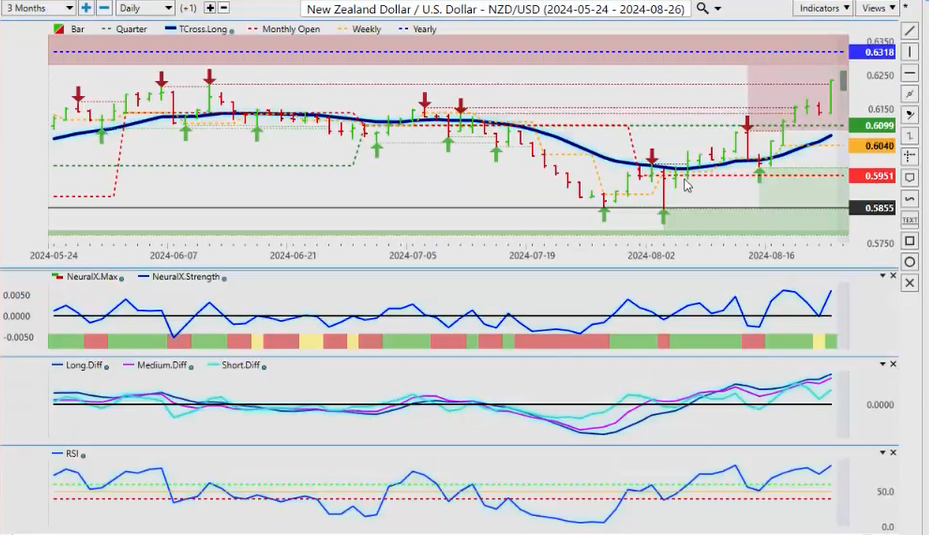
We saw this the other week, guys, with the Kiwi , right? And the Kiwi surprised the market by cutting, and the New Zealand Dollar sold right off but then it recovered, and I anticipate this could happen to the dollar also. They’re building in that rate cut; more than one rate cut right now is what they’re anticipating, two to three rate cuts into year-end. Uh, I think it’s a possibility, absolutely. I’ve said that since for months now. I’ve said that. But let’s wait and see what this data shows. But the release on Wednesday, if you go and look at it, the BLS had delayed that release; it was supposed to go at 10:00, didn’t come out till 10:30, several banks got that data before any of us did, and the media’s—I’m surprised the media isn’t talking more about it because basically the US actually lost a million more jobs than what they reported. So again, the shock wave from that is likely going to bleed into next week. But once again, the Kiwi remains below its yearly opening price the same way US/Canada remains above its yearly opening price. And if those global stock markets tank, they’re going to take down three currencies with them: the Kiwi , the Aussie , the CAD —they’re going to fall, guys. So we’ll see how this one plays out, but ultimately into next year, I think the Kiwi and the Aussie will do very well actually. But for the remainder of this year, 63.18, the current yearly opening price—that’s the one we’ve got to keep an eye on.
Australian Dollar versus U.S. Dollar
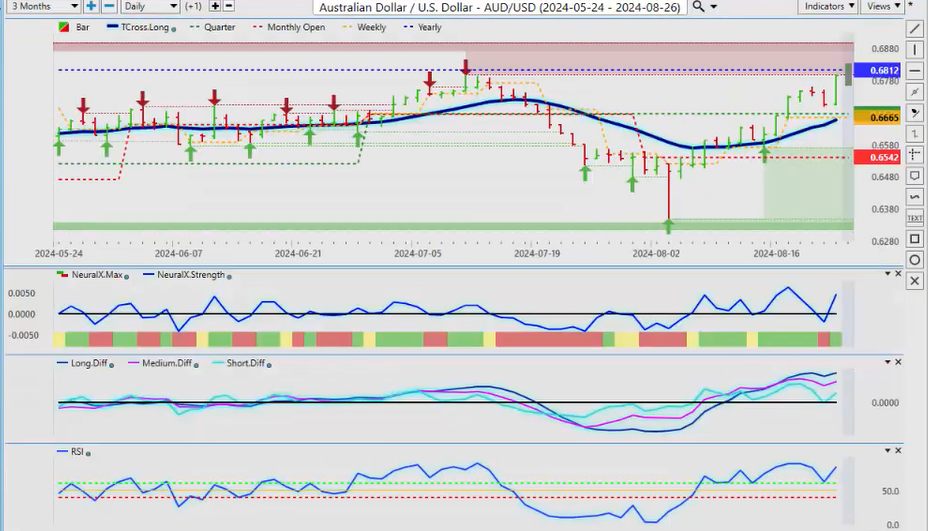
The indicators are still relatively strong to the upside, same as the Aussie ; it’s the same trade here, guys. Right? But the Aussie next week, we’re going to get a test, and the current yearly opening price, 68.12, if we can overtake this level and stay above this level, we will have very, very good buying on this pair into year-end and potentially into next year. So, that’s what we would be looking for. But the main thing is to identify these critical levels because, again, using the Aussie/US pair to gauge the equity markets, this is warning that this Aussie pair may not pass that yearly opening price right out of the gate, but I believe it will into October, November, and December. So with that said, this is the Vantage Point AI Market Outlook for the week of August the 26, 2024.