Welcome to the Artificial Intelligence Outlook for Forex trading.
Okay, hello everyone, and welcome back. My name is Greg Firman, and this is the Vantage Point AI Market Outlook for the week of August 19, 2024.
U.S. Dollar Index
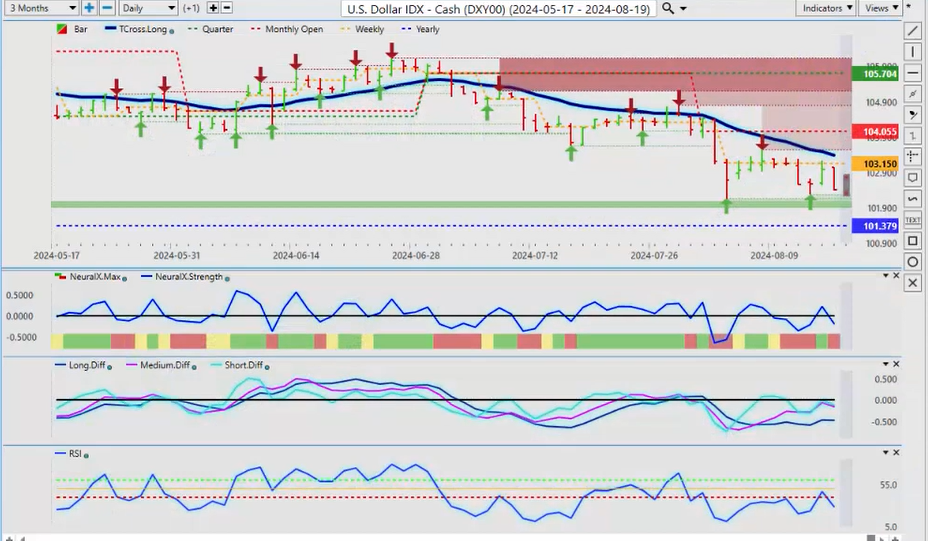
Now, to get started this week, we’ll begin where we always do, with that very important US Dollar Index . Now, the dollar is under pressure again this week, but this is largely due to rumors from the media talking about emergency Fed meetings, which there aren’t, and emergency rate cuts, which there are not. So again, we’ve got to be very, very careful at the start of the week because that’s when they seem to be spinning this web. But again, the Fed has been very clear that they are looking at cuts in September, but they are not confirming 50 basis points, but they have confirmed there will be no emergency meeting here. So taking that into consideration, our major support level is, of course, our current yearly opening price, 101.37. The dollar will not be in an official bear trend until we break through that level. If we do, we have heavy support on the most recent identified verified support zone, and that low is coming in at 102.16. That’s the area that we’ll watch for this coming week. The indicators are mixed, but we do still have a contrarian reversal signal on the MA diff cross; the pink line over the blue line is basically saying the medium-term trend is starting to turn back to the upside. Now, as I’ve discussed in previous sessions, in most cases, the dollar does very well in the month of September, and that’s the final rally for the year. I don’t see that anything has changed at the current time.
Gold
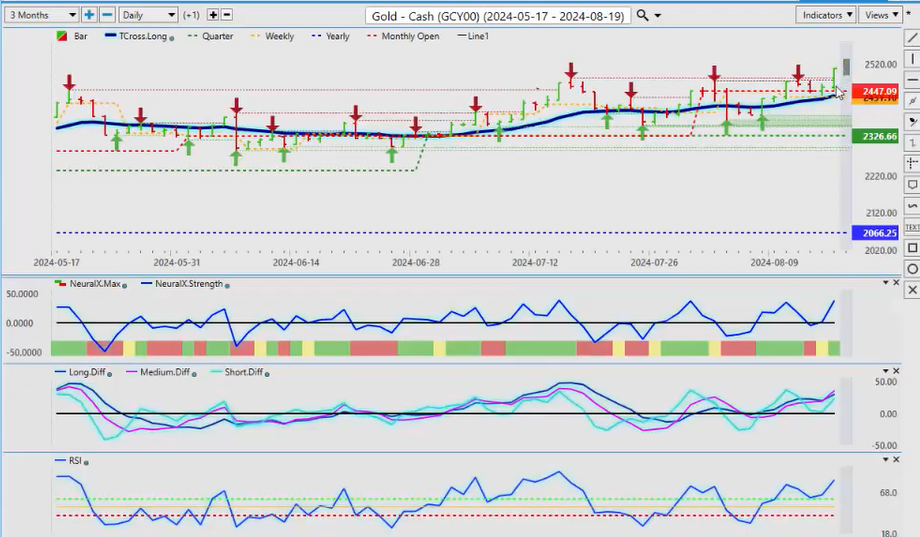
Now, I do feel the market is getting a bit ahead of itself with Gold prices’ very aggressive move, but on a Friday, now this is the highest close I think we’ve ever had in gold at 2509. What I can advise is there is significant headwinds above 2500. I believe we will finish out the year above 2500, but in the near term, be very, very cautious buying at these levels. Now, we’re sitting at about 82.8 on the predicted RSI, but the predicted differences are starting again to, they’re a little bit overbought here, but the gold remains in a firm uptrend while above its current quarterly opening price, 2326. And again, the—excuse me, 2066 is the current quarterly opening, but the yearly opening price at 2066 again confirms gold in a strong uptrend. So again, there is some resistance up here between 2500 and 2567 on a side note, and I would be very cautious buying up at these very lofty levels.
S&P 500 Index
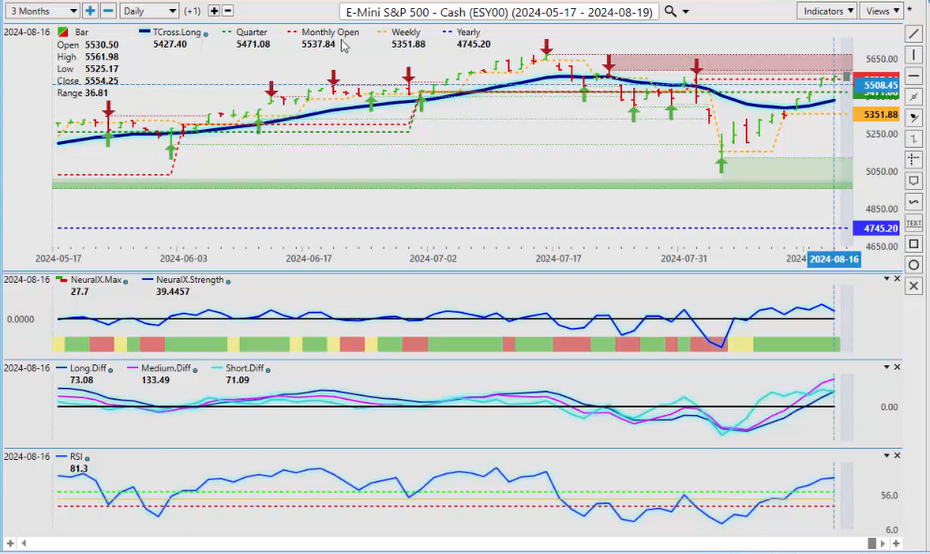
Now, with the S&P 500 , looking at that, equities are also recovering, but we can assess here that they’re stalling out at the current monthly opening price, 55,378.4. This is a very significant level for us to overtake. We want to stay above this level. Now, they’ve talked about what a fantastic week the equities had last week, and well, that is technically true, but I will also point out that we’re basically flat on the month after a fairly significant selloff. So again, we’ve recovered right back to our monthly opening price, and this is why it’s very important that we use the current monthly opening price, not a rolling performance model of a random 15 days, a random 30 days. We want to start at the beginning of the month and end at the beginning of the month, and you can see the natural retracement point is back to that current monthly opening. Now, we’ve crossed over the VantagePoint T cross long, that will be our initial support, or our main support for next week, 5427, and if we click on our F8, we can get the additional support from our long predicted, and that’s at 5462. As long as we’re holding above these two levels, then we should be able to break through that monthly opening, but again, my concern here is the inverse correlation between equities and the US Dollar Index , and the fact that equities usually don’t do very well in August and September—not in all years, but in a large number of years. They don’t do very well, and it slightly favors the US dollar. But the media is spinning this web about emergency rate cuts, emergency Fed meetings; there’s none of that, guys. There’s a scheduled Fed meeting. I don’t know who came up with this emergency Fed meeting, but it’s not happening, and the Fed has confirmed that. Now, there is Fed testimony next week, so be careful the latter part of the week. But for now, equities remain firm, but 5537 will be a pivotal area to begin the week and likely throughout the remainder of the calendar week.
Crude Oil
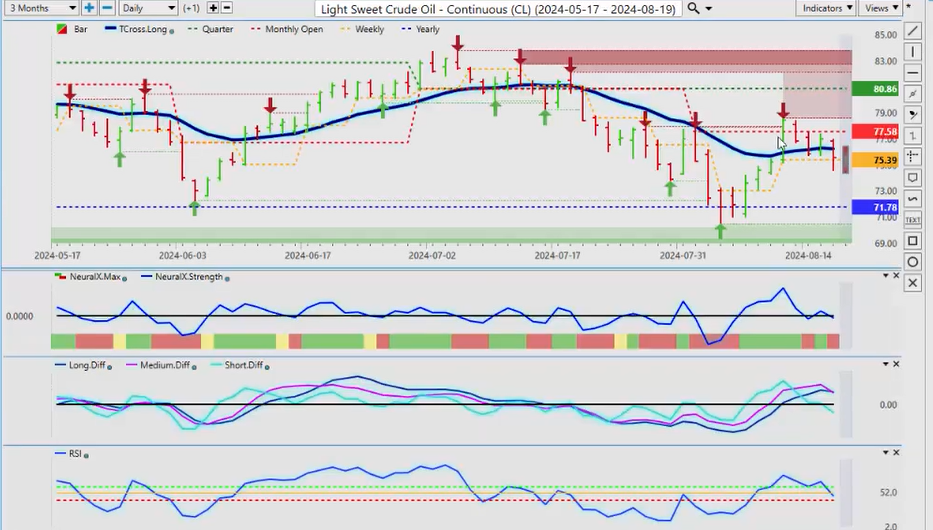
Now, as we look at Light Crude Oil , oil did recover, but again, once again, when we look at the charts, we’ve had that recovery back up, but then we’re failing up around that 80 mark, and you can see here a big push up at the beginning of the week, and this is a very good example of what I’ve worked on in the VantagePoint live training room of a Monday-Tuesday reversal, that very often Monday is a fake price, and then on Tuesday, the real price starts to show itself. Now, the inverse correlation between oil and Natural Gas heavily favored natural gas, and that gas did very, very well this past week. It just sold off on profit-taking on Friday, but oil is also moving lower, so either one, either one of the other is going to move up, and my money would be on Nat gas, looking at that seasonal pattern. So for now, oil has broken down below our T cross long, that area is coming in at 76.22. We remain bearish by that while below that level, but as you can see, buyers coming in at the yearly opening price, but a very shallow retracement higher this time, and that tells me that oil likely has further downside, and longs on natural gas is likely going to be the better play between these two commodities.
Bitcoin
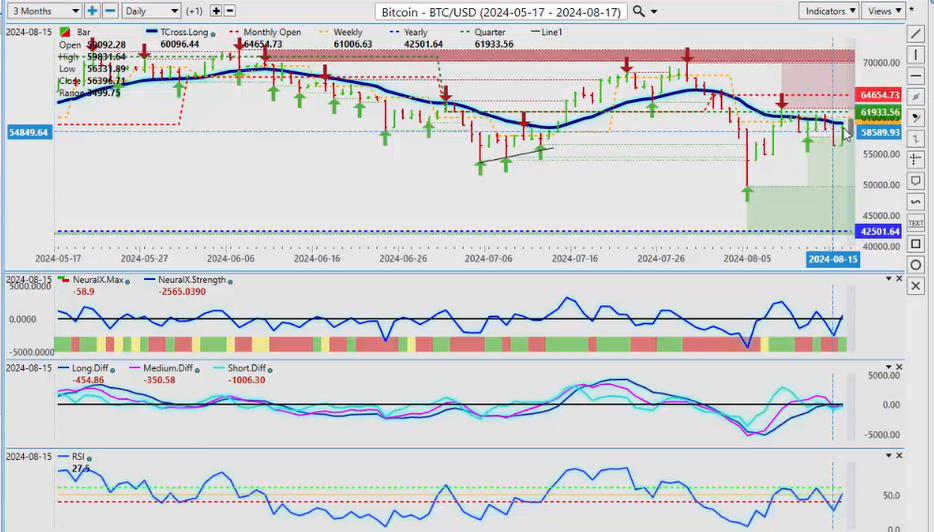
Now, as we look at Bitcoin for next week, once again, not the best month for buying Bitcoin here. We know this, so you can see that we’re struggling, banging into that VP all week. We have struggled to get above the VantagePoint T cross long, that area currently coming in at 60,115.34. So we need to break clear of that, get back up above the quarter. Bitcoin, the Bitcoin seasonal pattern, very good buying between mid to late September and mid to late October, usually the top period for buying Bitcoin in any calendar year. So be patient for that, but for now, we’ve got a large drop down here, uh, on that, I think it was 2 weeks ago, on the Monday, and again, these silly rumors that are being spread around, it’s always on a Monday, guys. So if you hear something that sounds strange, ignore it. Buy the dip, sell the rally because it’s likely fake news is what it is. So be careful, very cautious on that, but that, that news of emergency rate cuts slammed Bitcoin down, but it immediately recovered. So once again, if we get above our T cross long, then Bitcoin—but Bitcoin, to be clear, remains in a firm uptrend. The medium-term trend is down, but the longer-term trend remains up. We just have to clear 60,115. Get back up above the monthly opening price. I could easily see Bitcoin into the 80,000 mark by year-end.
VIX
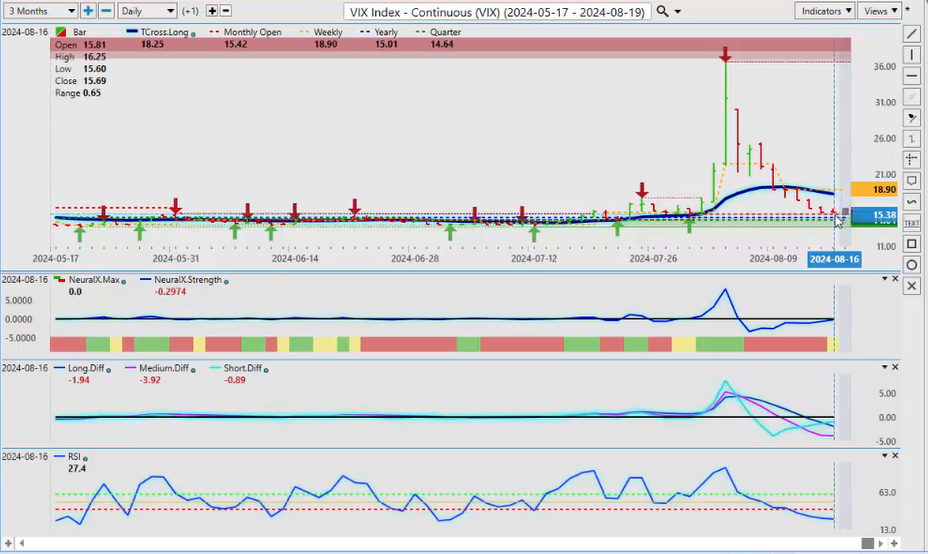
Now, when we look at some of the European equity markets, and of course, the very important VIX to gauge with the direct, to help us gauge with the direction of the equity markets, the VIX is sitting on its current calendar yearly opening price. This is a significant concern for me. If we don’t break below this, then the current rally in equities is a fake move, and that’s how we use inner markets to tell us these things. So if we break down below the yearly opening price again on the VIX, 15.01, then that would tell me the equities are not going to rally in the near term, probably not again until mid to late September, when that dollar buying is concluded at the end of the US fiscal fourth quarter, which is October 1. So once again, be careful of this, but if you’re a stock trader, watch this level on the VIX. Even if you can just Google it throughout the course of the day and see what the price is, but if we break down below that, uh, T cross long, which we’ve already done at 18.25, if we take out the yearly opening price also at 15.01, you’re going to see the equities turn lower very, very quickly, and that would fuel more gold buying and possibly even more Bitcoin buying. So keep an eye on that. The indicators right now are bearish actually on the VIX, so it’ll be very interesting, and how is that going to affect my friends in Europe and Germany with the DAX ?
DAX
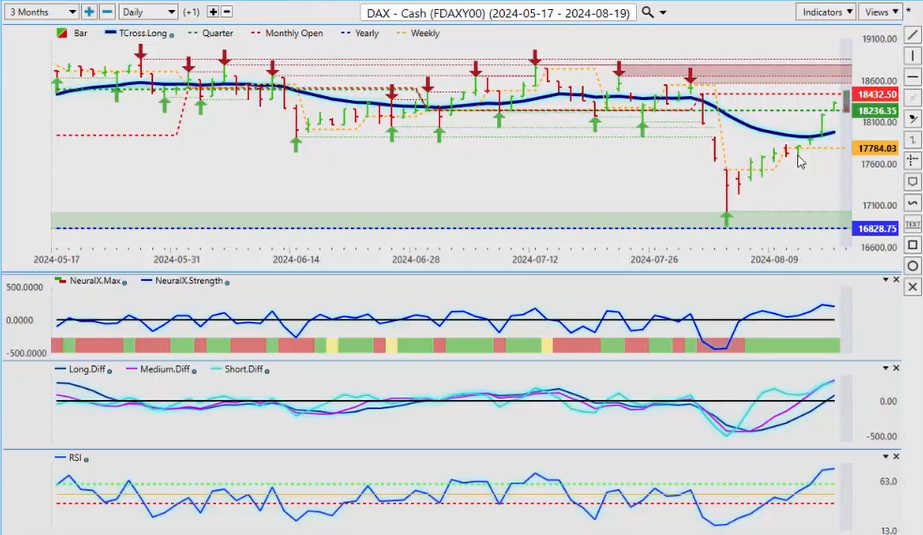
Well, you can see that the DAX started to rally higher as soon as the S&P 500 did. Now, we’re approaching the monthly opening price, 18,432.50. This is the area you’re going to have to keep a close eye on, and believe me, if that VIX plummets, it will pull the European equities down also on the positive correlation between the DAX and the S&P.
Euro versus U.S. Dollar
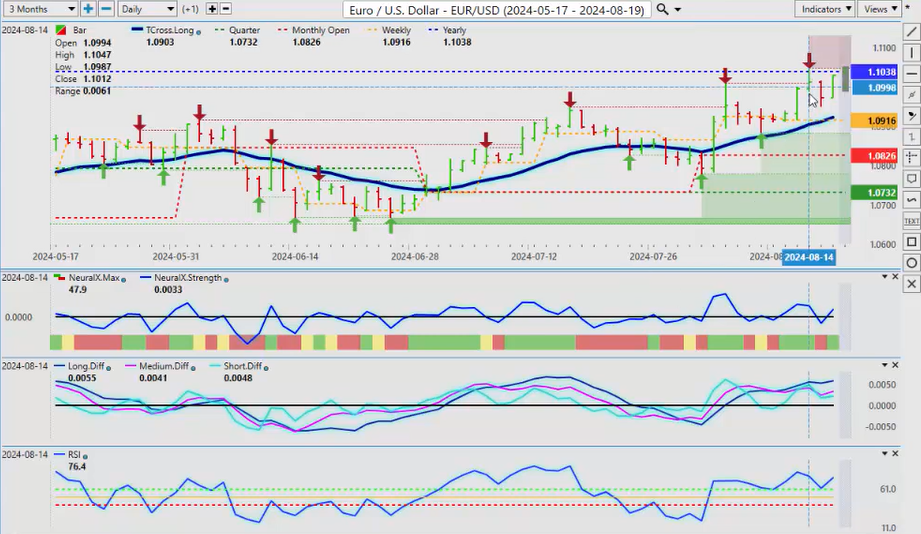
So watch this very, very closely, guys. Now, with some of our main Forex pairs, all eyes right now are on Euro-US . Saying how bullish it was, but in actual fact, guys, this is the second big failure we’ve had at the current yearly opening price. We’ve had a rally on Friday. Now, here’s what I’ve seen and what I can share with you because I get a lot of comments, and I really appreciate your comments in the comment section. It’s a very positive group we have here, and again, it’s just about providing alternative strategies to use with your VantagePoint software. It’s not about who’s right, who’s wrong. It’s just about strategies that can assist you. So this is the current yearly opening price on EUR-US, 110.38, and we did this live in the VP room, and again, I warned everybody at that time and said, look, the monthly projections are right around this level, and the yearly opening price is at 110, approximately 110.38. So we need a clean break of this area. The Euro has not made a clean break and closed 2 days above that level all year.
British Pound versus U.S. Dollar
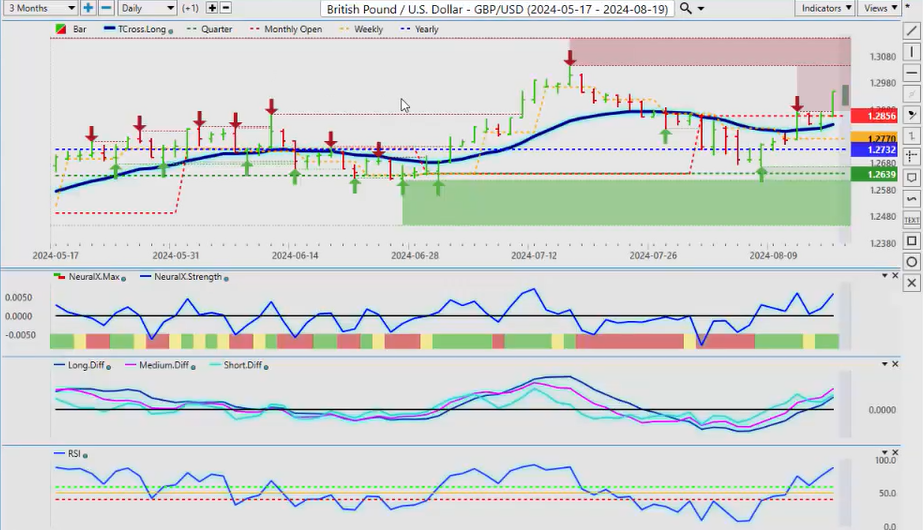
So right now, the British Pound is the one that has done very well, but again with the Euro, the indicators are well, somewhat sideways, but that is an invisible level of resistance that the average trader never sees because they look at these rolling performance models where they’re saying, oh no, Euro’s super bullish last 10 days, last 15 days, last 30 days, even the last 90 days, but they fail to mention that when you go back and look at the chart through the calendar year, it’s like, well, wait a minute, this has never been positive on the calendar year, so how could that be bullish, right? So again, it does have an underlying bullish tone to it. I just want to make sure that everybody sees and understands that level, that invisible level of the current yearly opening price that we need desperately to break through. But when you cross-reference that to the British pound, uh, this is why I recommended the other week, the Euro-British pound, uh, short because Great Britain-US has broken above its yearly opening price multiple times this calendar year where the euro is not, and it is indirectly showing us which currency is stronger. I would gladly, and I did, gladly short EUR-US, but I wasn’t interested in shorting the British pound-US dollar because you can see that it’s significantly more bullish than what the euro is. So one of the ways we can play that is going to Euro-Great Britain, that’s what Euro-Great Britain is, Euro-US, Great Britain-US. So we can clearly see using this trading setup, which of these two currency pairs is stronger. Now for next week, could it be possible that the British pound overshot the mark a bit, and it’s going to retrace lower, and now it’s the Euro’s time to turn to go higher? That’s possible, and I will put that out there for everybody. Just remember on Euro-US, and I know there’s a lot of Euro-US traders, it’s the number one traded Forex pair. We’ve got to get above that yearly open price, guys, on Euro-US before we buy at this level, or much like last week, you fall into a bull trap.
U.S. Dollar versus Swiss Franc
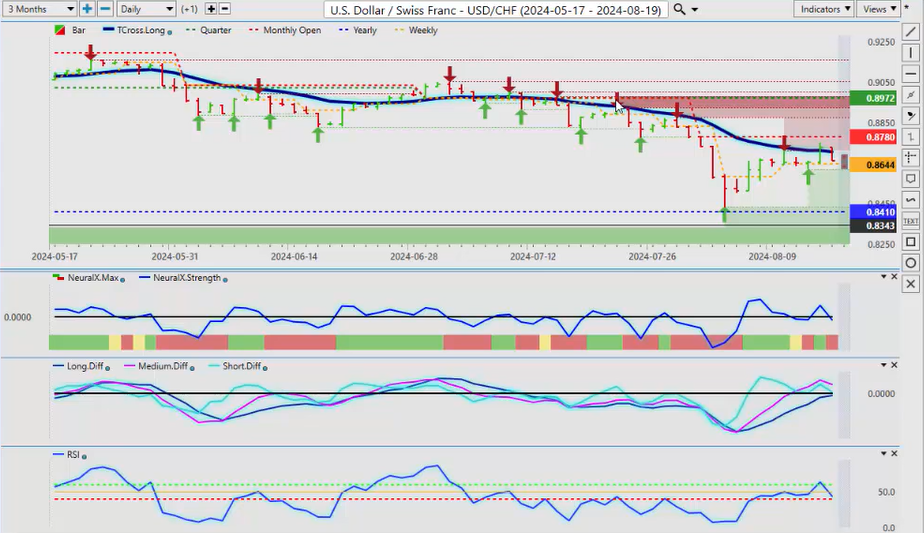
Now, the US Swiss Franc once again, I am anticipating that this carry trade either way is going to come apart in October, November, and December of this year. So that favors two currencies, not just the Japanese Yen but it also favors the Swiss Franc. So right now, this pair is getting all tangled up in the VP cross, long but I also think we have room to extend higher prior to October 1st, but I think it will be a very shallow rise.
U.S. Dollar versus Japanese Yen
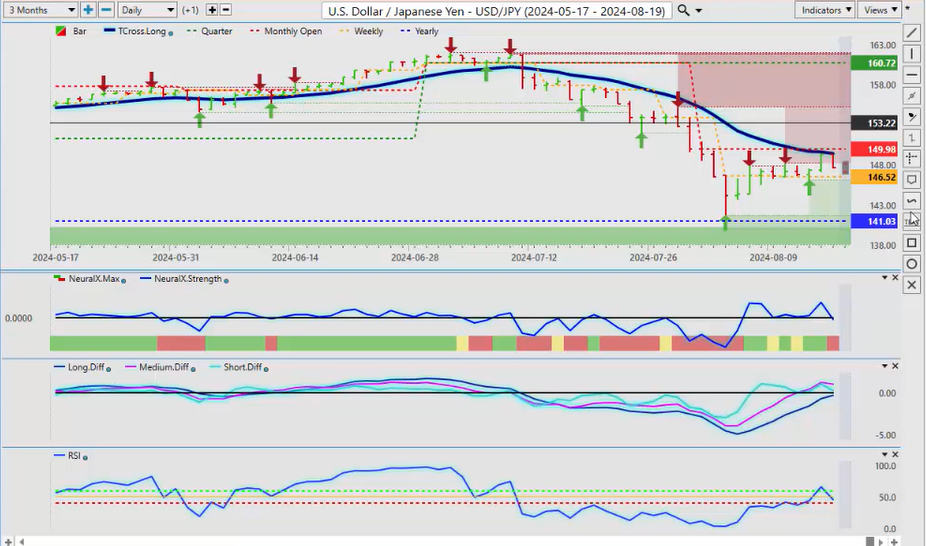
So you can see we’re losing strength in our medium-term strength. Our predicted RSI is failing to hold above the 60 level, and it’s pointing down again. Just remember, we’re in a period of known dollar strength, but that still may not help the dollar against the Yen or the Swiss Franc if the carry trade falls apart and dollar-Yen crashes. It will pull US-Swiss Franc down with it. That’s the very likely outcome. So be careful, this, if you’re a Forex trader, the monthly opening price, 87.80, we need to get above that, stay above that, and the indicators are not saying that that is in the cards right out of the gate here. So when we look at Dollar-Yen , uh, once again, the Dollar Yen, even if you’re not a Forex trader, guys, it would behoove you to keep an eye on this thing because if it does crash, it’s usually a leading indicator that the stock indices are going down with it. So that’s the basis of advanced intermarket technical analysis, is one market will drive multiple other markets. So in this particular scenario, um, this is what Su of coin is a death cross, which is the T cross long crossing over to the downside, the monthly opening price. So all of our resistance is basically sitting at the same level for next week, 149.44, the monthly opening, $149.98. So for the more savvy trader, and you could disagree and say, okay, no, I believe the dollar yen is super bullish, and I want to buy it. Well, that’s your call, but I would recommend that you buy it above the monthly opening price at 149.98 and keep a very tight leash on longs, uh, because either way, even though the rumors with the Fed, I believe there are going to be several cuts this year, and I believe the Bank of Japan is going to take advantage of that while the Fed cuts, the Bank of Japan hikes. There’s your carry trade gone, and that will affect the stock market, guys, is what I can warn you of. So keep a very close eye on this pair, even if you’re not a Forex trader, because this is going to tell us what Gold’s going to do, what the Swiss Franc’s going to do. It’s going to tell us potentially how the stock markets are going to handle this. All of these things can be roped into this particular Forex pair. So watch it very closely, and it is again losing upside momentum.
U.S. Dollar versus Canadian Dollar
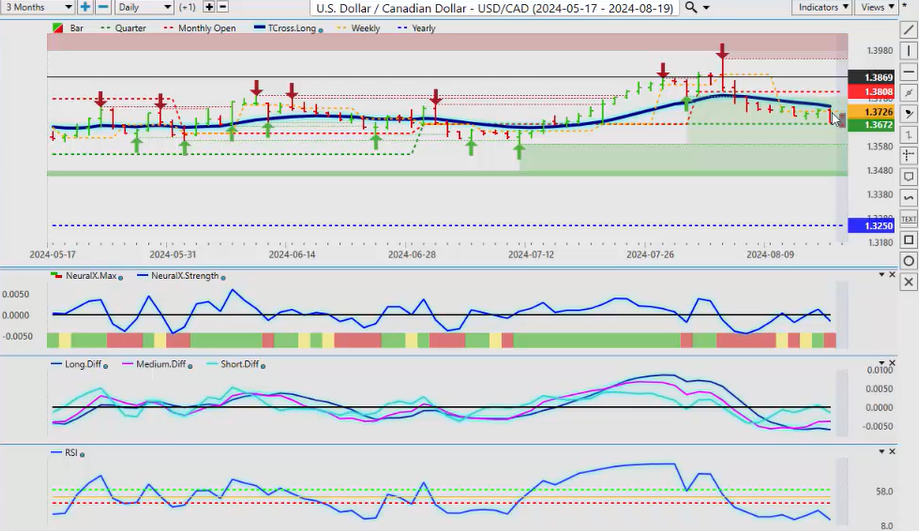
Now, the US-Canadian pair, once again, we’re holding below the T cross long, but here’s the deal, guys. We’ve got to break down below the quarterly opening, and in most cases, the Canadian dollar is not overly strong at this time of the year. The economic numbers out of Canada, the jobs numbers, they’ve cut interest rates twice, very little reason, oil prices dropping. The only thing that’s holding this pair to the downside is the equity markets moving higher. So the inner market correlation that you want to be aware of is if those stock markets, if the VIX is right and stocks are going lower, then this pair will go higher, not lower. We have an MA diff cross right here, the pink line over the blue line. If that continues to advance, then this quarterly opening or just below that will hold, but always remember, guys, US-Canada has never been below 132.50 the entire calendar year. So if we look at it back 9 months ago, uh, to the calendar yearly opening, which is very important to look at, you can see that it has only gone up, and there’s multiple reasons that I could go over in this in a very short time why, but in short, now, you’ve got falling oil prices, you’ve got the potential of an equity selloff, uh, you’ve got the potential for dollar strength over the next four to six weeks. There’s a lot of factors that play into a trade here, and I just want to present as many as possible for you. So once again, when we look at that, that quarterly opening is a big one, a very big one, 136.72, and when we look at this right now, you can see that the T cross long is also still above the quarterly opening. Now, I can click on the F8 on this one and also look at this and say, okay, okay, well, if the if the long predicted crosses over the quarterly, then maybe we’ve got a bigger trend down, but I don’t believe that that will be the case, and I would actually be looking for buying opportunities, respecting the fact that the MA diff cross is saying that this move to the downside is temporary.
Australian Dollar versus U.S. Dollar
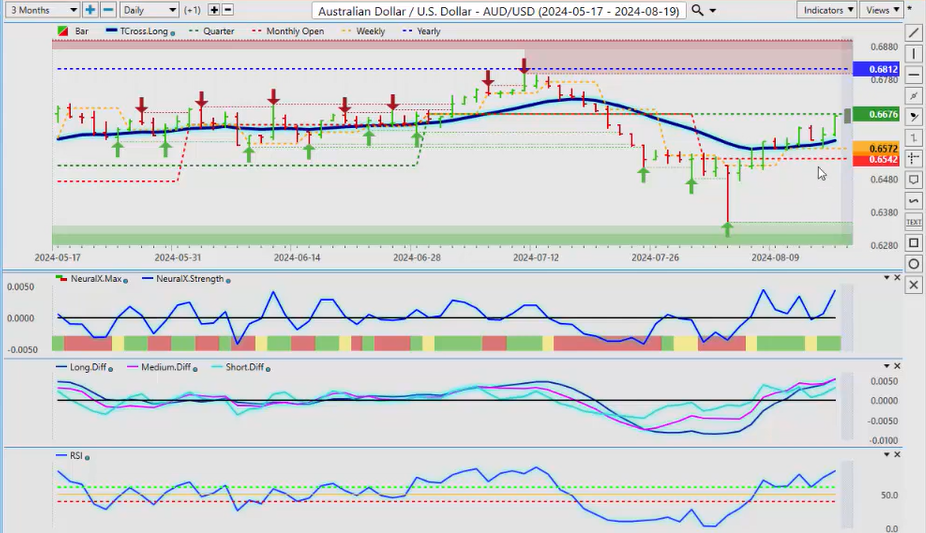
When we look at Aussie-US and New Zealand-US , same deal here, guys. You’re looking at almost the exact same currency, and right now, it’s sitting at a breakout point. Aussie-US is sitting at a breakout point, 66.76. That’s your quarterly opening price. If we can break through that, then here’s another twist for you. Is that the Euro-US pair has a very, very high correlation to this pair, so if the Euro does pop to the upside, it’s going to pull the Aussie with it. However, if the Euro-US cannot break through that area, then both of these currencies are going down, and if that happens, it will likely be on Tuesday. So watch for a false break higher on Euro-US and a false break higher on Aussie-US because we need to hold. This is how we can gauge real momentum, is if we’re holding above the quarterly opening, then that would confirm dollar weakness. But very often, whatever happens on Friday also happens on Monday, and then on Tuesday, there’s a violent reversal with the trader left scratching his head, saying what happened.
New Zealand Dollar versus U.S. Dollar
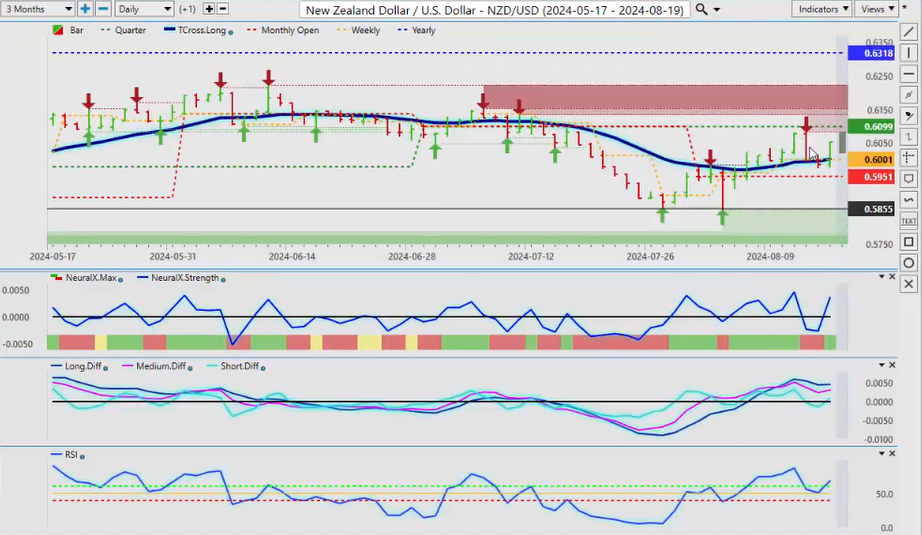
When we look at New Zealand, the same thing here, we’ve already had a failure there. We’ve retraced back down to the T cross long, we’re rallying back up, but the indicators are warning that this is not as strong as what it looks, and that surprise rate cut from New Zealand did have a bit of a shock to the market, uh, so that’s let some steam out of this, and we are going to have the RBA minutes, uh, I believe out this coming week, which will help you know see how some of these Pacific Rim-based currencies are going to do, uh, how the how their banks are looking at things, but I believe they’re next also to cut along with the Fed. So it’ll be a very, very interesting week, uh, a relatively light docket this coming week. We but we do have the Fed speaking a couple of other minor reports. I don’t think there’s anything major this week, but just be careful of what happens on Monday because I’m starting to see a pattern where every Monday they’re making up fake news and they’re releasing it to the market only for it to reverse on Tuesday. Okay, so with that said, this is the VantagePoint AI Market Outlook for the week of August 19th, 2024.