Long time readers of our blog already know that one of our all-time favorite trading setups is to closely monitor assets when they are making simultaneous 52-week and 10-year highs. After many, many years of tracking assets this simple setup is worthy of placing on your trading radar. When a market, particularly a commodity like silver, is making simultaneous 10-year and 52-week highs, a technician in trading views this as a significant and bullish signal. Such a confluence of milestones indicates a strong upward momentum, suggesting a breakout from long-term resistance levels and a confirmation of sustained strength in the market. Technicians rely on charts and historical data to identify trends, and these dual highs provide a compelling narrative of a robust and potentially enduring uptrend. They look for patterns, volume spikes, and other technical indicators to validate the move, recognizing that this rare alignment often precedes further gains and can signal a powerful opportunity for traders and investors to capitalize on the bullish sentiment.
Technical analysis is anchored in one essential and profound principle: everything known about an asset is reflected in its current price. This is a crucial concept to ponder because there are moments when price is utterly non-predictive, and times when it absolutely is. Understanding this principle can be the key to unlocking market insights and seizing opportunities, as it underscores the dynamic and often unpredictable nature of trading. It is my contention that when an asset is making new 52-week and 10-year highs simultaneously, the bias and trend is no longer debatable and in this environments traders can shine.
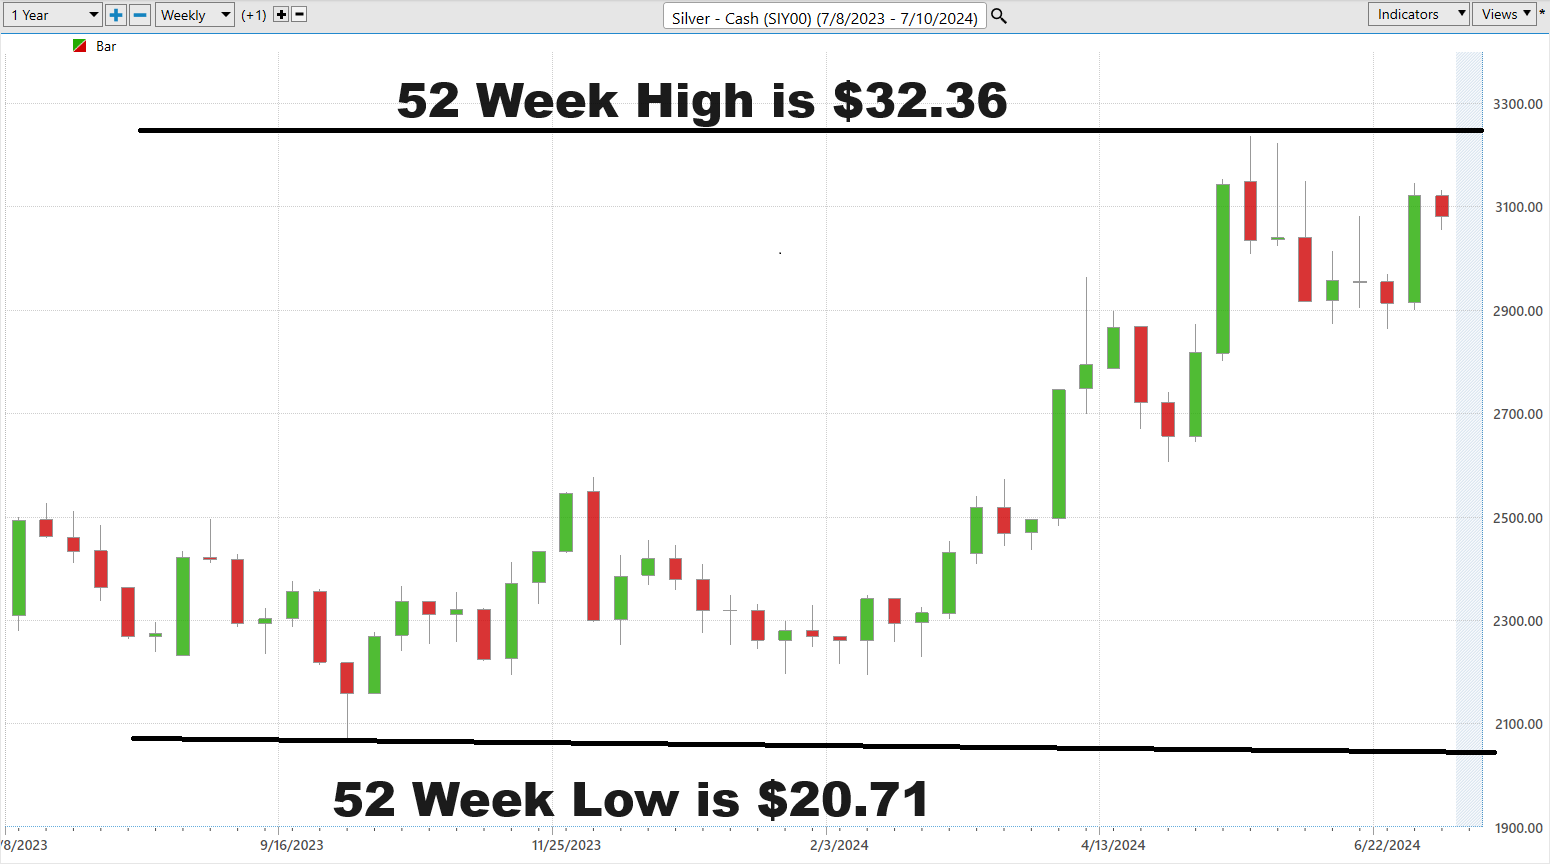
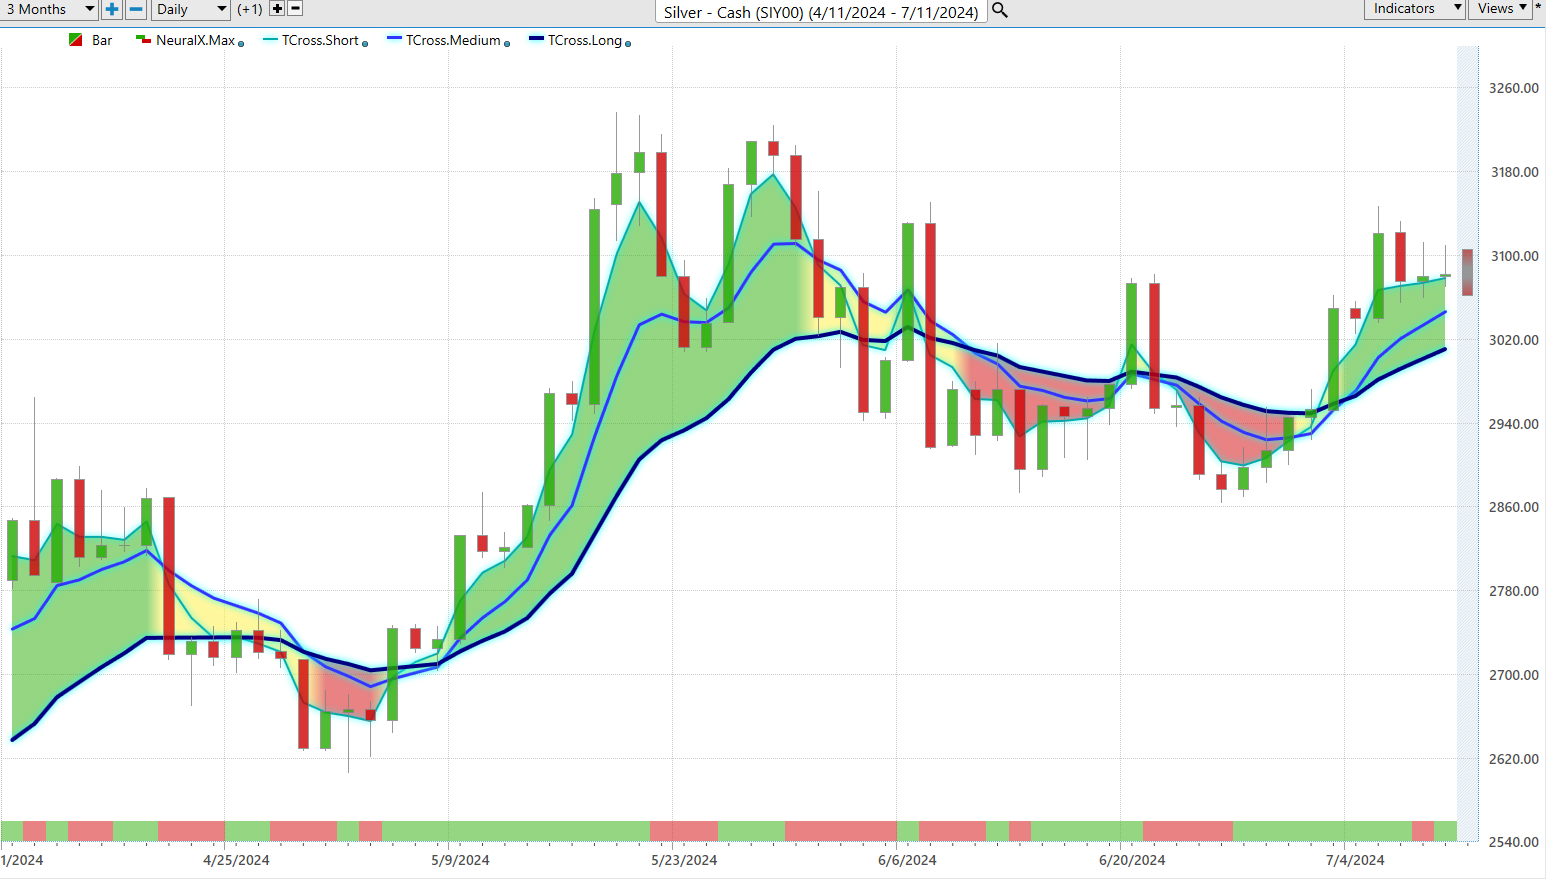
Let’s look at the charts as we dig into better understanding what is occurring in the silver market.
Now let’s zoom out and look at the 10-year chart.
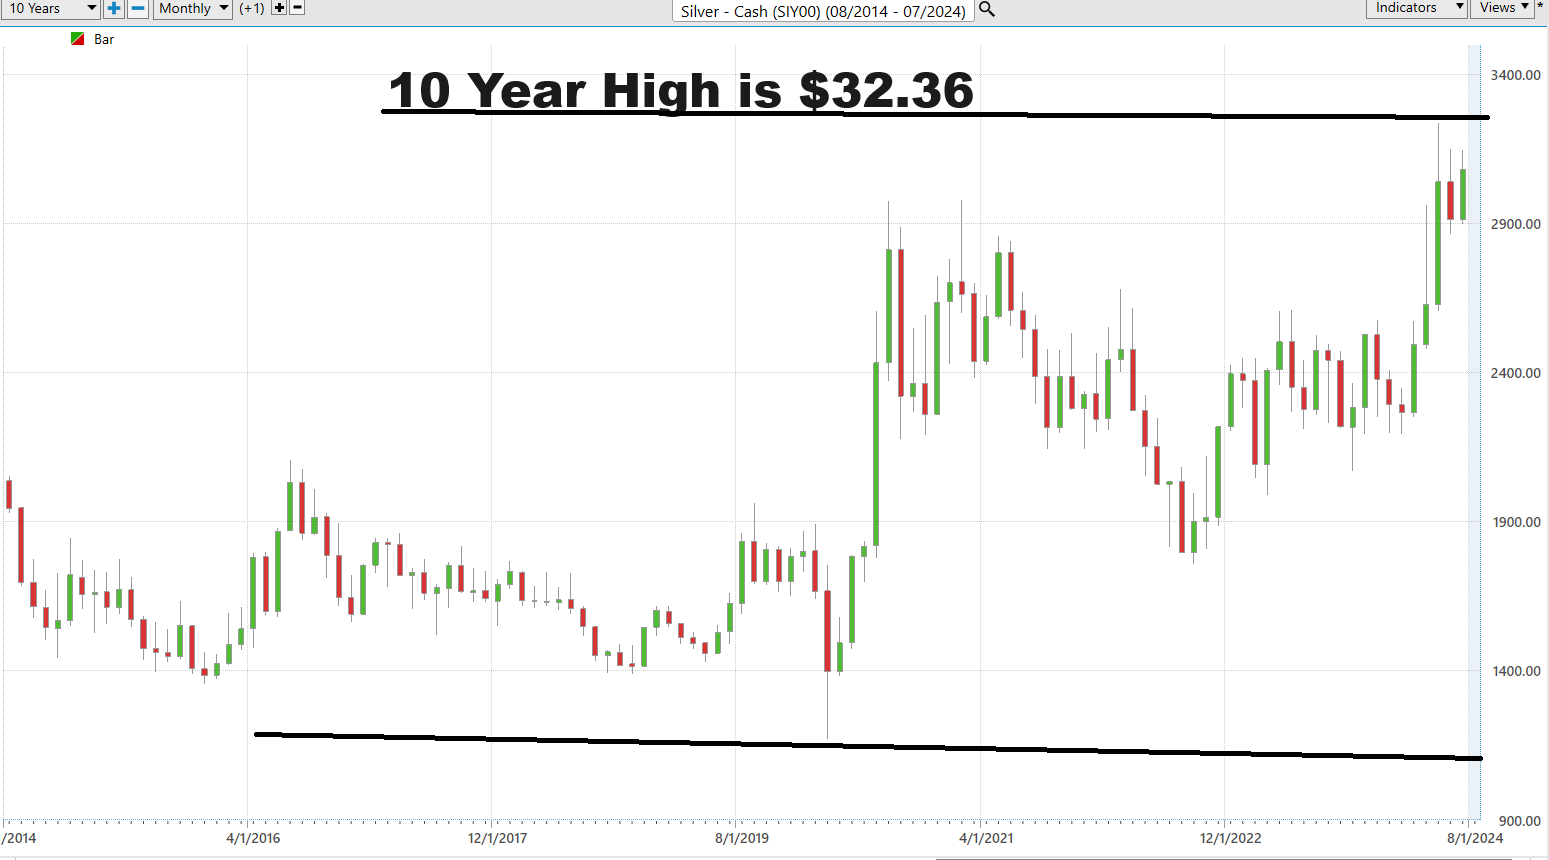
When you study these charts, the only conclusion you can draw is that the trend is clearly up. Three months have gone by where the silver market broke its old 52 week high and since that time frame, Silver has been testing the old high as NEW Support.
The one trading principle that I adhere to religiously is that we need to pay attention to what “IS” happening in the market. As traders we often embrace an ideology which forces us to focus on what “SHOULD” happen. When “IS” and “SHOULD” meet some pretty explosive things can occur and those are the opportunities we live for as traders. In this article I will build the case that SILVER is poised for massive price appreciation. It is my contention that “IS” and “SHOULD” are joining hands. This is purely for education and not trading advice but… Pay Attention, Hard Stop.
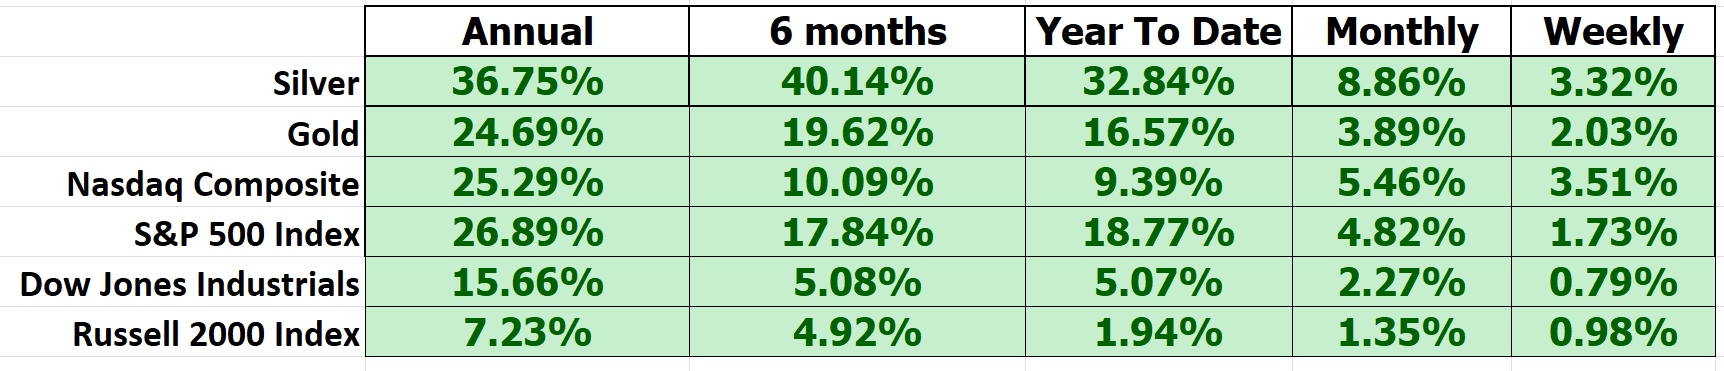
One of the first things that every trader and investor should do when analyzing an opportunity is to examine how it has performed relative to other markets. By doing this, traders and investors gain a comprehensive understanding of the broader market climate they are considering entering. This comparative analysis reveals the asset’s strength, resilience, and potential vulnerabilities in the context of its peers. It also helps in identifying prevailing trends and market sentiment. Armed with this knowledge, they must confront a critical question: will the current market climate continue, or are dramatic changes on the horizon? This evaluation is essential for making informed decisions and strategically positioning oneself for potential market shifts.
My observation over many years of watching markets is that when Precious Metals outperform stocks the financial media often does not know how to report on it. They cannot comprehend how a non-yielding asset is outperforming a financial product. Study the comparison metrics below and you’ll see that Silver is a faster horse in the current race than Gold or the broader stock market indexes.
When I look at this race and ask myself why this is occurring, I arrive at one inescapable conclusion. Wall Street has been screaming, begging, and pleading for lower interest rates since the beginning of time. Historically, whenever the Fed begins lowering interest rates it is usually right around 5 percentage points over a period of 1 to 3 years. Study the chart below of the Fed Funds rate going back to 1955 to verify this for yourself. I have taken the liberty of highlighting the recessionary environments in red. My five percentage points is considered conservative when you look at the history.
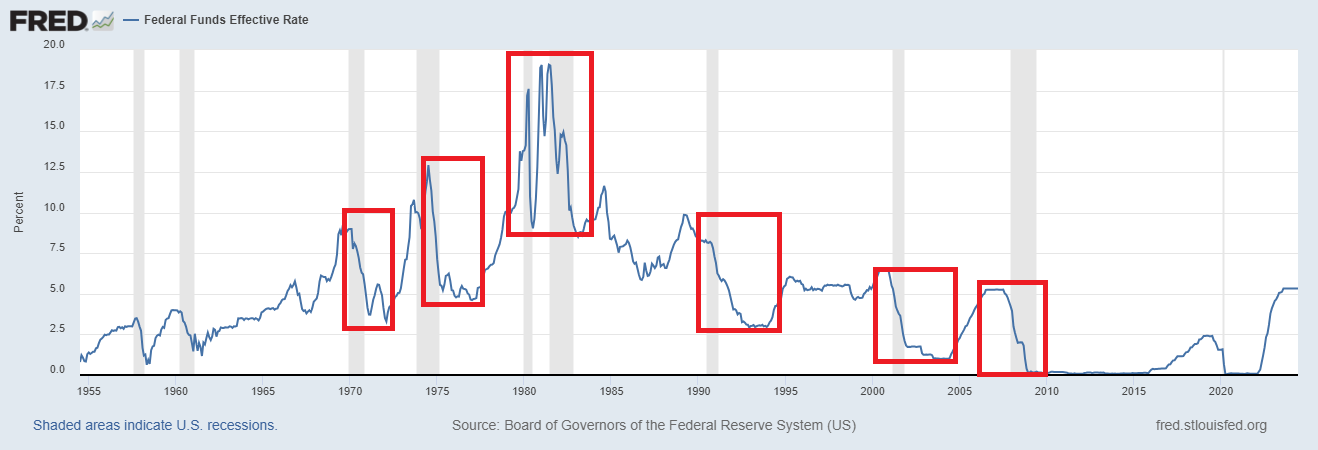
The implications of The Fed lowering interest rates are startling for anyone who understands finance.
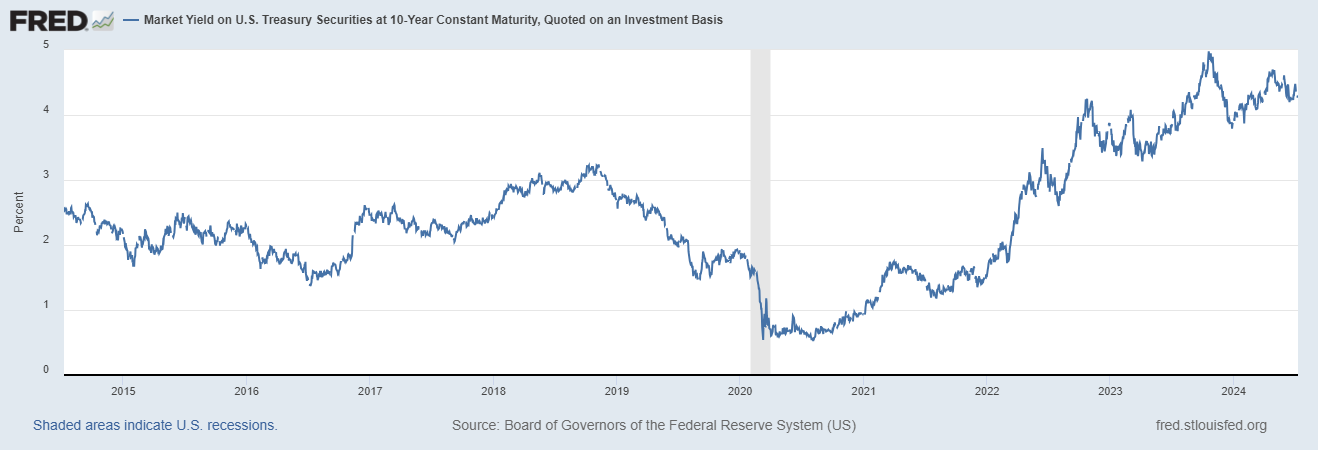
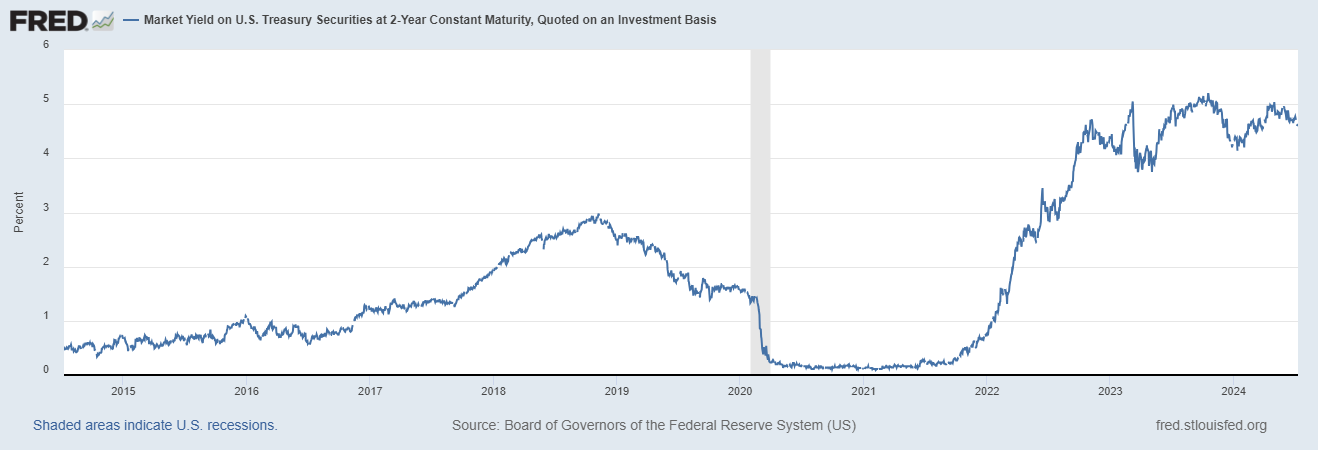
First let’s look at the historical yields on the 10 year as well as the 2-year Treasury note chart.
Currently the 10-year T-Note is yielding about 4.28%.
For the 2-year Treasury note, the yield is 4.99%.
Simple question. If the Fed lowers interest rates 5% over the next few years that would push interest rates into the negative. How are negative interest rates a good thing?
Since the Great Financial Crisis of 2008 here are the main arguments for negative interest rates and the “Too Big to Fail” philosophy which was adopted.
1. **Stimulates Borrowing and Spending**: Negative interest rates make borrowing cheaper, encouraging businesses and consumers to take loans for investment and spending. This increase in economic activity can drive growth and reduce unemployment.
2. **Incentivizes Investment**: With returns on savings effectively penalized, investors are encouraged to seek higher returns in riskier assets such as stocks or real estate, leading to increased investment in the economy.
3. **Weakens the Currency**: Negative interest rates can lead to a depreciation of the domestic currency, making exports more competitive internationally, boosting export-driven sectors, and improving the trade balance.
The problem with all these arguments is that they don’t work, and they have not worked. The talking heads in the media can talk about them repeatedly in the 24-hour news cycle as much as they want. A push for lower interest rates is an admission by the Fed that they don’t have a solution and they are only concerned with perpetuating their survival, not yours.
It may sound extreme until you study the history, the charts, and the nature of the problem. Here is a chart from the St. Lous Fed which tracks the purchasing power of the US Dollar since the Great Financial Crisis. Using the Fed’s numbers the US dollar has lost 34% of its purchasing power in the last 15 years.
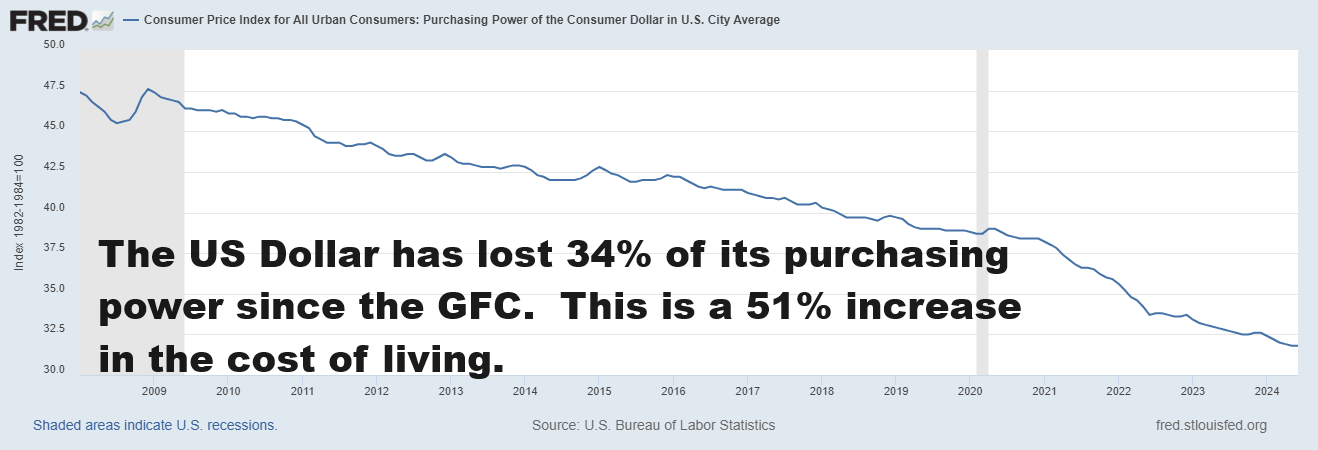
If the dollar has lost 34% in purchasing power, the cost of living has effectively increased by approximately 51.52%. This is calculated by recognizing that if the purchasing power of $1.00 is now $0.66 (100% – 34%), you would need $1.51 to maintain the same standard of living (since $1.00 / $0.66 ≈ $1.5152). This indicates an increase in the cost of living of about 51.52%.
Now let me clarify my reasoning on why I continue to be critical of the Fed.
How do you determine the health of an economy?
My answer to that question is very simple, you determine the health of an economy by the strength of its currency relative to goods and services. When you debase the currency, it is drop dead simple to create an illusion of prosperity. With a debased currency the price of assets increase but all that is telling you is that you need more debased currency to purchase the same amount of assets.
So-called experts will disagree with my reasoning and tell me I’m being overly simplistic.
A strong currency, relative to goods and services, is often viewed as the best indicator of a healthy economy. This perspective is based on the increased purchasing power it provides, allowing consumers and businesses to buy more with the same amount of money. This dynamic fosters higher consumer confidence and spending, lower inflation, and a higher standard of living, while also attracting foreign investment due to the perceived stability and robustness of the economy.
Conversely, a debased currency creates an illusion of prosperity, often reflected in rising asset prices such as real estate, stocks, and commodities. However, this perceived wealth is misleading as it is not supported by real economic growth but rather by the reduced value of the currency. Alongside asset price inflation, the cost of living also rises, eroding purchasing power and leading to economic hardships for those whose incomes do not keep pace with inflation.
The illusion created by a debased currency can mask economic weaknesses and distort resource allocation, as speculative investments may be favored over productive ones. Furthermore, the real burden of debt increases, potentially leading to financial crises. In summary, while a strong currency genuinely indicates economic health through enhanced purchasing power and stable prices, a debased currency presents a mirage of prosperity that can lead to long-term instability and economic challenges.
The ongoing challenge for the Fed and the US Treasury is funding the US government’s operations. This is no easy task in an inflationary environment. As a matter of fact, I’d say it is almost impossible which is why the precious metals are taking a cue from the Treasury market and starting to shine.
Let me explain.
The US debt stands at $35 trillion.
Yields are inconsequential relative to inflation.
This means that investors don’t want to invest their savings in Treasuries.
This also means that the only way the FED and Treasury can fund government operations is to buy the debt themselves.
This has been occurring.
This will continue to occur.
This is highly inflationary and a clearest sign we can ever expect that the race to debase is accelerating.
My reasoning is very basic. If the Fed and Treasury tell you that they are going to debase the currency, pay attention and plan accordingly! Government finances are an unmitigated disaster.
Here is the problem in a nutshell.
The top four items in the U.S. federal budget for 2024 are Social Security, Medicare, defense spending, and interest on the national debt.
1. **Social Security**: This mandatory spending program is the largest component of the federal budget, with significant funds allocated to provide retirement, disability, and survivors’ benefits to millions of Americans. In fiscal year 2024, Social Security spending is projected to be approximately $1.3 trillion.
2. **Medicare**: Another significant portion of the budget goes to Medicare, which provides health insurance to people over 65 and certain younger people with disabilities. For 2024, Medicare is expected to account for about $850 billion in federal spending.
3. **Defense Spending**: The defense budget includes funding for the Department of Defense and other related activities to ensure national security. In 2024, defense spending is projected to be around $994.6 billion.
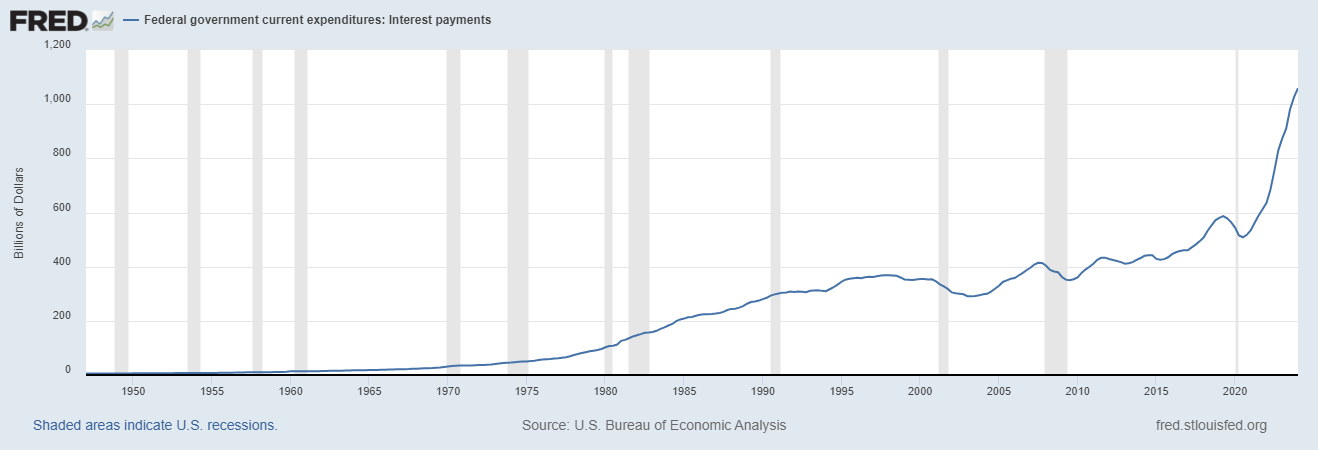
4. **Interest on the National Debt**: As the federal government borrows money to finance its operations, it must pay interest on this debt. For 2024, the interest payments on the national debt are expected to be around $663 billion…
These categories highlight the significant and essential areas of federal spending, reflecting the government’s priorities in social welfare, healthcare, national security, and fiscal responsibilities.
No one will loan the government money for 30 years.
Worse yet is that interest payments on the National Debt will become the #1 item on the budget within the next 18 months.
Investors are very reluctant to buy US Treasuries going out 10 years. After all Treasuries have been the worst performing asset class since the pandemic.
There is plenty of demand on the short end of the yield curve between 2 and 4 years.
Based upon these realities the government is rolling over 17 trillion dollars of debt over the next 18 months.
How?
My guess is that the money printer is getting ready to go “Brrrrrrr” again as the FED will monetize the debt and devalue the currency.
This is the unfortunate reality that dominates the financial markets today.
Silver is increasing in price primarily due to the government’s need to monetize debt and debase the currency. As the government prints more money to cover its obligations, the value of the currency decreases, leading investors to seek refuge in precious metals like silver, which retain value over time.
Additionally, the supply and demand fundamentals for silver indicate a deficit situation for the fourth consecutive year. We are consuming more silver than is being supplied, driven by industrial demand and investment interest. This imbalance between supply and demand supports higher silver prices. For the fourth year in a row silver demand has far outpaced the silver supply. The foundation is in place for a monster size move in the silver market.
Remarkably, silver is the only precious metal not trading above its 1980 highs, suggesting significant potential for price appreciation. The use of silver in critical industries such as solar panels, electric vehicles (EVs), and artificial intelligence (A.I.) semiconductors further strengthens the case for dramatically rising silver prices. These applications not only boost current demand but also set the stage for continued growth, making silver an attractive investment in the face of ongoing economic and industrial developments.
Historical analysis of the gold-to-silver ratio provides additional evidence that silver is massively undervalued relative to gold. This ratio measures the number of ounces of silver needed to buy one ounce of gold. Historically, this ratio has averaged around 15:1, reflecting the natural abundance ratio of silver to gold in the Earth’s crust. However, in modern times, the ratio has often been much higher, frequently exceeding 70:1 and even reaching over 100:1 at times. This deviation suggests a significant undervaluation of silver in comparison to gold.
Here is a chart of the historical Gold to Silver ratio going back 100 years.
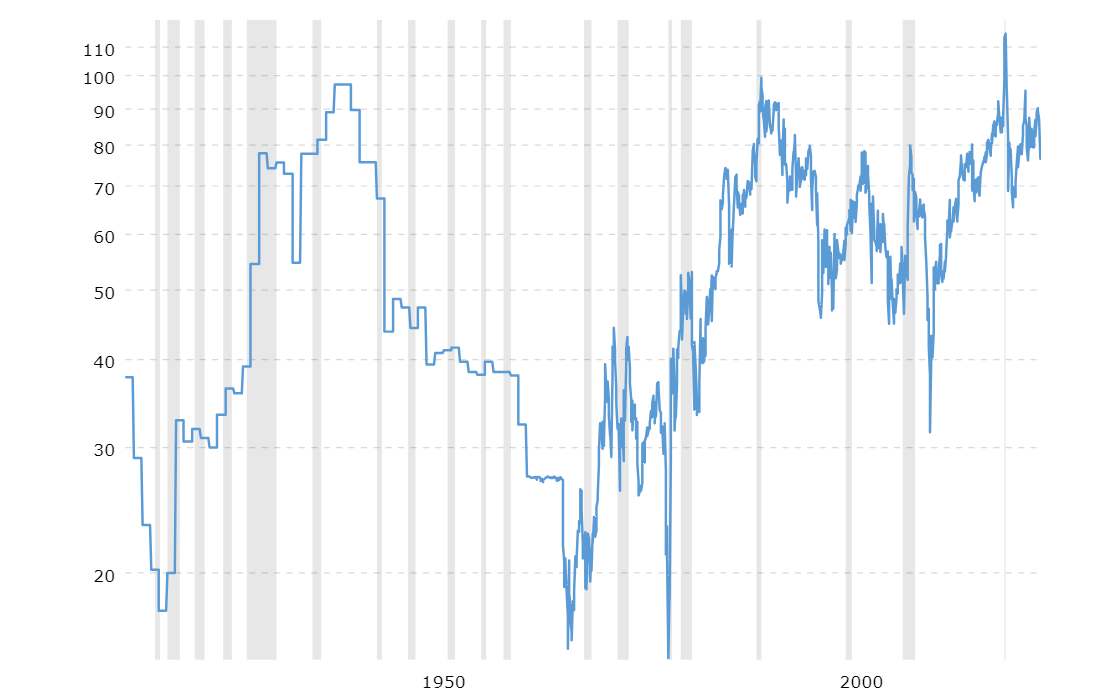
Source : MacroTrends
The historical basis for the gold-to-silver ratio indicates that silver should be much closer in value to gold. When the ratio is significantly higher than historical averages, it implies that silver is undervalued relative to gold. Given the current ratio, many analysts argue that silver has considerable upside potential. As investors recognize this undervaluation and industrial demand continues to rise, silver prices are likely to increase, moving the ratio back towards its historical norms.
Moreover, silver’s unique properties and essential roles in various high-growth industries underscore its potential for price appreciation. The combination of currency debasement, supply deficits, historical undervaluation, and rising industrial demand creates a powerful argument for dramatically higher silver prices. Investors seeking to hedge against economic uncertainty and capitalize on industrial trends should consider silver as a compelling opportunity in the precious metals market.
In today’s financial markets, there are three distinct types of entities: investors, speculators, and those aware of government currency debasement.
Investors seek long-term gains, focusing on steady growth and fundamental value, aiming for stability and consistent returns over time.
Speculators, on the other hand, chase short-term profits by capitalizing on market volatility, trends, and momentum, often with higher risk tolerance and shorter time horizons.
The third group consists of individuals and entities who recognize the government’s actions to debase the currency, such as through excessive money printing and fiscal policies, which erode the value of money. This group typically seeks to protect their wealth by investing in assets like precious metals, cryptocurrencies, and other hedges against inflation, anticipating the long-term consequences of such monetary policies.
The older I get, and the more experience in trading I acquire I begin to understand the truism that in life the only three guarantees we have are death, taxes, and currency debasement.
Remember the saying, “May you live in interesting times”? Well, these times are nothing if not interesting. Today’s inflation report shows a 3% rate, pushing the Federal Reserve towards imminent interest rate cuts. The Fed Chairman has indicated to Congress the urgency of these cuts to prevent undermining the economic recovery. It looks like for the last few months the Fed has been buying up all of the government debt anyway.
My issue with today’s CPI print is that it gives the media something to talk about and remind us how inflation is lessening. However, that is not my personal experience when I buy things. Food prices are up way more than 3% over the past year! Don’t get me started on insurance and housing which makes 3% look microscopic.
Yet, the real issue isn’t just inflation numbers but getting prices back to pre-pandemic levels. The Fed’s focus on slowing price increases misses what Americans truly need.
The Fed aims to manage this with ultra-low rates, but the government shows no signs of reining in spending, and rate cuts could spark significant inflation.
So, where do you turn? Real assets like physical gold and silver are promising. Central banks are heavily buying gold, driving prices higher. Gold mining stocks are undervalued despite gold’s high prices, presenting a strong investment opportunity as demand and prices rise.
In both investing and speculating, you’re going to be wrong sometimes. The best performers are those who accept that and deal with it. Today, admitting you’re wrong is harder because of social media. People are very public about their decisions and tend to dig in their heels. It’s a challenging time to be either.
For me, as an investor, geopolitics plays a huge role in what’s important right now. We’re dealing with a lot of geopolitical tension, which is terrible for long-term planning. At the same time, we have heavily indebted governments worldwide, many facing elections and deep fiscal holes. This combination makes committing capital risky. More importantly it makes currency debasement a certainty.
These governments’ high debt wasn’t a problem until inflation returned post-COVID. That changed the dynamics because it removed their ability to keep rates low and service their debt easily. Now, they can’t borrow more to cover their debt service. Everyone, from governments to individuals, relies on low rates, making this a precarious situation.
Governments will be aggressive in seeking private capital to cover their debt service costs, imposing higher taxes and tariffs to balance domestic interests. With elections on the horizon, especially in the US, we’ll see more of this behavior.
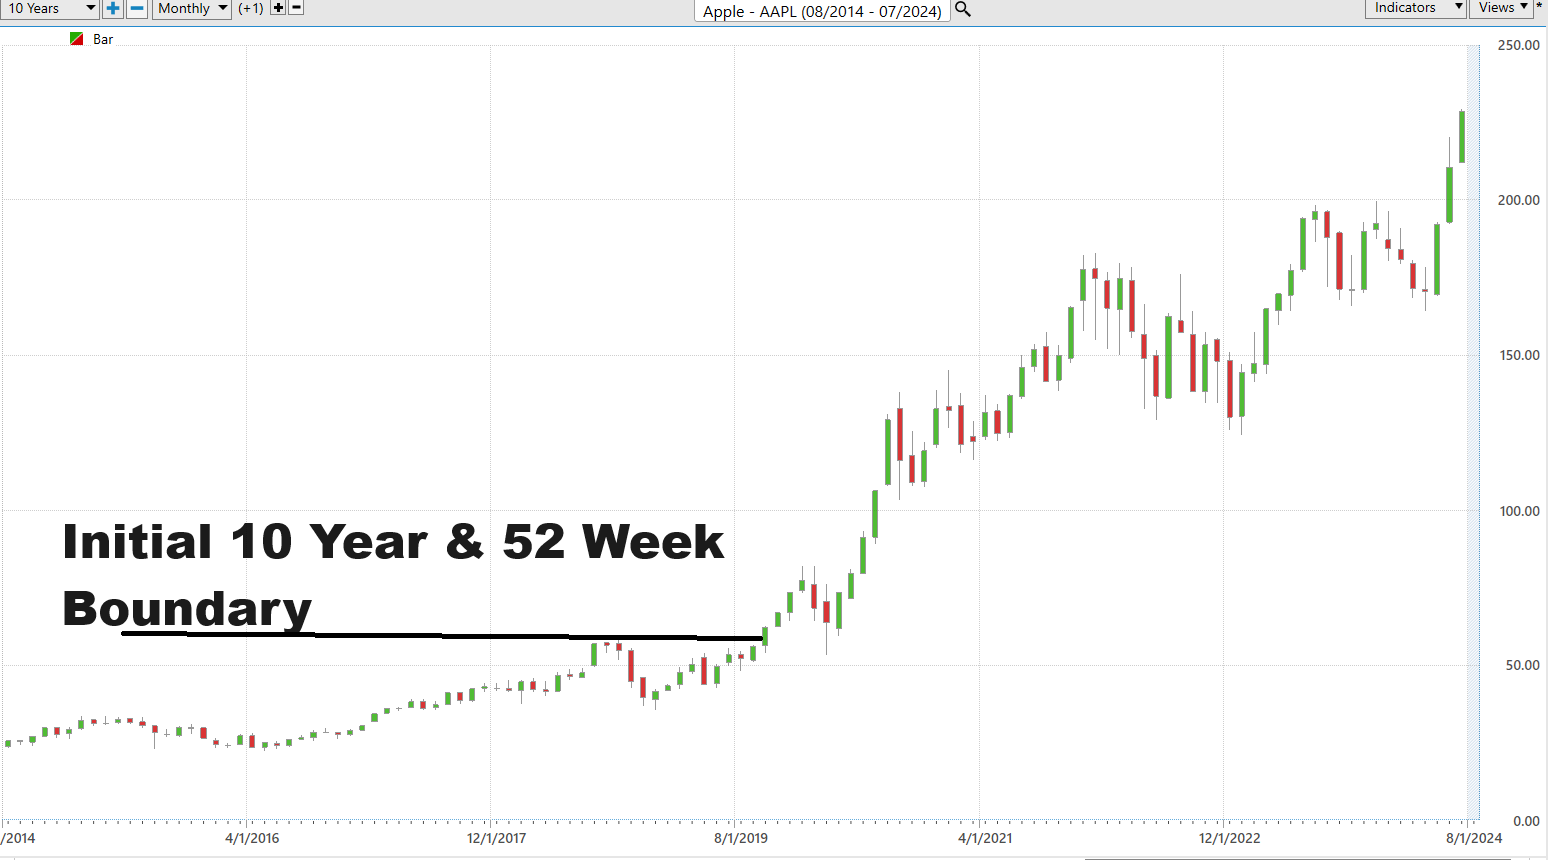
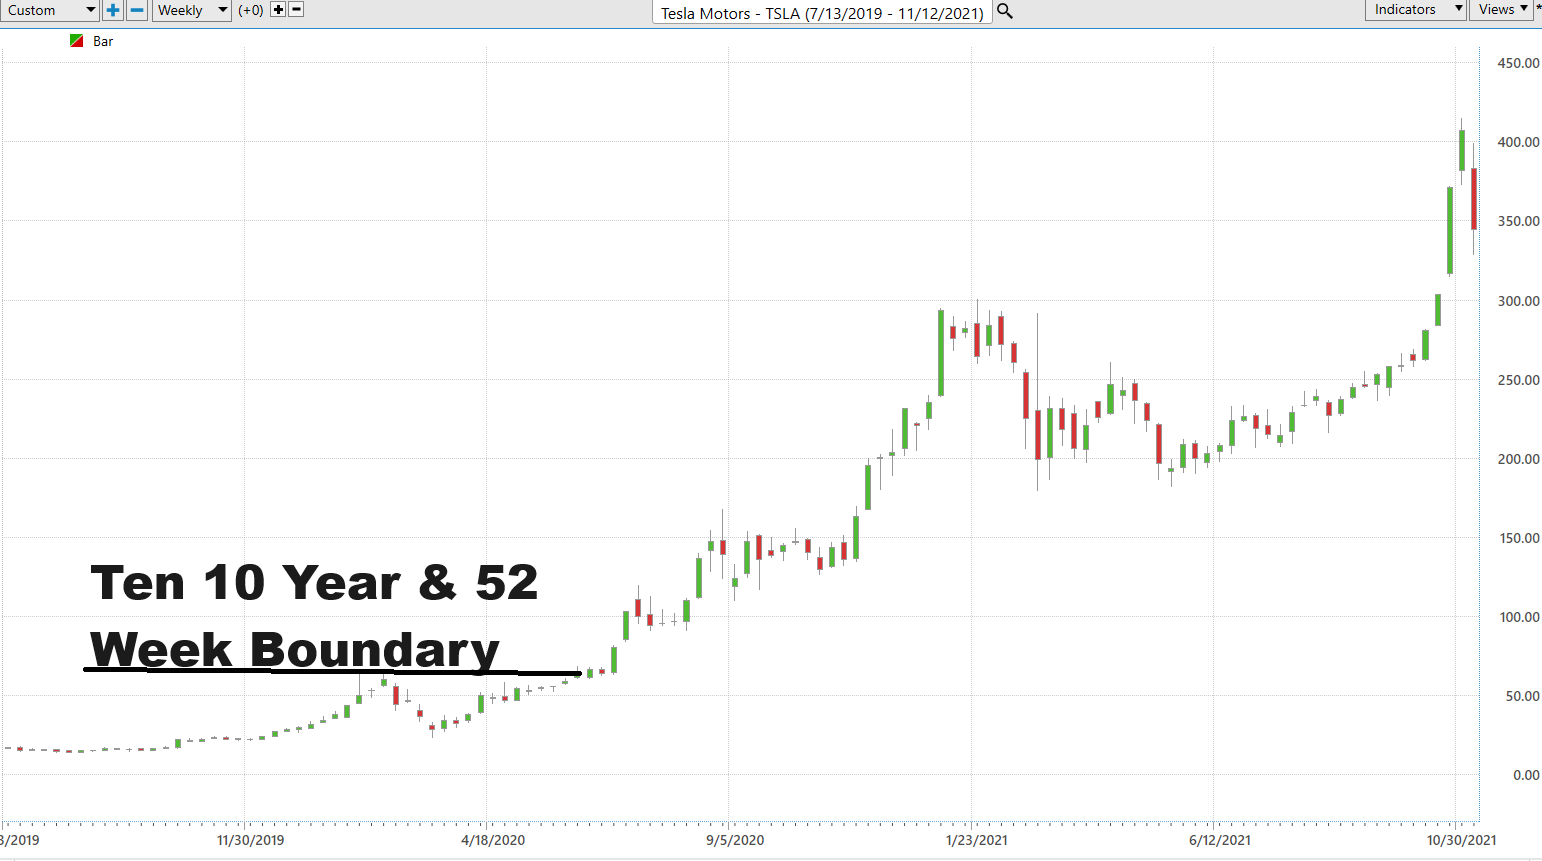
Over the last few years, we have seen monster moves in stocks like $NVDA, $AAPL, $TSLA, $META, $ABBV, $AXP. Once these charts were making 52-week highs and 10-year highs simultaneously they all had SUPER explosive moves.
Here’s $AAPL:
Here’s $TSLA:
Here’s $NVDA:
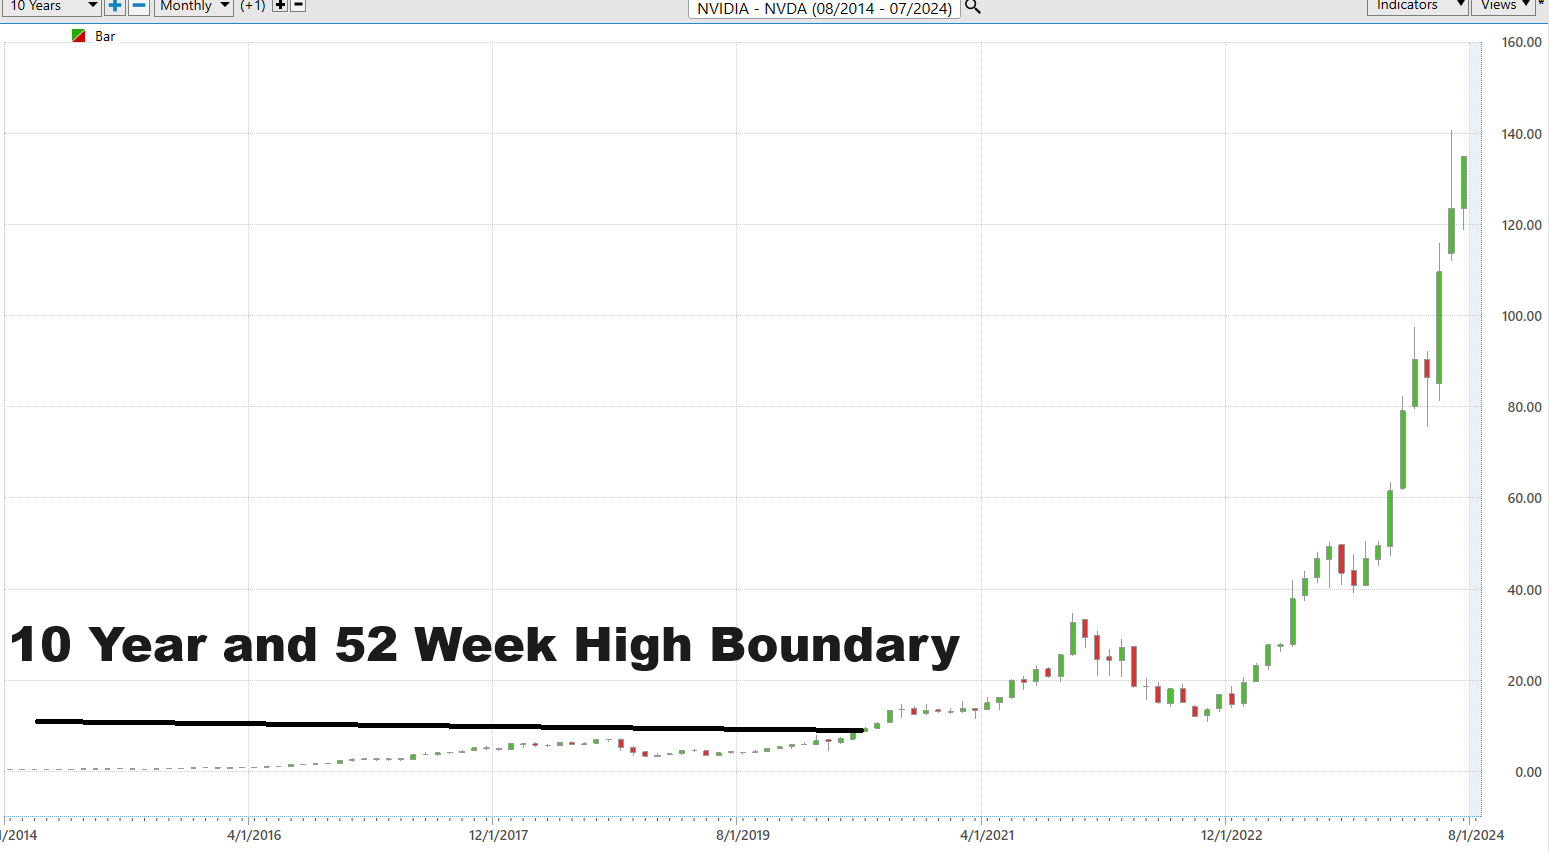
If you walk away with one gem from this article, be aware of assets that are simultaneously making new 52 week and 10-year highs. These are rare and when they occur, they are capable of creating legacy wealth.
Silver is currently in this SETUP. Pay Attention.
It’s very hard to analyze is SILVER and not see huge value and massive upside potential.
When “IS” and “SHOULD” meet some pretty explosive things can happen and my analysis concludes that in the SILVER market “IS” and “SHOULD’ are joining hands.
That is why today I always recommend that traders, investors, and those interested in simply preserving their purchasing power learn how to trade with artificial intelligence.
Imagine a future where economic challenges don’t just threaten your financial stability—they present opportunities for prosperity. This is the power of Artificial Intelligence (AI) in trading . Our A.I. forecasting software is meticulously crafted to position you advantageously in the market, enabling you to make the most informed, timely, and profitable decisions.
Think of the control you’ll have over your financial future with this technology at your fingertips. Don’t let inflation erode your savings. Join forward-thinking investors leveraging AI to surpass average financial returns.
Act now. Embrace A.I.’s power, which continuously learns to avoid past mistakes and enhance future outcomes. This isn’t merely about dodging errors; it’s about actively seeking the most effective strategies in real time.
Excited yet? You should be! A.I. trading software is revolutionizing trading, just as it has dominated Poker, Chess, Jeopardy, and Go. If A.I. can outperform humans in these complex arenas, imagine the impact on your trading strategy.
Harness the sophisticated analysis only A.I. can provide and enter a realm of higher probability, more informed trading decisions. A.I. doesn’t just offer insights—it delivers actionable knowledge that can redefine your financial strategy. Don’t wait for economic tides to shift; take control with A.I.-driven trading tools.
You’re invited to an exclusive online Master Class: “Learn How To Trade With Artificial Intelligence.” Led by seasoned A.I. trading experts, this groundbreaking session will show you how A.I. can be your ultimate ally in understanding market trends, assessing risks, and pinpointing potential rewards. Discover how A.I. keeps you ahead by identifying the right trends at the right time.
Join us for a FREE Live Training.
We promise to arm you with critical insights and foresight in the financial market. Register now to secure your spot in this vital educational opportunity!
It’s Not Magic.
It’s Machine Learning.
Let’s Be Careful Out There!
THERE IS A SUBSTANTIAL RISK OF LOSS ASSOCIATED WITH TRADING. ONLY RISK CAPITAL SHOULD BE USED TO TRADE. TRADING STOCKS, FUTURES, OPTIONS, FOREX, AND ETFs IS NOT SUITABLE FOR EVERYONE.IMPORTANT NOTICE!
DISCLAIMER: STOCKS, FUTURES, OPTIONS, ETFs AND CURRENCY TRADING ALL HAVE LARGE POTENTIAL REWARDS, BUT THEY ALSO HAVE LARGE POTENTIAL RISK. YOU MUST BE AWARE OF THE RISKS AND BE WILLING TO ACCEPT THEM IN ORDER TO INVEST IN THESE MARKETS. DON’T TRADE WITH MONEY YOU CAN’T AFFORD TO LOSE. THIS ARTICLE AND WEBSITE IS NEITHER A SOLICITATION NOR AN OFFER TO BUY/SELL FUTURES, OPTIONS, STOCKS, OR CURRENCIES. NO REPRESENTATION IS BEING MADE THAT ANY ACCOUNT WILL OR IS LIKELY TO ACHIEVE PROFITS OR LOSSES SIMILAR TO THOSE DISCUSSED ON THIS ARTICLE OR WEBSITE. THE PAST PERFORMANCE OF ANY TRADING SYSTEM OR METHODOLOGY IS NOT NECESSARILY INDICATIVE OF FUTURE RESULTS. CFTC RULE 4.41 – HYPOTHETICAL OR SIMULATED PERFORMANCE RESULTS HAVE CERTAIN LIMITATIONS. UNLIKE AN ACTUAL PERFORMANCE RECORD, SIMULATED RESULTS DO NOT REPRESENT ACTUAL TRADING. ALSO, SINCE THE TRADES HAVE NOT BEEN EXECUTED, THE RESULTS MAY HAVE UNDER-OR-OVER COMPENSATED FOR THE IMPACT, IF ANY, OF CERTAIN MARKET FACTORS, SUCH AS LACK OF LIQUIDITY. SIMULATED TRADING PROGRAMS IN GENERAL ARE ALSO SUBJECT TO THE FACT THAT THEY ARE DESIGNED WITH THE BENEFIT OF HINDSIGHT. NO REPRESENTATION IS BEING MADE THAT ANY ACCOUNT WILL OR IS LIKELY TO ACHIEVE PROFIT OR LOSSES SIMILAR TO THOSE SHOWN.