One of the fascinating things that occurs to me quite regularly is that a particular chart catches my attention and I end up exploring “rabbit holes” that are fascinating and shape my investing and trading thesis. Let me explain.
Going on your first impression, when you look at the following chart, does it appear bullish, bearish, or stable? In other words, how would you trade the following chart?
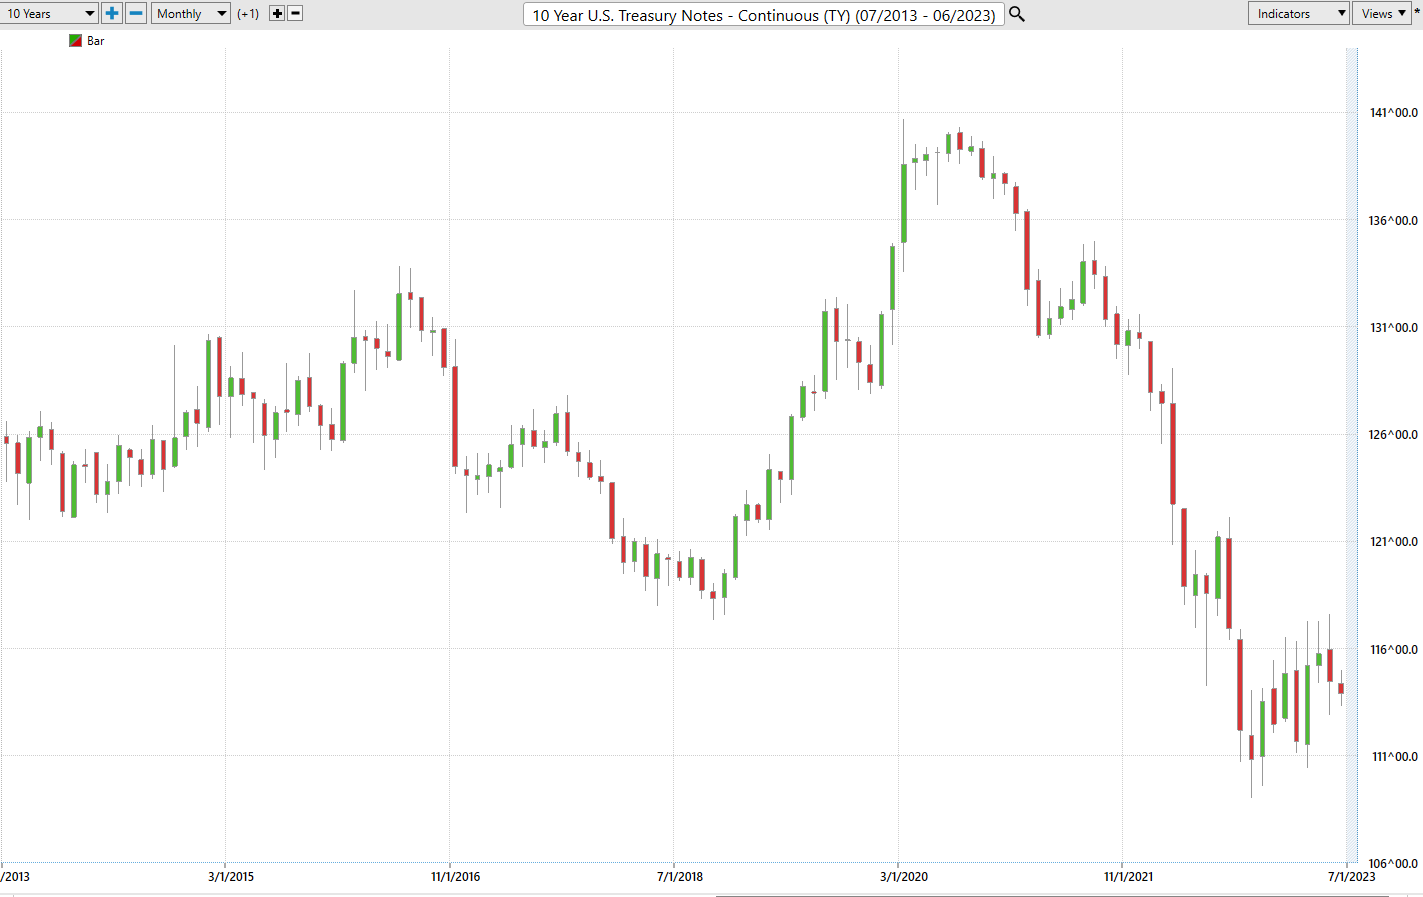
When I look at that chart, I am thinking “sell rallies” because this chart looks ugly, and we are going lower. My opinion might be wrong, but my opinion is formed through many years of studying charts and living through the statistical outcomes of my conclusions. But this is how all my charting “rabbit hole” excursions begin.
The reason this chart should be of interest to you as well is because the chart is the U.S. Treasury Note market which is one of the largest markets in the world. Over the last 40 months it is down 18.64%. For every $100,000 invested in U.S. Treasuries over this time frame the buyer is down $26,200! This is consequential because it completely explains the banking crisis of 2023 which has receded from headline news over the past few weeks.
Banks are required by law to purchase U.S. Treasury assets and have had their portfolios decimated as the Federal Reserve has raised interest rates at the fastest pace in history. As interest rates increase, bond prices decrease, and the casualties are numerous. Leading financial publications like the Wall Street Journal and Bloomberg have reported that over 282 regional banks are facing insolvency. The insolvency would have already occurred if these financial institutions had to mark to market the gains or losses from their portfolios. So, we can thank accounting sleight of hand that this has not occurred.
One of the reasons the banking crisis is no longer front-page news is that it was superseded by the debt ceiling negotiations. While the debt ceiling has been raised, and will not be an issue until 2025, when you look at and study the budget, all that has occurred is that the politicians have agreed that we can borrow our way to prosperity. Pure folly.
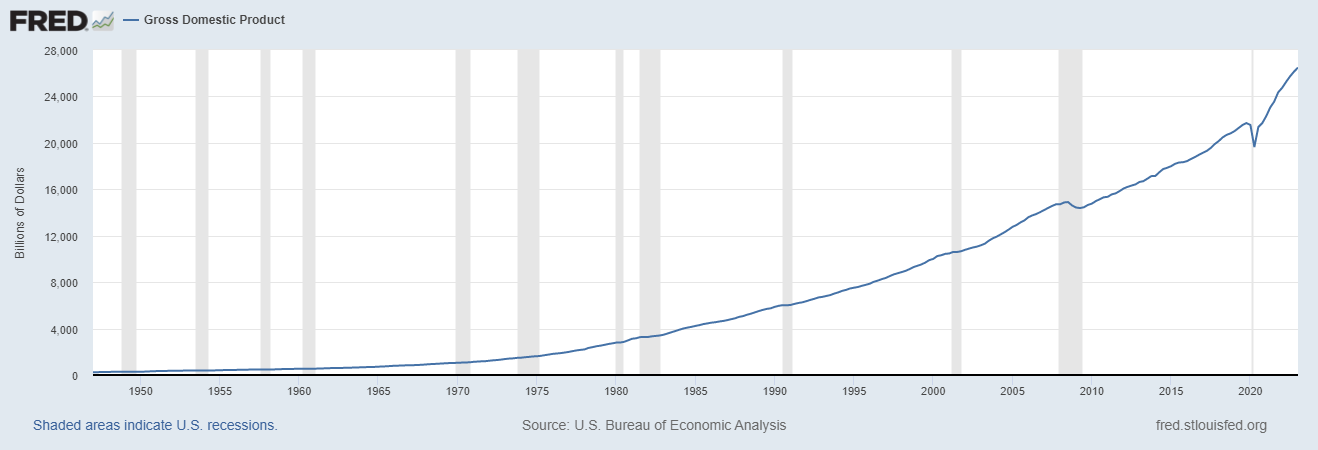
Here are a few charts maintained by the Saint Lous Fed which show you some startling realities.
First is the chart of U.S. Gross Domestic Product .
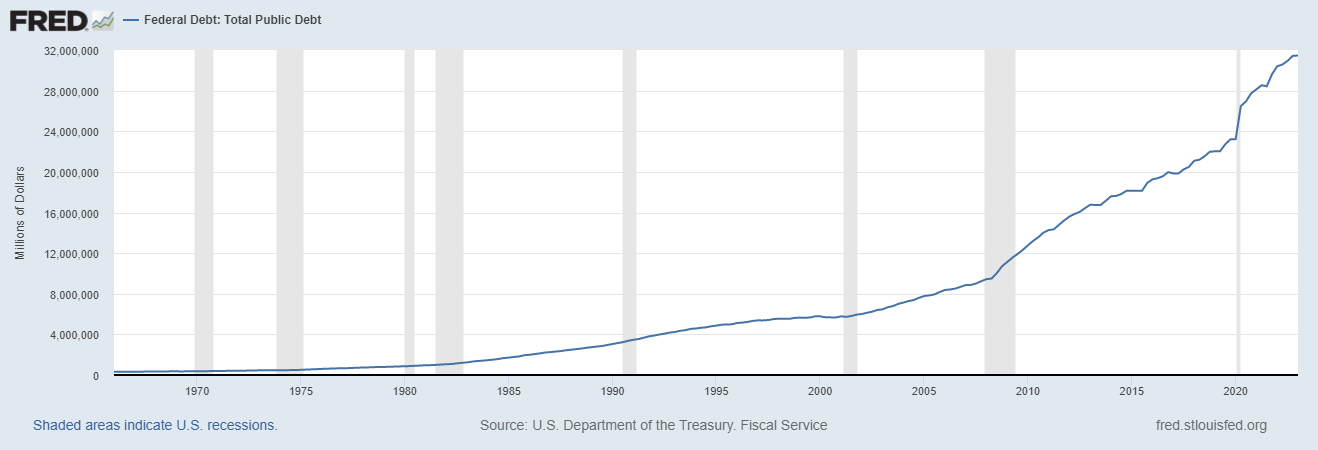
Next is the chart of Total U.S. Public Debt.
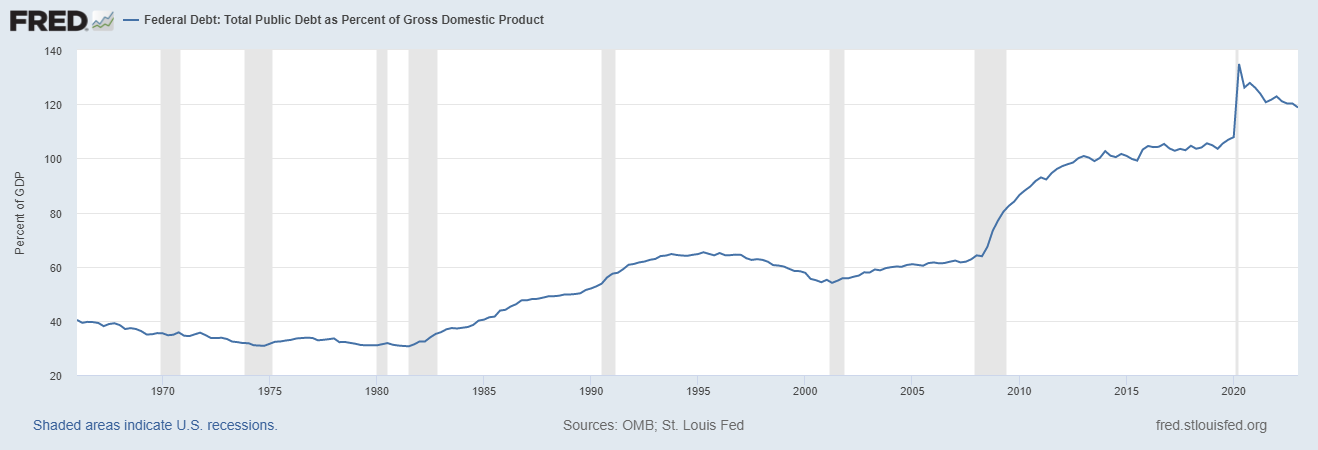
Last is Debt as a percentage of GDP.
If we start with 1980 as a baseline, we can see DEBT has grown 35.4x in the last 43 years.
The economy on the other hand has only grown 8.4x over the same time frame.
Looked at another way, DEBT has grown 3.17 times faster than the economy over the last 43 years. What is noteworthy about this insight is that it occurred in an era of massively declining interest rates . More importantly in 1980 Debt as a percentage of GDP was only 30%. Today, debt as a percentage of GDP is 120%!
Over the last 43 years, you need to create $3.17 of government debt to get $1 of GDP growth. Not exactly impressive by any standard of measurement.
Debt creation and deficit spending amidst an economic landscape of declining interest rates has been the ongoing formula for economic prosperity.
However, what I found striking about the recent debt ceiling negotiations is that our political class negotiated a deal to spend more in an economic environment of rising interest rates! The debt ceiling deal suspends US borrowing limits until 2025, after the next election. Both sides of the aisle will take a victory lap while spinning the reality that the government is spending much more than before!
As I have written about numerous times on this blog, the most toxic thing that occurred since the Great Financial Crisis was the edict and mandates by our monetary authorities to manipulate the interest rate environment to zero percent. We were told and assured that the low-interest rate environment would spur on economic growth. The most important price is capitalism, the cost of money. When the government decides that market forces cannot be trusted to create an efficient real cost of funds, we are no longer engaged in a capitalist economy.
Over the last several years, most government debt around the world has been toxic. What I mean by this is that when you subtract the inflation rate from the yield offered you would most often end up in a negative yield environment. Negative yields mean that you are guaranteed to lose money by investing in something that is offering a lower return than the prevailing inflation rate.
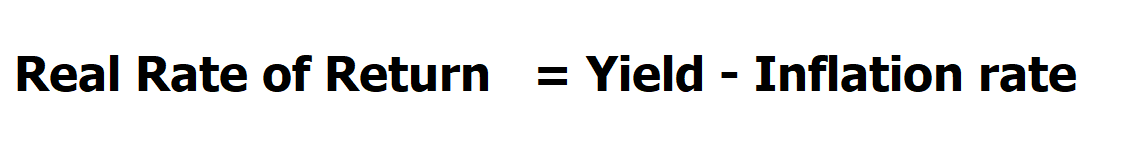
Whenever I listen to, or try to interpret FEDspeak it is always through the filter of how does this affect the Real Rate of Return for U.S. Treasuries? The most consequential thing Fed Chairman Jerome Powell is attempting to do is to correct the interest rate manipulation of his predecessors which created a toxic negative yield environment for U.S. Treasury assets. The Fed and U.S Treasury in their inability to offer a positive real rate of return have made American debt unattractive to investors.
To test this thesis out I looked at the largest economies in the world and compared their current inflation rates to the yield offered on their Treasuries to see how many of these countries were still toxic. It was horrifying!
While this table below is not an exhaustive study of the worldwide debt market it highlights how geopolitical rivals compete for funds in the great international yield chase.
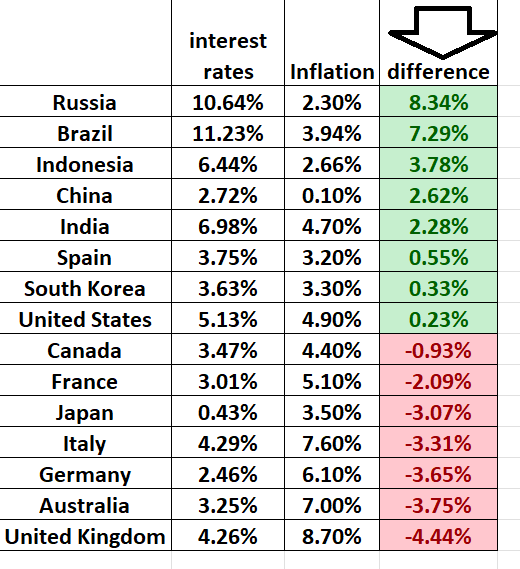
Simple question: Why is it that the BRICS nations (Brazil, Russia, India, China) are capable of offering a positive real rate of return on their Treasuries when the largest economies of the Western World with the exception of the United States are all still firmly negative?
I think this question will change the way you think about finance and how you choose to protect your portfolio.
In the table above, I chose to give the United States the rate on its 1-month T-bill. Had I not done this the U.S. would still be toxic and underwater. Please do not imply that I am suggesting we all go out and purchase debt from our geo-political rivals. Instead, I am simply making it obvious that the treasury obligations of Western Nations are still completely unattractive, and our economic rivals are very aware of this reality. My suspicion is that Treasury traders are also aware of this fact.
The BRICS system is expanding its membership, and they’ve even given themselves a catchy new name: BRICS+. I mean, who doesn’t love a little “+” symbol thrown in for good measure?
Let me break it down for you. We’ve got eight nations that have officially applied for membership, including Algeria, Argentina, Bahrain, Egypt, Indonesia, Iran, Saudi Arabia, and the United Arab Emirates. And that’s not all! We’ve got another 17 countries expressing interest in joining the club. The list includes Afghanistan, Bangladesh, Belarus, Kazakhstan, Mexico, Nicaragua, Nigeria, Pakistan, Senegal, Sudan, Syria, Thailand, Tunisia, Turkey, Uruguay, Venezuela, and Zimbabwe.
But here’s the real kicker: if Saudi Arabia and Russia both become members, that means that two of the three largest oil producers in the world will be BRICS members.
But hold on because we’re not done yet. When it comes to GDP, these guys mean business. China, India, Brazil, Russia, and Saudi Arabia together boast a combined GDP of $29 trillion. That’s a staggering 28% of the global GDP. And if we measure it by purchasing power parity, well, then we’re talking about a mind-boggling 54%. Move over, Western economies!
And just to add a little spice to the mix, let’s not forget that Russia and China are among the top three nuclear arsenals in the world. Who needs peace and stability when you can have a good old-fashioned nuclear arms race?
So, my friends, let’s not kid ourselves. The BRICS aren’t just another debating club. They’re a substantial and credible alternative to Western hegemony. Brace yourselves for a wild ride because the BRICS+ are here to stay, and they are already shaking things up!
What are the consequences of this tragic reality for Western nations as the governments continue to seek to fund their operations? Certainly, there are massive geo-political issues and risks associated with only pursuing the highest yield.
But what is also quite clear is that the United States, because of its world reserve currency status, is still the cleanest dirty shirt of the shelf. This means that compared to our democratic allies that they would much rather invest in our government debt than in their own. I’m sure you see the fallacy in that argument.
A dirty shirt is still a dirty shirt.
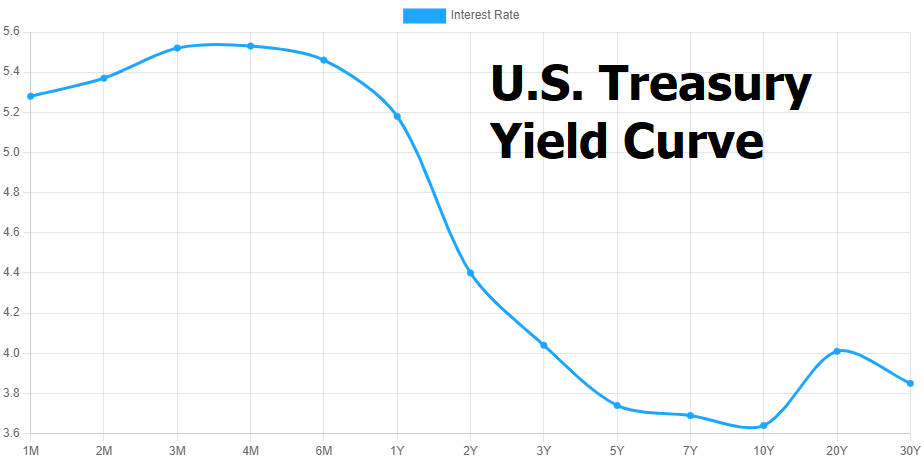
But this reality also carries with it some other disturbing ramifications. In a world of declining interest rates, governments could stack old debt upon new debt and since interest rates were falling you could manage to keep the debt payment comparable each and every year. But in an increasing interest rate environment the time eventually arises to pay the piper. The U.S. government is now refinancing all of its debt obligations on the short end of the yield curve. Meaning that most public debt will be auctioned off on the 3 years to 5-year end of the yield curve to try and offer investors higher rates of return.
What is the problem with this scenario?
Economists refer to this as crowding out.
The concept of “crowding out” in economics refers to the phenomenon where increased government spending or borrowing reduces private sector investment. In the context of the public sector, when the government increases its spending or borrows more money, it competes with private investors for financial resources, leading to a decrease in private investment.
Traditional economic theory states that when the government borrows more money from the financial markets to finance its spending, it increases the demand for loanable funds. This increased demand puts upward pressure on interest rates because the supply of loanable funds is limited. As interest rates rise, it becomes more expensive for businesses and individuals to borrow money for investment purposes. Higher borrowing costs discourage private investment, leading to a reduction in overall investment levels.
To further complicate the matter, to finance increased public spending, the government may choose to raise taxes on individuals and businesses. Higher taxes reduce the disposable income of households and the profits of businesses. As a result, individuals have less money available for savings and investment, while businesses have lower retained earnings to reinvest. This reduction in private savings and retained earnings diminishes the pool of funds available for private investment, leading to a decrease in investment activity.
With the government doing everything in its powers to make American yields more attractive, unless there is less government spending what we can count on is MORE government debt being financed on the short-term end of the yield curve, at higher and higher rates. We are creating an economic landscape where private investment is crowded out by excessive government spending.
I wrote about this last week when I stated that:
“Currently, the earnings yield on the S&P 500 Index is 5.46%. Money managers use this metric to define a risk premium. Ideally, they want this metric to be substantially higher than what they can earn in a risk-free instrument like a treasury bill. The principle here is that money will always move to wherever it is treated best. Money managers are always chasing yield and recognize the need to balance return against potential risk. ”
The bottom line is you can’t borrow your way to prosperity.
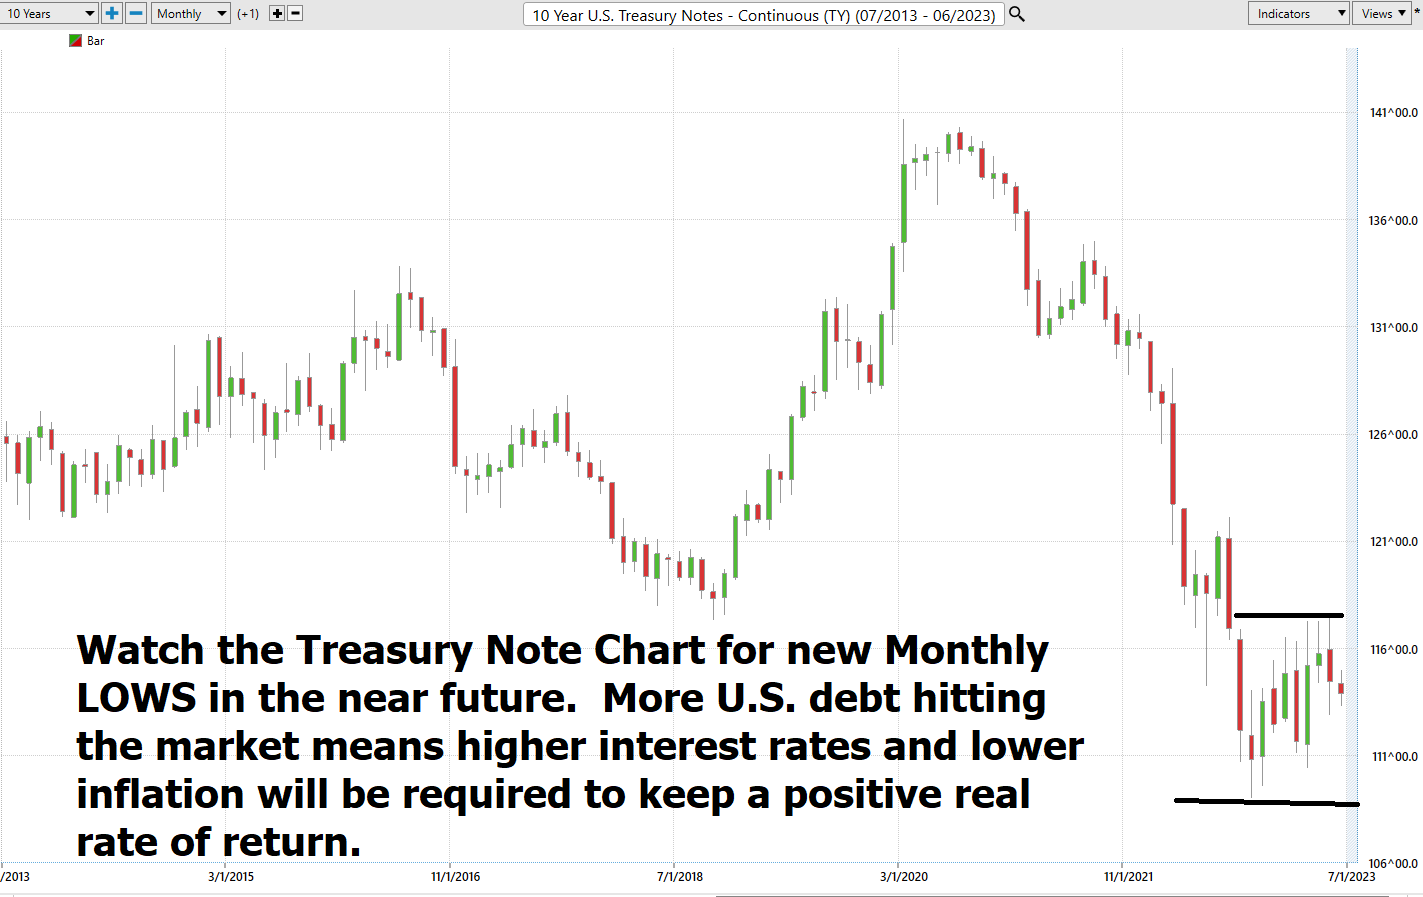
Getting back to the U.S Treasury chart… Look at it now, in a new unit of time. Would you buy it, sell it, or do you think it is stable?
My conclusion is that with trillions of new debt hitting the market, the government will have to keep inflation low and interest rates high to keep a real positive rate of return. Otherwise, U.S. Treasuries will remain “TOXIC assets.”
Can government keep inflation low? I’ll believe it when I see it. Trillions of new money are being created out of thin air.
Over the last three years government debt has risen by $8.2 trillion. Meanwhile, the GDP is growing at less than 60% of that pace. Not a good sign of economic prosperity.
What does this mean to you as a trader?
How comfortable have you been with the performance of your portfolio over the past few years?
How comfortable are you in an economic landscape where the solution to every economic problem is creating money out of thing air, and then wondering why the economy is massively inflationary?
How do you think your investment portfolio compares when pitted against artificial intelligence?
In the future:
AI will be your physician.
AI will be your transportation.
AI will be your teacher and that of your children .
AI will also be your investment consultant.
For the last 44 years, our mission at Vantage Point has been to focus specifically on offering traders machine learning, neural networks, and artificial intelligence solutions.
We are in uncharted waters.
The only thing that a trader is concerned with is being on the right side, of the right market at the right time.
And that means harnessing the power of VantagePoint’s artificial intelligence .
Everything else is just noise.
The race to debase is very real. This economic environment is forcing traders into much shorter time frames as everyone in the marketplace chases yield.
Real asset prices will keep rising as the yield chase intensifies and our economy will continue its addiction to a horrible monetary stimulus.
Do you have the tools and ability to find the strongest trends at right time in this economic environment? What is your plan for maintaining your purchasing power as this trend accelerates?
I’d like to invite you to visit with us at one of our live Master Class Webinars where we show how artificial intelligence is the only means to stay consistently up to date on the risk and reward opportunities in this environment.
Visit With US and check out the a.i. at our
It’s not magic. It’s machine learning.
Make it count.
THERE IS A SUBSTANTIAL RISK OF LOSS ASSOCIATED WITH TRADING. ONLY RISK CAPITAL SHOULD BE USED TO TRADE. TRADING STOCKS, FUTURES, OPTIONS, FOREX, AND ETFs IS NOT SUITABLE FOR EVERYONE.IMPORTANT NOTICE!
DISCLAIMER: STOCKS, FUTURES, OPTIONS, ETFs AND CURRENCY TRADING ALL HAVE LARGE POTENTIAL REWARDS, BUT THEY ALSO HAVE LARGE POTENTIAL RISK. YOU MUST BE AWARE OF THE RISKS AND BE WILLING TO ACCEPT THEM IN ORDER TO INVEST IN THESE MARKETS. DON’T TRADE WITH MONEY YOU CAN’T AFFORD TO LOSE. THIS ARTICLE AND WEBSITE IS NEITHER A SOLICITATION NOR AN OFFER TO BUY/SELL FUTURES, OPTIONS, STOCKS, OR CURRENCIES. NO REPRESENTATION IS BEING MADE THAT ANY ACCOUNT WILL OR IS LIKELY TO ACHIEVE PROFITS OR LOSSES SIMILAR TO THOSE DISCUSSED ON THIS ARTICLE OR WEBSITE. THE PAST PERFORMANCE OF ANY TRADING SYSTEM OR METHODOLOGY IS NOT NECESSARILY INDICATIVE OF FUTURE RESULTS. CFTC RULE 4.41 – HYPOTHETICAL OR SIMULATED PERFORMANCE RESULTS HAVE CERTAIN LIMITATIONS. UNLIKE AN ACTUAL PERFORMANCE RECORD, SIMULATED RESULTS DO NOT REPRESENT ACTUAL TRADING. ALSO, SINCE THE TRADES HAVE NOT BEEN EXECUTED, THE RESULTS MAY HAVE UNDER-OR-OVER COMPENSATED FOR THE IMPACT, IF ANY, OF CERTAIN MARKET FACTORS, SUCH AS LACK OF LIQUIDITY. SIMULATED TRADING PROGRAMS IN GENERAL ARE ALSO SUBJECT TO THE FACT THAT THEY ARE DESIGNED WITH THE BENEFIT OF HINDSIGHT. NO REPRESENTATION IS BEING MADE THAT ANY ACCOUNT WILL OR IS LIKELY TO ACHIEVE PROFIT OR LOSSES SIMILAR TO THOSE SHOWN.