On Wall Street, where traders are always on the lookout for the next edge, the STOCHASTIC indicator stands tall. Its reputation as a top-tier momentum-following tool is well-deserved. It’s a compass, guiding traders through the intricate dance of market movement. Yet, it’s staggering how many traders, even seasoned ones, don’t truly grasp the tools they can wield. Some, in a more concerning twist, misuse these indicators, leading to avoidable trading missteps.
Let’s embark on a journey to truly understand the STOCHASTIC indicator, shedding light on its mechanics and how it can elevate your trading game. If you are a VantagePoint Family Member, and do not have the Stochastic Indicator, be sure to reach out to your VantagePoint University Instructor or Coach and ask about it.
The key thing about the stochastic indicator is that it measures momentum and will be quite precarious to a trend follower.
Let me explain.
**The Essence of the STOCHASTIC Indicator**
The STOCHASTIC indicator isn’t just another tool; it’s a window into the momentum and strength of market trends. George C. Lane, the genius behind the Stochastic Oscillator, introduced it in the 1950s. His vision? To create a momentum indicator that reflects the closing price relative to the high-low range over a specific period.
The formula for the stochastic indicator is essentially measuring where price currently is based upon the range of the time frame being measured.
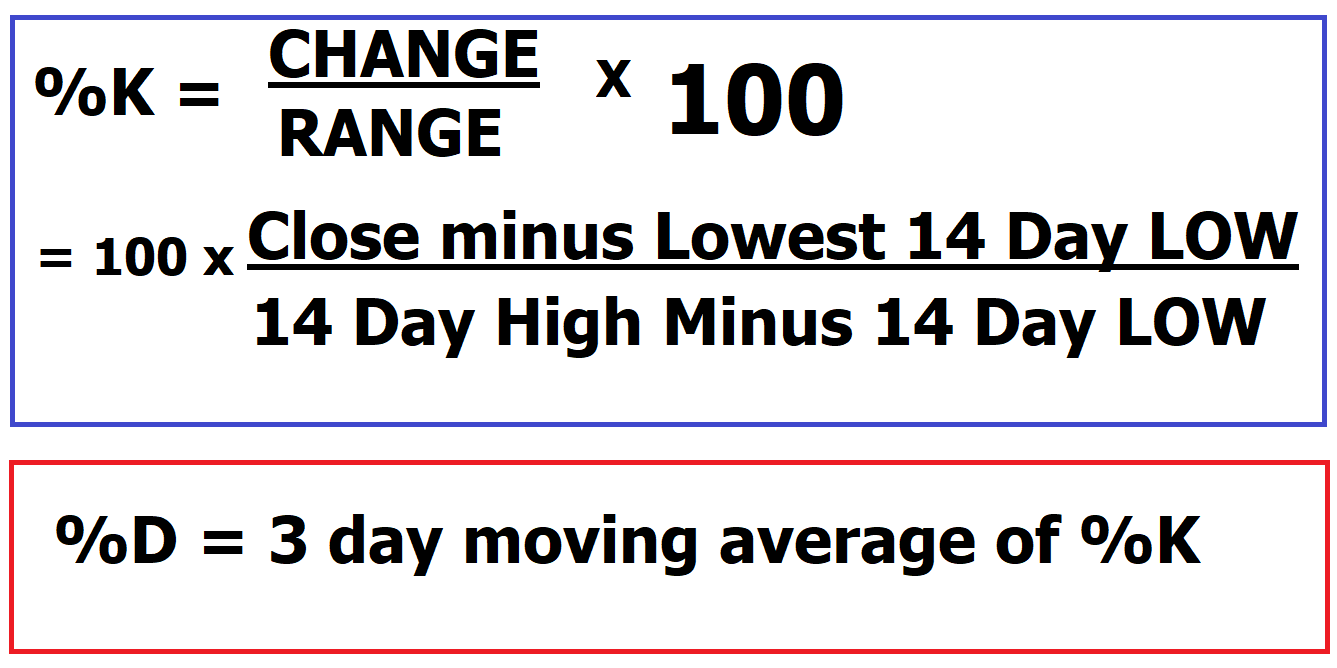
At its core, the Stochastic Oscillator measures the momentum of price movements. It oscillates between 0 and 100. I like to tell traders that whatever value the stochastic prints is very similar to the percentile which the market is trading at for the time frame being measured. Traders who don’t understand how the stochastic measures and what it is measuring often get hung up on the vocabulary of overbought and oversold. This is very unfortunate, and I hope I can disabuse you of that.
The Oscillator comprises two lines: %K and %D. Their dance, especially the crossovers, can be a telltale sign of upcoming market moves.
Momentum is like a push that makes things keep moving in the same direction.
If something is going fast and doesn’t stop, it has strong momentum; if it’s going slowly or stops, its momentum is weak. Momentum, in the context of physics and finance, refers to the tendency of an object or asset to keep moving in its current direction due to its mass and velocity. In physics, it’s a property of moving objects, while in finance, it’s a measure of the strength and persistence of a price trend, often indicating whether an asset is likely to continue rising or falling.
Imagine you’re bouncing a ball. If the ball goes up after the bounce, that’s like having positive momentum going up. As the ball loses velocity and changes direction after the bounce, that’s like having negative momentum going down. A scientist who studies how things move (a physicist) looks at how fast the ball is going, and a math expert (a mathematician) looks at how the ball’s position changes over time to figure out if the momentum is going up or down. Both use different ways to understand if the ball’s momentum is going in an “up” or “down” direction. What the mathematician and physicist are doing is essentially trying to measure the rate of acceleration or deceleration.

The reason this simple metaphor is important to understand is that markets traditionally only trend 30% of the time. That means that 70% of the time a market is bound within a trading range.
Trending in the context of the price of an asset refers to the consistent direction and strength of its price movement over a certain period. If the price is consistently going up over time, it’s called an uptrend. Conversely, if the price is consistently going down, it’s a downtrend. Identifying trends helps us understand whether an asset’s value is generally increasing or decreasing and can guide investment decisions.
Rangebound or non-trending, when it comes to the price of an asset, means that the price is staying relatively stable without showing a clear and consistent upward or downward movement. It’s like the price is bouncing around within a certain range without going significantly higher or lower. This kind of situation might happen when the market doesn’t have a strong push in either direction, and the price stays in the same area for a while.
In a non-trending market, the stochastics indicator is one of the most effective means of measuring momentum and can be an incredible indicator. In a trending market, the stochastics indicator must be used within the context of the prevailing trend.
A common pitfall among traders is the tendency to impulsively act on overbought and oversold signals. A closer look at market trends reveals that when the stochastic indicates an overbought status, with readings soaring above 80, some traders hastily decide to short. The outcome? The market often rallies in response.
For those well-versed in the intricacies of stochastic, it’s evident that the market is on an upward trajectory. The core definition of stochastics underscores its role in gauging momentum. Consequently, when traders are short during an overbought phase, they’re essentially betting against both the prevailing trend and robust momentum. This strategy often backfires, leading to repeated losses. The takeaway for traders: exercise caution and avoid shorts based solely on stochastic readings, especially in a bullish market.
In a trending market the stochastics indicator is often counterproductive. If you want to understand why, you simply must understand what the stochastics formula is measuring. Whatever the value that the stochastics is printing it tells you at what percentile the market is trading within the time frame and range being measured. For example, if the stochastics is printing 70 this tells us that price is trading at the 70 th percentile of the range.
In a trend, the range, the denominator measures the distance between the highest price and lowest price for the time frame being measured . If the range is expanding that often is the first clue that the market is trending.
- It is more difficult to measure momentum for a force that continues to expand.
- If the range is consistent that tells you that most likely the market is non-trending.
- If the range is expanding, that is a clue that a trend is in place.
This is the dilemma of the Stochastics Oscillator. It is a phenomenal tool to use in non-trending markets. It is much more difficult to measure momentum in a trending market. The stochastic indicator operates on a fundamental principle. When dealing with an upward-trending market, a typical pattern emerges where prices tend to wrap up trading sessions in proximity to their highest points. Conversely, within a downward-trending market, prices tend to conclude near their lowest points. However, when the closing price starts to deviate from these high or low markers, it serves as an indicator that the previously strong momentum driving the market is starting to lose steam. This analytical tool thus aids in identifying shifts in momentum based on these observed patterns.
**Decoding Momentum**
Let me explain with some simple arithmetic. Let’s say you are looking at a stock and using stochastics.
Over the last 14 days the highest high price has been 100, the lowest low price is 90 and it is currently 98.
What this simple example tells us is that the range of the last 14 days is 10 points and that the price of 98 is 8 points from the lowest low measured. So, we can compute that the stock is trading at the 80th percentile of the trading range of that time frame and the stochastic is printing 80%.
Now let’s assume that the very next day the market goes to 105 and closes at 102. As a trader the stochastic is measuring 2 things.
- What is the new range?
- Where are we on a percentile basis in relation to that new range?
The highest price of the last 14 days is 105.
The lowest price is still 90.
This tells us that the new range is 15.
The range just expanded from 10 to 15. This is the first indication that we are in a trending market.
Since the market closed at 102 when we apply the stochastic formula to what transpired we get the following:
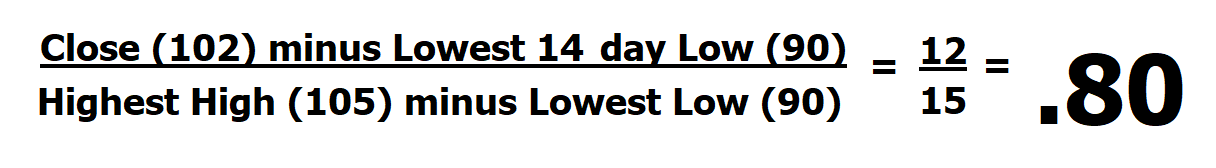
The market closed 4 points higher because it started trending and yet the stochastic indicator remained the same.
If you understand what the stochastic measures are and how it makes its measurement you ONLY need to determine whether the market, you are analyzing is trending or non-trending. Many traders use moving averages to define whether the market is trending or non-trending.
Vantagepoint A.I. Power Traders use the Short Term and Long-Term Predictive Difference to determine whether the market is trending or non-trending.
I share this perspective with you because the most EXPENSIVE words in a trader’s vocabulary during trending markets are the two words OVERBOUGHT and OVERSOLD.
The stochastic indicator measures these overbought and oversold levels phenomenally well in a non-trending market. However, when a market is trending you need to put the vocabulary of OVERBOUGHT and OVERSOLD on the back burner because the RANGE is expanding . Ignoring this reality is why many traders often complain that the Stochastic Indicator creates many false signals.
To use the stochastic indicator effectively we must first comprehend that it stands apart, focusing on price momentum.
This is important because momentum often shifts gears before the price does. But the very first question we must ask before using the stochastic indicator is, “is the market trending?”
We will interpret the stochastic depending upon whether the market is trending or non-trending.
- Trend following: As long as the Stochastic is above 80 it confirms a strong bullish trend. And a Stochastic below 20 points to a strong bearish trend.
- Reversals: When the Stochastic is changing direction and exits the overbought/oversold areas, it will often forecast a trend reversal.
- Strong trends: When the Stochastic is in the “oversold/overbought area”, don’t fight the trend but try to hold on to your trades and stick with the trend.
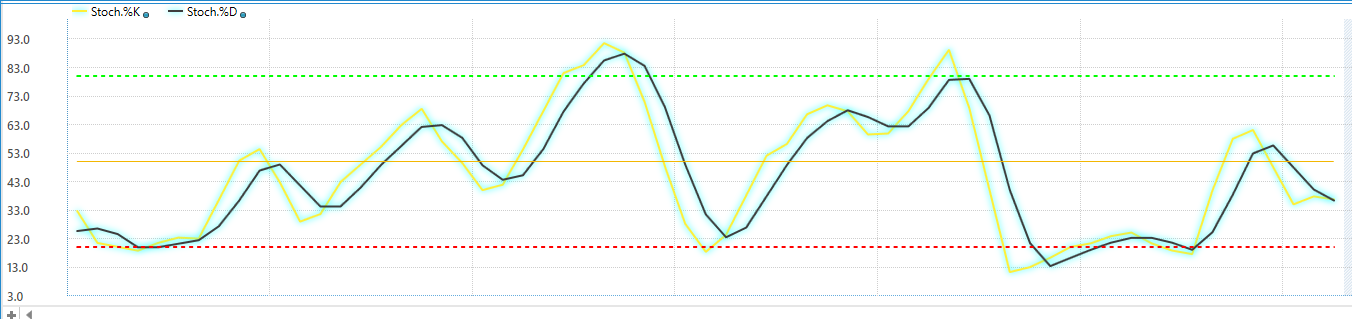
On your chart, the Stochastic Oscillator manifests as two distinct lines, aptly named the main and signal lines. Two pivotal levels, 20 and 80, come into play. When these lines dip below 20, in a non-trending market, it signals an oversold scenario. In a trending market a breach of 20 simply means a downward force is in play and, before we look to buy, we wait for the stochastics to move above the 20 level.
The inverse is also true. When the stochastics breach the 80 level, in a non-trending market we can say that the market is overbought, but in a trending market, it is a clue that an upward trend is in play, and we will not look to sell until the stochastic indicator falls below the 80 level.
We must always remember that markets are in a non-trending state 70% of the time and that Stochastics measure momentum.
Stochastics can seamlessly integrate into any charting setup, wielding a dynamic range spanning from 0 to 100. In essence, it serves as a window into the prevailing price’s relationship with its historical highs and lows across a predetermined timeframe. To delve into specifics, this timeframe generally comprises 14 individual periods but can be customized.
Delving further into the Stochastic we encounter the pairing of two distinct lines. The initial line, depicted as %K, gracefully appears beneath the chart upon the application of the stochastic indicator. This line mirrors the exact numerical value of the oscillator at any given point. Simultaneously, a counterpart enters the scene, recognized as %D. This line represents a three-period moving average of %K, effectively contributing a smoothed perspective to the indicator’s oscillations. The interplay of these two lines takes on significance. Their alignment, or lack thereof, potentially serves as an early indicator heralding a forthcoming reversal in market direction. This dance between %K and %D encapsulates the essence of the Stochastic oscillator, offering investors a nuanced lens through which to decipher underlying market dynamics.
The interpretation of the Stochastics oscillator will ALWAYS depend upon whether the market is trending or non-trending.
This is a very popular trading strategy.
Buy when the lines intersect beneath the oversold threshold and ride the wave upwards until they cross lower above the overbought marker. But to really make this indicator shine we must recognize that its strength lies in:
- Defining overbought and oversold levels in non-trending markets.
- Finding levels to buy in a trending market after a pullback.
- Finding levels to sell in a down-trending market after a rally.
I’ve always championed a deeper understanding of indicators. Knowing the mechanics behind the oscillations on your chart can offer invaluable insights. The Stochastic, despite its simplicity, can be a treasure trove of trend data.
Let’s look at a few charts with the Stochastic indicator to make this all come to life.
First is a chart of Callon Petroleum ($CPE ). When you look at the chart you can see that it is in a sideways pattern (non-trending). Over the past year $CPE has had a 52-week high at $50.19 and a 52-week low at $28.91.
The arrows on the chart are the moments that delineate the buy and sell signals that the stochastics oscillator generated based upon buying a breakout of the 20 level and selling a breakdown of the 80 level.
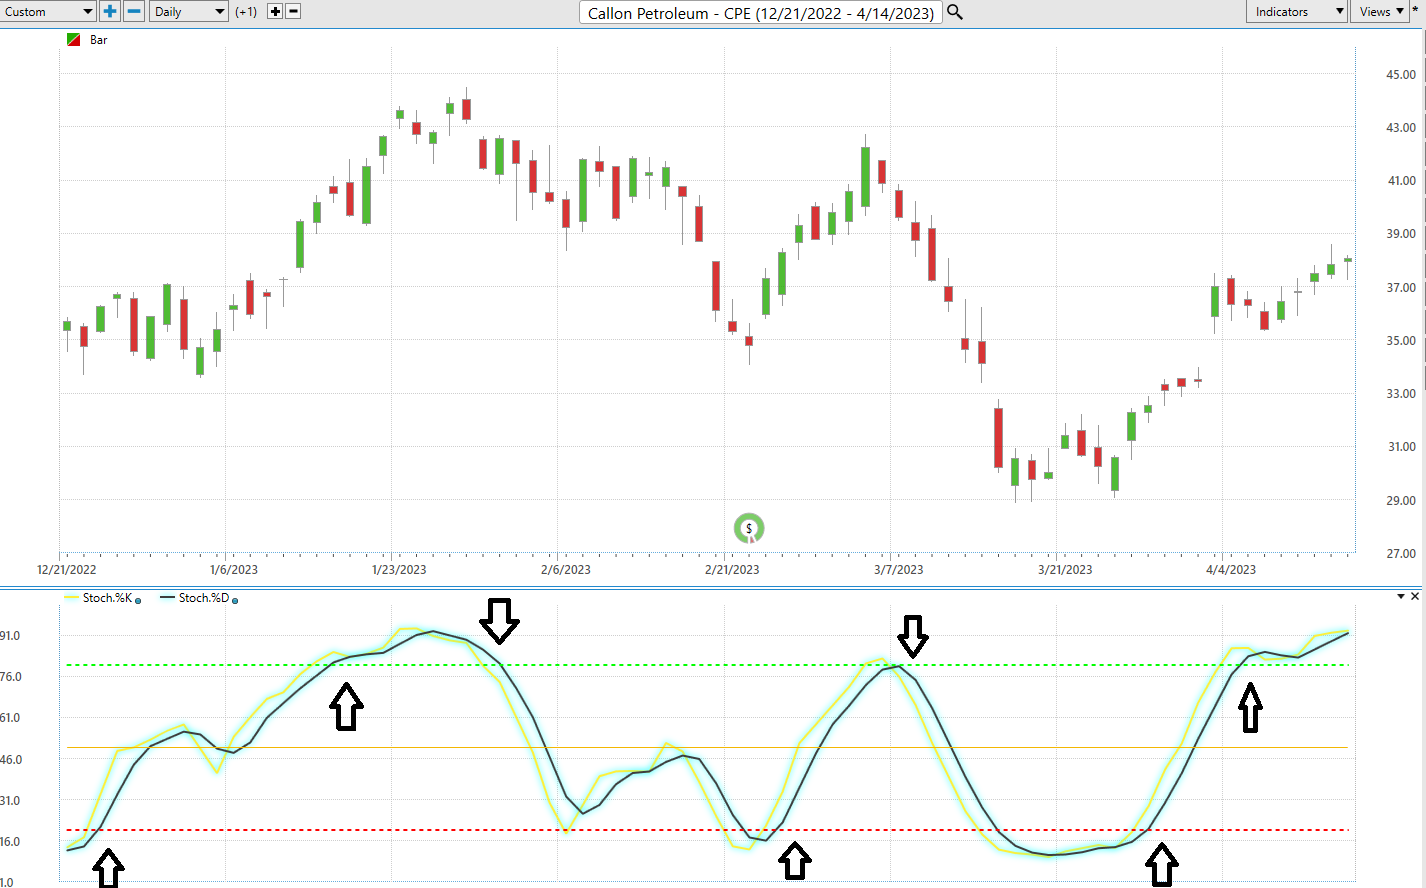
One additional way which traders late to the trend use the stochastics is that when the stochastics oscillator first breaches the 80 level in a trending market, they look to buy anticipating further strength and range expansion in the prevailing trend.
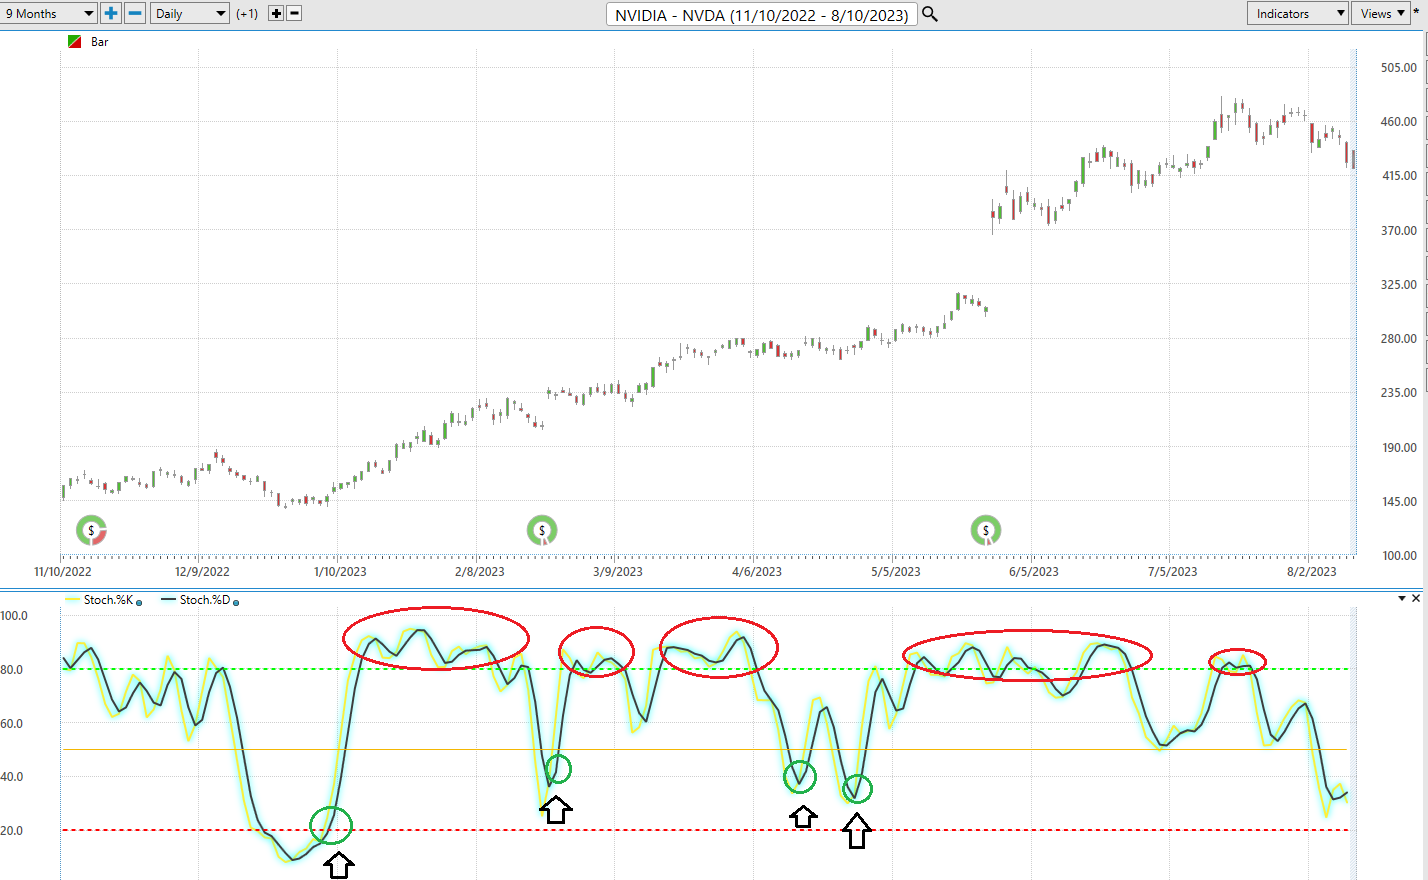
The following chart is NVIDIA ($NVDA) which has been one of the strongest performers for 2023. Over the past year $NVDA has traded as high as 480.88 and as low as 108.13. The RED circles on the stochastic oscillator are all the times that the market was trending, and momentum was strong and could have potentially created a false sell signal for a trader.
On the flipside, consider just the UP arrows on the chart which were all of the BUY signals generated by the Stochastic oscillator when momentum turned back up after a pullback occurred in the prevailing trend.
In a trending market there is no such thing as OVERBOUGHT! $NVDA is a perfect example of that as the prevailing trend continued to make higher highs and higher lows.
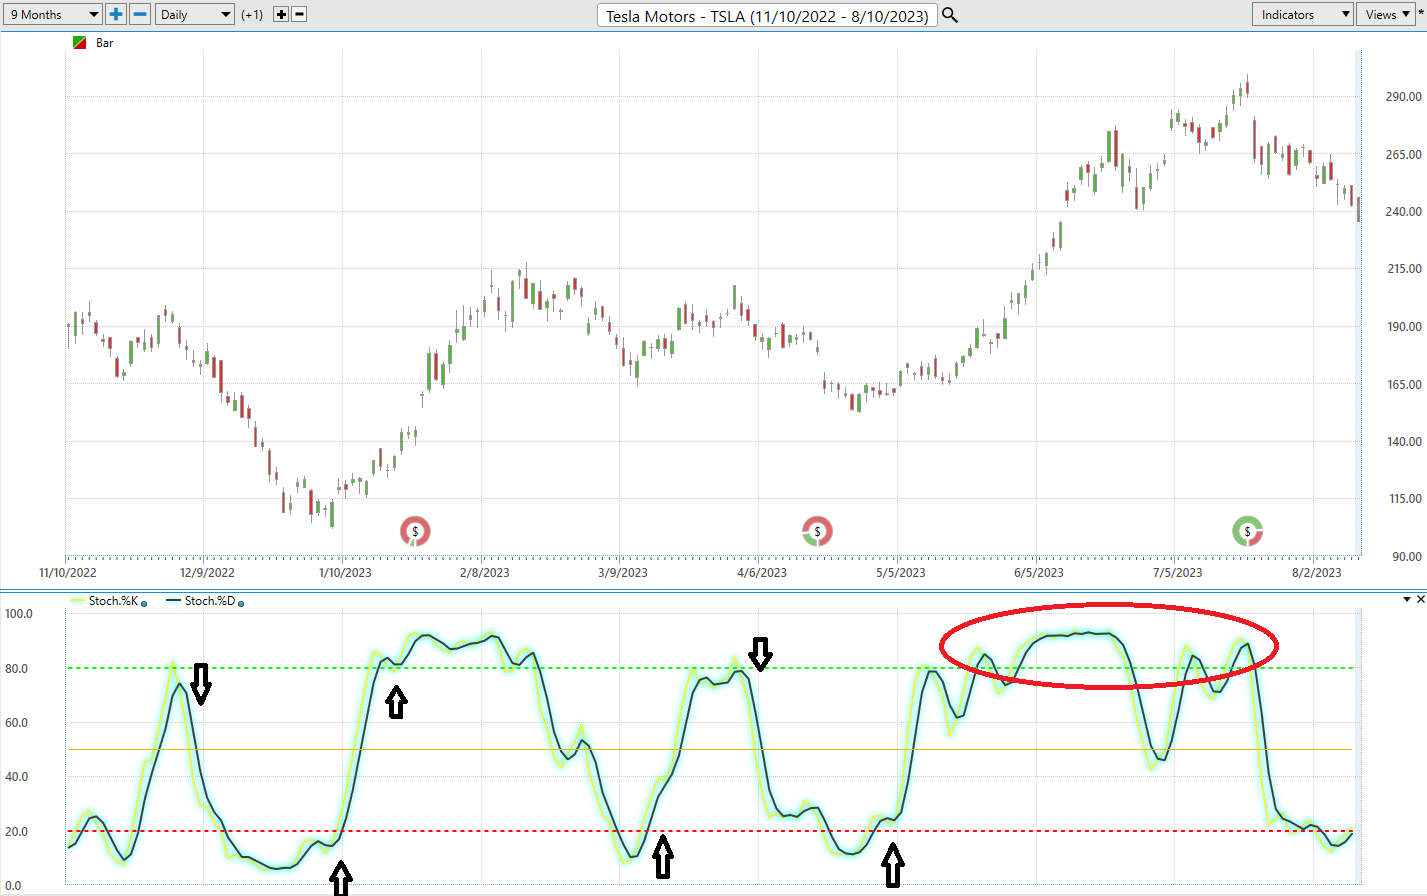
Here is a chart of TESLA ($TSLA) which also shows you the power of the Stochastics oscillator in both non-trending and trending markets. Over the past year $TSLA has traded as high as $314.67 and as low as $101.81.
Observe how TSLA traded in a broad sideways pattern until Mid-May 2023. The stochastic oscillator was incredible in isolating the low points and high points to trade. However, the red circles on the chart show you when the range expanded the momentum remained strong. During trends like this, great traders erase words like OVERBOUGHT from their vocabulary.
In closing, here are the steps and process for successful trading with the stochastic oscillator.
- Recognize that Stochastics measures momentum.
- ALWAYS DEFINE the TREND first using your favorite trend indicator. This is necessary to determine whether the market is trending or non-trending.
- In non-trending markets the areas of 20 and 80 on the Stochastic Oscillator measure overbought and oversold.
- In trending markets, you want to align the direction of momentum with the prevailing trend and remove the words overbought and oversold from your trading vocabulary. Use momentum to trade with the prevailing trend and never go against it.
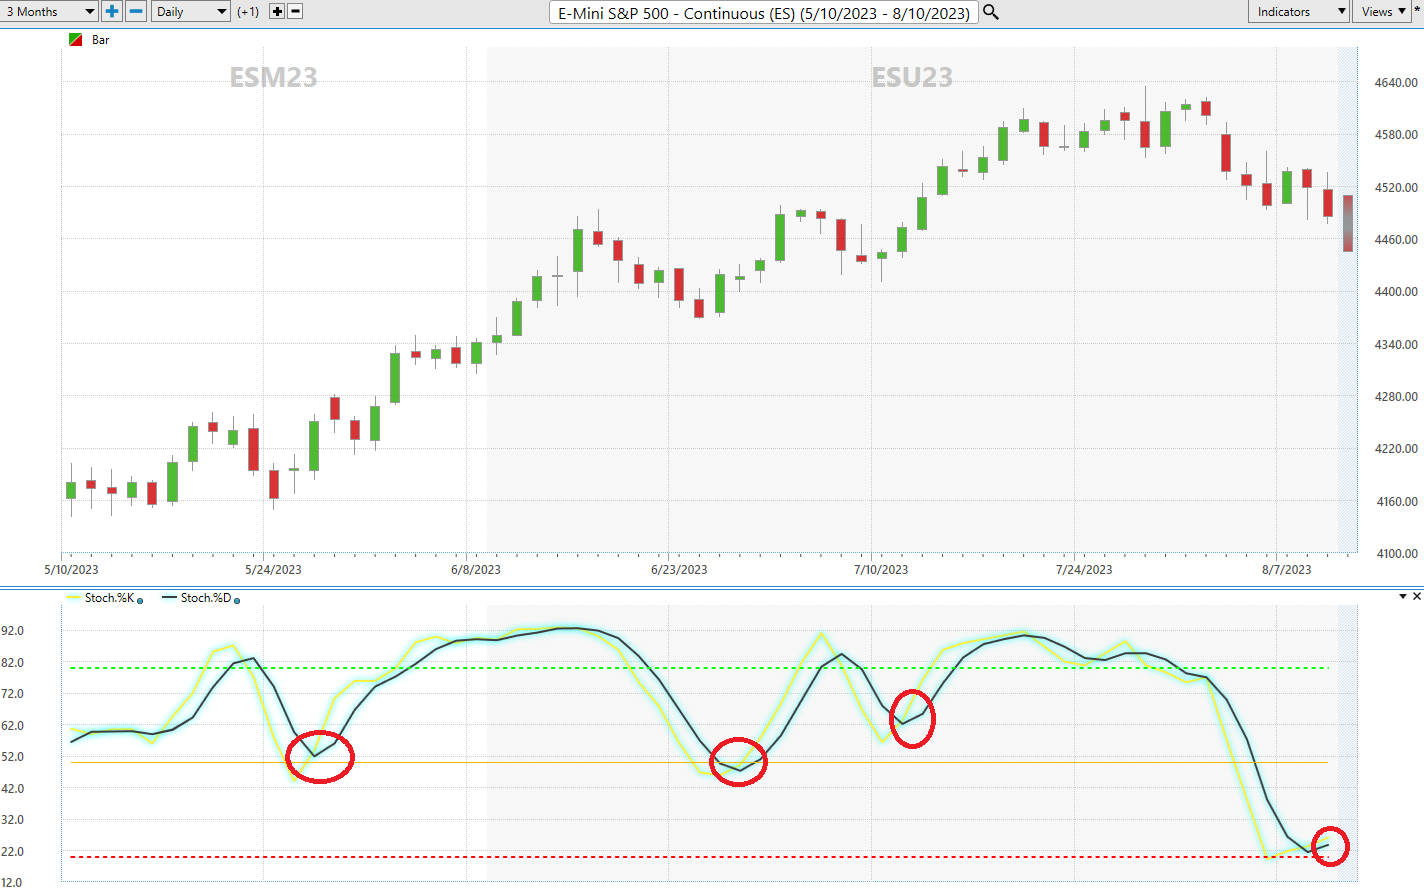
Let’s apply this to the S&P 500 Index.
The chart below clearly shows that the S&P 500 has been trending.
That means that we would be looking to use the stochastic indicator when momentum is moving back up after a pullback. I have isolated those areas in red on the chart below.
It’s imperative to invest time in understanding your arsenal of trading tools and understand how and what they are measuring. As we’ve seen with the Stochastic, it’s often straightforward, but the principles are potent.
The stochastic oscillator, when wielded with precision and understanding, stands as a formidable tool in a trader’s arsenal. In both trending and non-trending markets, it offers invaluable insights into momentum shifts, allowing traders to anticipate potential reversals or continuation of trends. However, its true potential is unlocked when combined with robust risk management principles. By ensuring that positions are taken with a clear understanding of potential losses, traders can harness the oscillator’s insights without overexposing themselves. In essence, a judicious use of the stochastic oscillator, paired with sound risk strategies, can be a game-changer, significantly enhancing trading outcomes and driving consistent profitability.
In the wild world of trading, the only real player is the price. Everything else? Just a bunch of background noise. Most traders trip over this simple truth, thinking the evening news should match up with the market’s dance.
Now, here’s a thought for you: While the big shots on Wall Street are losing sleep over STIMULUS, why not shift your gaze to the real game-changer: artificial intelligence. Let it guide your trading steps, showing you the trend and the smartest moves to make.
Forget the headlines. Ignore the talking heads on TV. And for heaven’s sake, don’t let some pundit’s opinion mess with your trading mojo.
Here’s the deal:
- Spot the trend.
- Identify Momentum
- Know Your Risk
- Embrace the fast-paced change.
We’re riding a thrilling wave, my friend. A.I. is the new sheriff in town, drawing the line between risk and reward. Think about it: A.I. has already whipped humans in Poker, Jeopardy, Go! and Chess. So, why would trading be any different?
Come on over and see this A.I. magic for yourself at our Next Free Live Training.
Find out why the pros are turning to Vantagepoint’s A.I. It’s the secret sauce for trading with confidence, bigger profits, and a whole lot less stress.
Discover why Vantagepoint’s artificial intelligence is the solution professional traders go-to for less risk, more rewards, and guaranteed peace of mind.
It’s not magic. It’s machine learning.
Make it count .
THERE IS A SUBSTANTIAL RISK OF LOSS ASSOCIATED WITH TRADING. ONLY RISK CAPITAL SHOULD BE USED TO TRADE. TRADING STOCKS, FUTURES, OPTIONS, FOREX, AND ETFs IS NOT SUITABLE FOR EVERYONE.IMPORTANT NOTICE!
DISCLAIMER: STOCKS, FUTURES, OPTIONS, ETFs AND CURRENCY TRADING ALL HAVE LARGE POTENTIAL REWARDS, BUT THEY ALSO HAVE LARGE POTENTIAL RISK. YOU MUST BE AWARE OF THE RISKS AND BE WILLING TO ACCEPT THEM IN ORDER TO INVEST IN THESE MARKETS. DON’T TRADE WITH MONEY YOU CAN’T AFFORD TO LOSE. THIS ARTICLE AND WEBSITE IS NEITHER A SOLICITATION NOR AN OFFER TO BUY/SELL FUTURES, OPTIONS, STOCKS, OR CURRENCIES. NO REPRESENTATION IS BEING MADE THAT ANY ACCOUNT WILL OR IS LIKELY TO ACHIEVE PROFITS OR LOSSES SIMILAR TO THOSE DISCUSSED ON THIS ARTICLE OR WEBSITE. THE PAST PERFORMANCE OF ANY TRADING SYSTEM OR METHODOLOGY IS NOT NECESSARILY INDICATIVE OF FUTURE RESULTS. CFTC RULE 4.41 – HYPOTHETICAL OR SIMULATED PERFORMANCE RESULTS HAVE CERTAIN LIMITATIONS. UNLIKE AN ACTUAL PERFORMANCE RECORD, SIMULATED RESULTS DO NOT REPRESENT ACTUAL TRADING. ALSO, SINCE THE TRADES HAVE NOT BEEN EXECUTED, THE RESULTS MAY HAVE UNDER-OR-OVER COMPENSATED FOR THE IMPACT, IF ANY, OF CERTAIN MARKET FACTORS, SUCH AS LACK OF LIQUIDITY. SIMULATED TRADING PROGRAMS IN GENERAL ARE ALSO SUBJECT TO THE FACT THAT THEY ARE DESIGNED WITH THE BENEFIT OF HINDSIGHT. NO REPRESENTATION IS BEING MADE THAT ANY ACCOUNT WILL OR IS LIKELY TO ACHIEVE PROFIT OR LOSSES SIMILAR TO THOSE SHOWN.