When the stock market gets shaky and investors are looking for a safe place to park their money, where do they turn? You guessed it: the U.S. Treasury market. Why? Well, it’s all about trust. U.S. Treasury securities come with the U.S. government’s stamp of approval, backed by its “full faith and credit.” That’s Wall Street speak for “this is as solid as it gets.” It’s like having a gold-plated guarantee that your investment is safe and sound.
Now, here’s another thing that makes U.S. Treasuries the darling of the financial world: liquidity. Even when the economic waters get choppy, there’s always a bustling market for U.S. Treasuries. Investors can jump in or out without causing big price ripples. That kind of ease and flexibility? You won’t find it anywhere, especially when the markets are on a rollercoaster ride.
But let’s get to the heart of the matter. In times of global jitters, be it economic hiccups or geopolitical drama, there’s a mad dash for safety. Traditionally, money starts flowing out of those high-risk stocks and right into the welcoming arms of the U.S. Treasury market. It’s got that rock-solid reputation, and when the future’s looking a bit foggy, those steady returns from U.S. Treasuries are like a warm blanket on a cold night. So, for those braving the financial storms, U.S. Treasuries are the port in the storm.
However, one thing that nobody likes to discuss is that going back 15 years when Ben Bernanke was Fed Chairman, and the Fed implemented ZIRP (Zero Interest Rate Policy), returns on Treasury bonds have been less than stellar, particularly when adjusted for inflation. ZIRP, or the Zero Interest Rate Policy, was a bold and unprecedented move by the Federal Reserve in response to the financial crisis of 2008. The primary objective behind implementing ZIRP was to stimulate economic activity during a period of severe recession. By reducing the federal funds rate to near zero, the Fed aimed to make borrowing cheaper for consumers and businesses. The hope was that this would spur spending, encourage businesses to invest and expand, and ultimately lead to job creation. In essence, ZIRP was a tool to combat deflationary pressures and to prevent the economy from spiraling into a prolonged period of stagnation or depression.
The expectations of ZIRP were multifaceted. On one hand, it was anticipated to ease the burden on debt-laden consumers and corporations, allowing them to refinance existing debts at lower rates. This, in turn, was expected to boost consumer spending and business investments. Additionally, by making traditional savings less attractive (due to the negligible returns on savings accounts and fixed-income assets), the policy aimed to push investors towards riskier assets like stocks, thereby supporting asset prices and creating a ‘wealth effect’. The Fed believed that if people saw their stock portfolios or home values rise, they’d feel wealthier and spend more, further stimulating the economy.
However, like any economic policy, ZIRP wasn’t without its consequences. Manipulating the most crucial price in capitalism, the cost of money, has profound implications. For starters, it leads to misallocation of capital, as businesses take advantage of cheap money to invest in projects that might not be viable under normal interest rate conditions. Savers, particularly retirees relying on fixed-income investments, found their returns diminished, pushing them to seek riskier investment avenues. Furthermore, prolonged periods of low interest rates can inflate asset bubbles, as was seen in certain real estate and stock market segments. Finally, while ZIRP was intended as a temporary measure, the economy became addicted to cheap money, making normalization a challenging task for the Fed and raising concerns about how markets would react to rising interest rates in the future.
Last week Bank of America published the following research in the Treasury Bond Analysis:
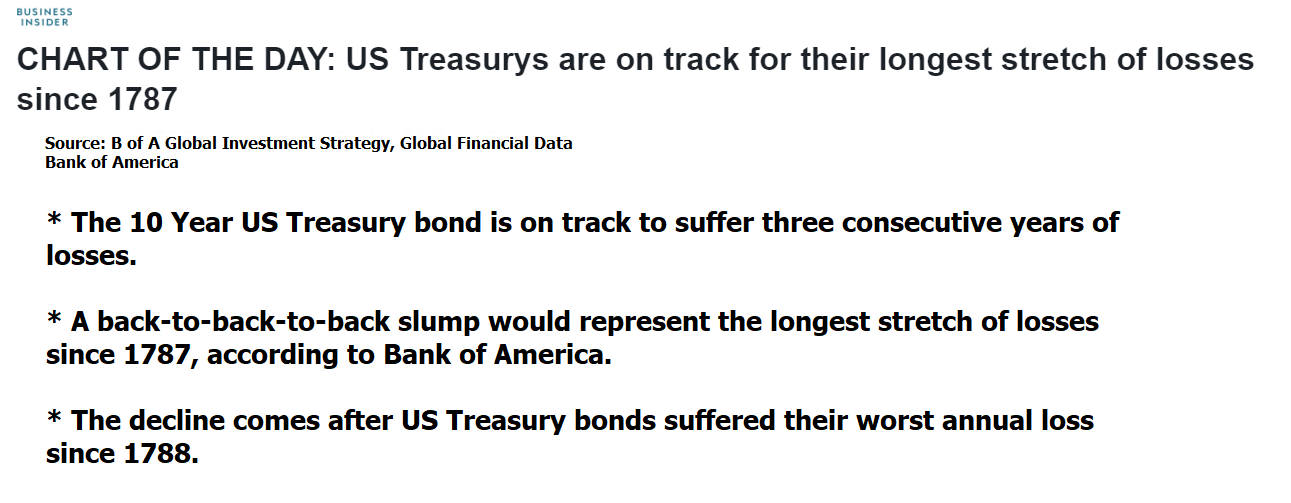
One very important parameter of trading and investing is to specifically locate anomalies and to try and comprehend their short-term and long-term implications. Currently, the U.S. Treasury market is one such anomaly.
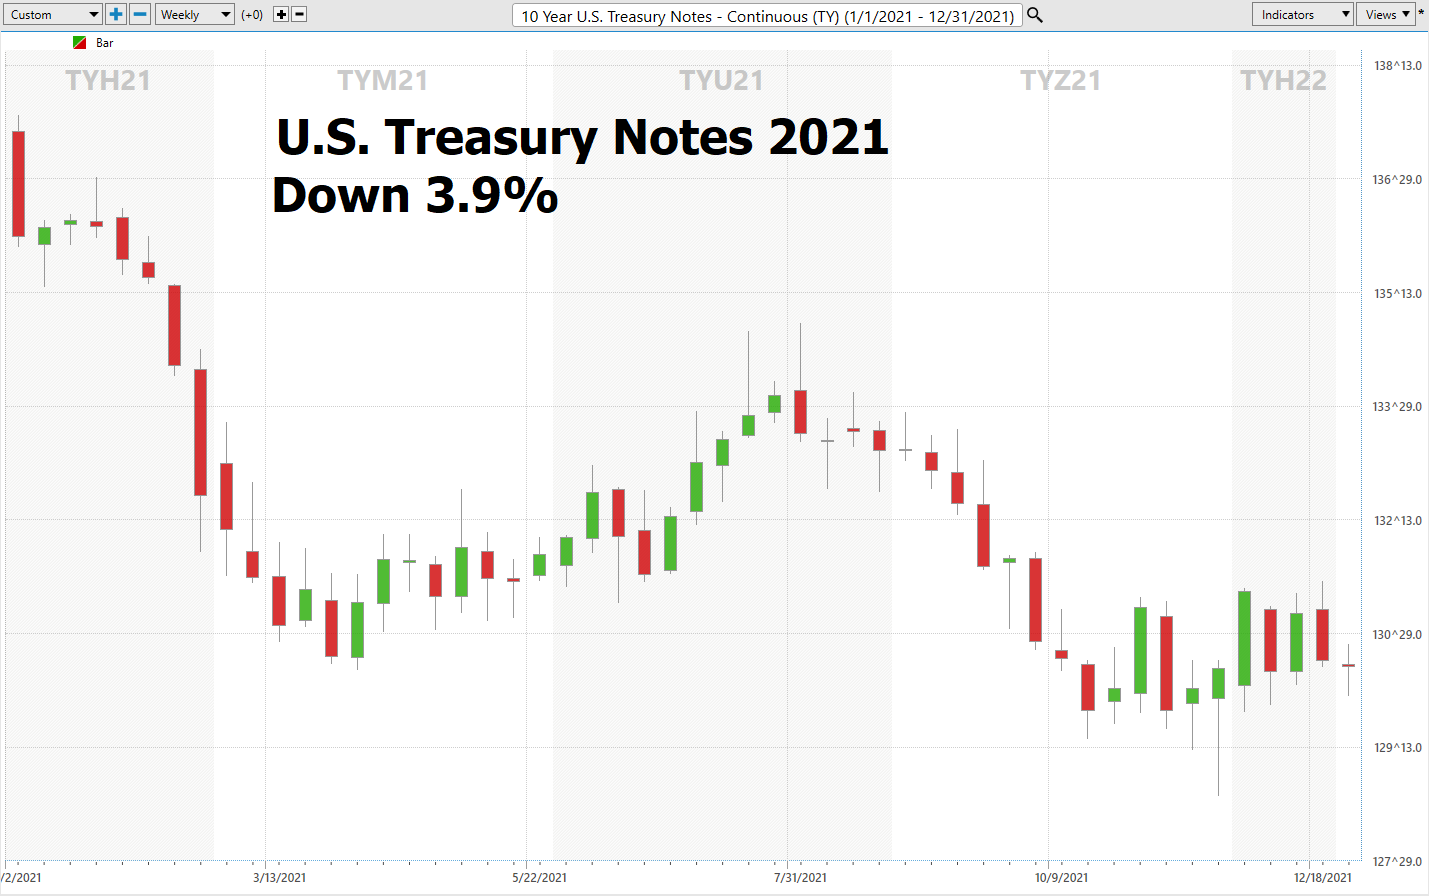
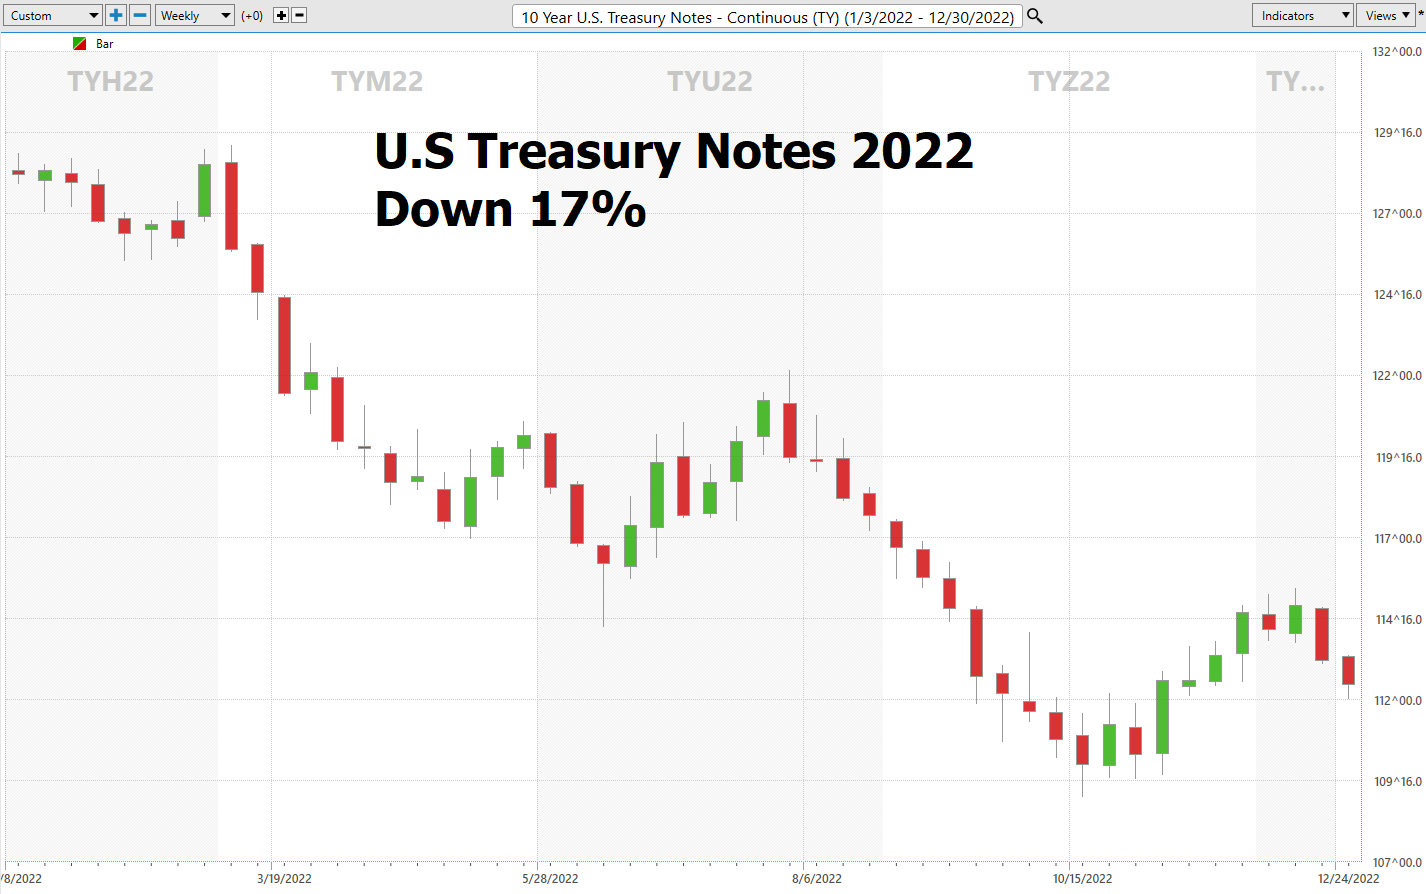
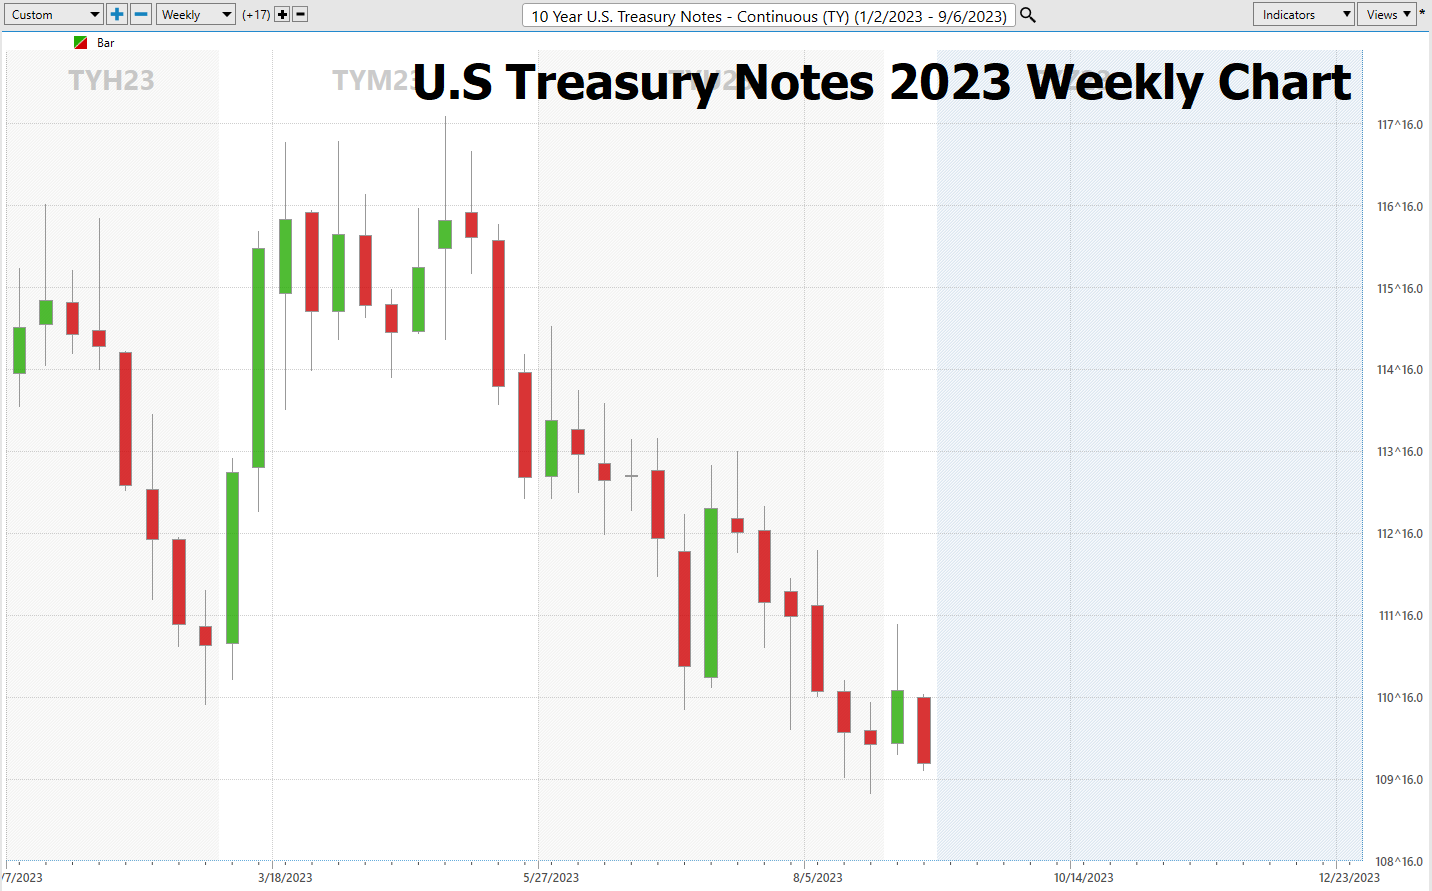
The US 10-year Treasury seems to be hitting a bit of a rough patch, and it’s not just a one-time thing. We’re talking about potentially marking its third straight year in the red. Just to give you a sense of the slide, it dipped 3.9% in 2021 and took a steep dive of 17% in 2022. That’s the steepest drop since, get this, 1788. And if you’re keeping score at home, it’s already trailing by 0.3% this year. Quite the financial roller coaster, wouldn’t you say? When you adjust these returns for annualized inflation the ROI gets much bleaker. Particularly since historically, the U.S Treasury market is the gold standard of safe havens.
Here are the corresponding charts in the T-Note market for 2021, 2022, and 2023.
Why is this important? When the gold standard of safe havens generates 21% compounded losses, before inflation, over a 3-year time period, I think it is fair to say, that because of the unwinding of ZIRP, safe havens do not exist any longer. This reality has massive implications for volatility in the financial markets. Moving forward every trader has to answer the question, Where does scared money run towards?
In the ever-evolving landscape of financial markets, the recent performance of U.S. Treasury bonds raises a pressing question about the very nature of “safe havens.” When we witness U.S. Treasury bonds, traditionally the bedrock of stability, chalking up compounded losses of 21% over a mere three-year span before even accounting for inflation, it’s time to reconsider our definitions. The very term “safe haven” implies a refuge from stormy financial weather, but with such significant losses, can we still regard Treasuries as the shelter they once were?
Smart traders and investors are very aware that these same U.S Treasuries are responsible for the Banking Crisis that occurred in March 2023 and have resulted in media outlets like the Wall Street Journal stating that over 182 banks are in worse condition that Silicon Valley Bank, Silvergate Bank and Signature Bank.
This shift prompts a broader reflection on investor behavior during market downturns. Historically, when the going got tough, investors would instinctively flock to the perceived safety of U.S. Treasuries. But given their recent track record, will this still be the case in future downturns? Or will the winds of change push investors towards alternative ports in the storm, like gold, silver, or even the relatively new player, Bitcoin?
The changing dynamics suggest that the traditional financial playbook might be undergoing a rewrite. As U.S. Treasuries waver in their role as the go-to safe haven, assets like gold, silver, and Bitcoin, which have often been viewed as hedges against uncertainty, might see a surge in interest. Only time will tell if these alternatives become the new refuges in turbulent times, but one thing is clear: the financial landscape is shifting, and investors may need to adapt their strategies accordingly. This is particularly true since the credit rating agencies recently downgraded U.S. government debt.
Two years ago as I was evaluating the financial landscape, I wrote the article, Inflation, The Fed, and Corporate Insiders – Are We Witnessing a Major Stock Market Top. In that article I stated that Corporate Insiders had sold a record $69 billion of stock in 2021, and that simply based upon that fact the probabilities favored that we would not see much upside.
Here is a chart of the S&P 500 over the past two years.
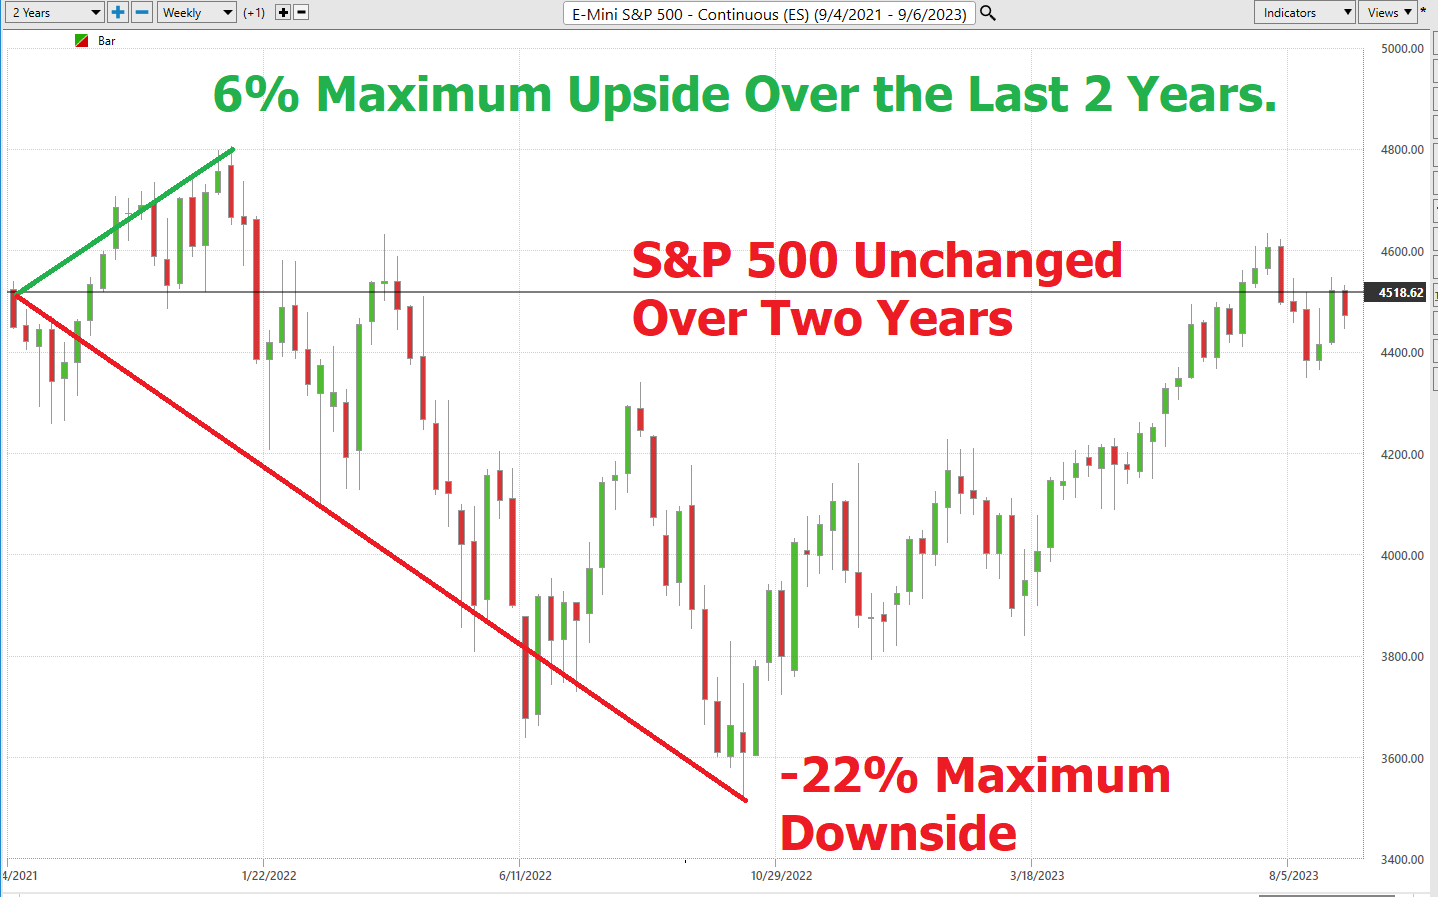
I find this chart fascinating for many reasons.
- Over the last two years the S&P 500 has been unchanged.
- Investors had a maximum 6% upside potential if they bought and held. They also had a maximum downside drawdown of 22%.
- Along the way there were numerous trading opportunities for the savvy trader to embrace.
As I write this article, I can’t help but place my attention on the long term 10 Year U.S. T-Note chart. Regardless of how I try to look at it, it seems the BEARS are in control.
- Lower Treasury prices spell higher interest rates.
- Higher Interest rates TRADITIONALLY do not bode well for stock prices.
- U.S. T-Notes are trading at the 2 nd percentile of their 10-year trading range.
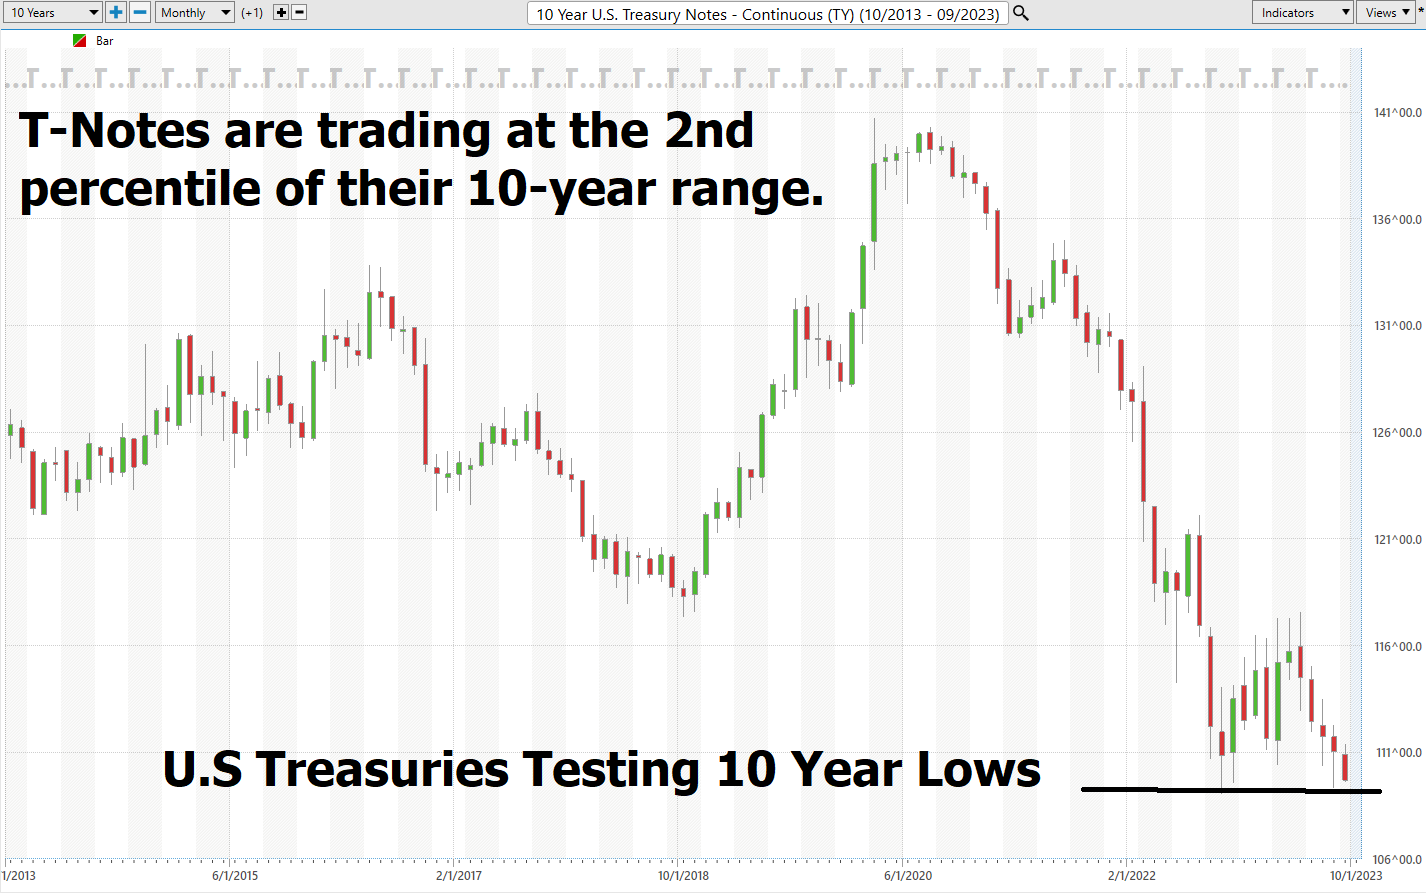
I am convinced this chart is what is causing massive anxiety in the markets for traders.
Two years ago, the yield on the 10 Year T-Note was 1.5%. Today the yield on the 10 Year T-Note is 4.27%. This represents a 184% increase in the cost of capital. Meanwhile, the S&P is trading at the same level as it was 2 years ago – 4471. Combine this reality with what has been previously mentioned in this article, that U.S Treasuries are facing their third consecutive year of compounding losses and a real conundrum has been created for traders and investors.
Essentially, the question is how safe are U.S Treasuries based upon their dismal performance of the last 3 years?
Is the new safe haven a 30-day T-bill as everyone tries to ride out the fear by piling into the shortest end of the yield curve?
High interest rates are traditionally a bane for the stock market, and there are compelling reasons for this. Firstly, when interest rates rise, borrowing costs for companies increase, directly impacting their profitability. Companies often rely on borrowed funds for expansion, research and development, and other capital-intensive projects. Higher interest rates mean that the cost of financing these ventures goes up, leading to reduced profit margins. As profits shrink, this can result in lower earnings reports, which often lead to sell-offs in the stock market as investors re-evaluate the future earning potential of these companies.
Moreover, from an investor’s perspective, higher interest rates offer alternative investment opportunities that might be perceived as less risky. When interest rates on bonds and savings accounts increase, they can become more attractive compared to the inherent volatility of the stock market. Investors might start reallocating their portfolios, moving their money from equities to bonds or other fixed-income securities that now offer better returns. This shift in investment preference can lead to reduced demand for stocks, causing stock prices to drop. In essence, high interest rates create an environment where the stock market becomes less appealing both for companies seeking capital and for investors looking for the best returns on their investments.
U.S. mortgage rates have surged, with the 30-year fixed-rate average reaching 7.31%, the highest in nearly a quarter-century. This uptick has led to a significant drop in housing demand, with mortgage applications for new purchases plummeting to a 28-year low. Year-over-year, mortgage applications have declined by 30%, and refinancing applications have seen a 35% drop. The confluence of record-high real estate prices and rising mortgage rates paints a concerning picture for this vital economic sector.
Despite the lessons from the 2008 housing market crash, Zillow, a leading real estate marketplace, has introduced a program targeting potential homeowners who might traditionally be considered high-risk borrowers. Zillow Home Loans is now offering mortgages with a mere 1% down payment. Orphe Divounguy, Zillow Home Loans’ senior macroeconomist, commented on the initiative, stating it aims to “lower the barrier to entry” for those who can manage higher rent but struggle with the initial costs of homeownership. The program’s eligibility criteria include a credit score as low as 620, typically considered subprime.
The broader implications of such policies are concerning and demonstrate that since nobody was held accountable for the 2008 financial crisis, solutions mimicking that fiasco are being bandied about again as a means of increasing home ownership. Downright terrifying.
The broader economy reflects this unease. August saw a drop in consumer confidence, with the index falling to 106.1 from 117.0 in July. Inflationary pressures and job security concerns are taking a toll.
With student loan repayments set to resume soon and pandemic stimulus savings expected to deplete by year-end, consumers are increasingly relying on debt to counteract inflation.
In a candid moment during his recent Jackson Hole speech, Fed Chair Jerome Powell likened the Fed’s approach to navigating interest rates to “viewing the stars” obscured by clouds. While this admission was refreshingly honest, it underscores the challenges the Fed faces in steering the economy. The U.S. economy, burdened by twice as much debt as 2008, compounded with higher interest rates is facing real organic challenges.
In conclusion, even with clear skies, the current trajectory suggests the U.S. economy might be heading for rough waters. My suggestion is twofold.
1) Watch the U.S. Treasury Note Chart. Lower Lows would be a very negative sign for stock prices and an indication that interest rates need to be bid up further for investors to want to assume the risk of holding what has clearly been a toxic asset.
2) Learn to Trade with Artificial Intelligence.
Listen, if you want to make a real dent in the markets, you’ve got to dig deep. You’ve got to be in the right place, at the right time, with the right strategy. And let me tell you, the best traders out there? They’re not just thinking about making money; they’re downright paranoid about losing it. They’ve got a system, a discipline, that helps them spot the golden opportunities, especially with the crazy market twists we see today.
Now, here’s where it gets interesting: the future of trading is in tech. I’m talking about neural networks, machine learning, and A.I. Imagine a world where what’s “supposed” to happen and what “actually” happens come together. That’s where the magic happens, and that’s where you want to be. A.I. isn’t just some fancy tool; it’s your ticket to the big leagues. Think about it: how many of your decisions in the past year would you call ‘stellar’? Now, compare that to what an A.I. could’ve done. We humans, we’re stubborn. We mess up, let our egos get bruised, and sometimes, we don’t learn. But machines? They thrive on mistakes, turning them into steppingstones to perfection. If AI can outplay us in Poker and Chess, what makes you think trading’s any different?
It’s all about knowledge. The right kind of knowledge. And putting it to work. That’s what AI brings to the table. It’s not just a ‘nice-to-have’; it’s your secret weapon in today’s wild market rodeo. So, are you in?
Dive in with me and discover how A.I. and all its techy cousins can help you spot your next big win.
We discuss and explore topics like this in our Live Artificial Intelligence Training.
We also forecast for specific markets using a.i., machine learning and neural networks.
Intrigued? I invite you to learn more about how artificial intelligence, machine learning, neural networks and intermarket analysis can help you find your next great trade .
Please visit with us at our – Next Free Live Training.
It’s not magic. It’s machine learning.
Make it count.
THERE IS A SUBSTANTIAL RISK OF LOSS ASSOCIATED WITH TRADING. ONLY RISK CAPITAL SHOULD BE USED TO TRADE. TRADING STOCKS, FUTURES, OPTIONS, FOREX, AND ETFs IS NOT SUITABLE FOR EVERYONE.IMPORTANT NOTICE!
DISCLAIMER: STOCKS, FUTURES, OPTIONS, ETFs AND CURRENCY TRADING ALL HAVE LARGE POTENTIAL REWARDS, BUT THEY ALSO HAVE LARGE POTENTIAL RISK. YOU MUST BE AWARE OF THE RISKS AND BE WILLING TO ACCEPT THEM IN ORDER TO INVEST IN THESE MARKETS. DON’T TRADE WITH MONEY YOU CAN’T AFFORD TO LOSE. THIS ARTICLE AND WEBSITE IS NEITHER A SOLICITATION NOR AN OFFER TO BUY/SELL FUTURES, OPTIONS, STOCKS, OR CURRENCIES. NO REPRESENTATION IS BEING MADE THAT ANY ACCOUNT WILL OR IS LIKELY TO ACHIEVE PROFITS OR LOSSES SIMILAR TO THOSE DISCUSSED ON THIS ARTICLE OR WEBSITE. THE PAST PERFORMANCE OF ANY TRADING SYSTEM OR METHODOLOGY IS NOT NECESSARILY INDICATIVE OF FUTURE RESULTS. CFTC RULE 4.41 – HYPOTHETICAL OR SIMULATED PERFORMANCE RESULTS HAVE CERTAIN LIMITATIONS. UNLIKE AN ACTUAL PERFORMANCE RECORD, SIMULATED RESULTS DO NOT REPRESENT ACTUAL TRADING. ALSO, SINCE THE TRADES HAVE NOT BEEN EXECUTED, THE RESULTS MAY HAVE UNDER-OR-OVER COMPENSATED FOR THE IMPACT, IF ANY, OF CERTAIN MARKET FACTORS, SUCH AS LACK OF LIQUIDITY. SIMULATED TRADING PROGRAMS IN GENERAL ARE ALSO SUBJECT TO THE FACT THAT THEY ARE DESIGNED WITH THE BENEFIT OF HINDSIGHT. NO REPRESENTATION IS BEING MADE THAT ANY ACCOUNT WILL OR IS LIKELY TO ACHIEVE PROFIT OR LOSSES SIMILAR TO THOSE SHOWN.