
If you spend any time in the trading universe, you’ll quickly be exposed to thousands of opinions, theories and perspectives which vie for your attention and resources. Theories are a dime a dozen. The challenge for traders is quite simple, to focus on markets where the strongest and weakest trends exist and exploit those trends as much as possible. In other words, traders want to know how to stay on the right side, of the right trend at the right time.
A simple way of thinking about this is through the eyes of Sherlock Holmes. Sherlock Holmes is a fictional detective created by British author Sir Arthur Conan Doyle, renowned for his brilliant deductive reasoning and keen observational skills. The character epitomizes the archetype of the detective genius, solving complex mysteries with logic and astute attention to detail, and basic common-sense insights.
In the vast and intricate world of trading, a single question often looms large in the minds of traders: “Who is Winning?” Amidst the cacophony of market news, expert opinions, and the latest trading strategies, this simple question can guide traders toward the most fundamental principle of trading: solid performance is what drives market behavior.
If Sherlock Holmes were a trader, his analytical and deductive skills would lead him to ask the following questions to uncover the best trading opportunities:
1. What are the underlying fundamentals of this asset, and how do they compare to its current market valuation?
2. Are there any recent or upcoming events that could significantly impact this asset’s price?
3. What patterns or anomalies can be observed in the asset’s historical price movements?
4. How does the asset perform in various market conditions, and what external factors influence its price?
5. What is the general market sentiment towards this asset, and are there any discrepancies between sentiment and actual data?
6. Are there any geopolitical or macroeconomic factors that could affect this asset in the near future?
7. How does this asset correlate with other assets in my portfolio, and will it provide diversification benefits?
8. What are the potential risks associated with this asset, and how can they be mitigated?
9. Are there any insider trading activities or significant changes in institutional ownership that might provide clues about the asset’s future performance?
10. Based on all available data, what is the most probable outcome for this asset in the short and long term?
Holmes would use these questions as a starting point, delving deeper into each aspect to ensure he made the most informed trading decisions. All the questions listed can be summarized first and foremost by the assets’ recent performance against industry benchmarks. The way Sherlock Holmes would operate to separate fact from opinion starts with the supreme question of Who and What is WINNING?
Traders today are spoiled for choice. From stocks, ETFs, bonds, commodities, to forex, the options are almost infinite. Each asset class comes with its own set of challenges, opportunities, and potential rewards. But with such a plethora of choices, how does one decide where to invest and trade?
At the heart of every trading decision is the pursuit of solid, consistent performance. While market trends, geopolitical events, and economic indicators play a role, it’s the performance of an asset that ultimately determines its attractiveness. After all, an asset’s track record often speaks louder than predictions or speculations.
To understand “what is winning,” traders need to shift their focus from the noise and concentrate on the numbers. Which assets have consistently outperformed others? Which industries are showing steady growth? Which currencies are stable or appreciating? How does an assets recent performance compare to industry benchmarks and media news? By answering these questions, traders can develop a more reliable investment thesis.
Sherlock Holmes would meticulously observe every detail of the situation, no matter how seemingly insignificant, believing that the smallest clue could be the key to unraveling the mystery. He would then employ his unparalleled deductive reasoning to piece together these observations, drawing logical connections that others might overlook. Through this rigorous analytical process, Holmes would sift through conjecture and ambiguity to arrive at the unvarnished truth.
In trading, the only facts we have are the price of an asset and its recent performance. You cannot create a meaningful analysis if you ignore these simple details.
Just as it’s crucial to identify winners, it’s equally important to recognize and stay away from consistent underperformers and understand how points are scored and measured in the game of trading.
Sherlock Holmes would implore us to understand that the most important metric in the financial landscape is the current interest rate. This must always be compared to the inflation rate. When we subtract the inflation rate from the return on the interest rate, we receive what is referred to as the real rate of return.
Currently, the yield on the 10-year T-Note is 4.25%.
Yesterday the CPI printed at 3.7%. That means the real rate of return is .85% for investors willing to loan the government their money for 10 years. Not exactly awe-inspiring. Especially if you dislike the idea of a resurgence of inflation.
The S&P 500 Index has returned a historic annualized average return of around 11.88% since its inception in 1957 through the end of 2021 , as per Investopedia.
But here is a question which I’m convinced Sherlock Holmes would be asking about today’s financial landscape.
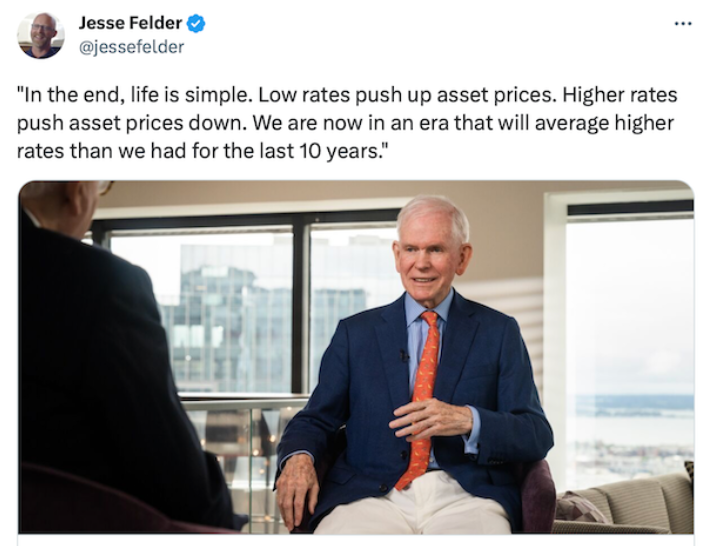
Over the last 10 years, we have had the lowest interest rate environment in the history of our country. The Compounded Annual Growth Rate (CAGR) of the S&P 500 over the last 10 years has been 10.9%. Will higher average interest rates increase or decrease the CAGR of the S&P 500 Index?
Let’s apply this same logic to the broader stock market indexes. When Sherlock Holmes would look at the stock market, he would certainly understand that the market cap of the S&P 500 Index is dominated by the “Magnificent Seven.” ($MSFT, $META, $AAPL, $TSLA, $AMZN, $NVDA and =$GOOGL).
The S&P 500 Index ($SPX) is a market-capitalization-weighted index comprising 500 of the largest publicly traded U.S. companies, meaning companies with higher market values have a greater influence on the index’s performance. On the other hand, the $SPXEW, or the S&P 500 Equal Weight Index, gives each of the 500 companies in the index an equal weight, ensuring that each company has the same impact on the index’s value. As a result, the performance of smaller companies has a more pronounced effect on the SPXEW compared to the $SPX.
So, let’s look at the last 52 weeks of both these indexes to see what the real rate of return would be for stocks.
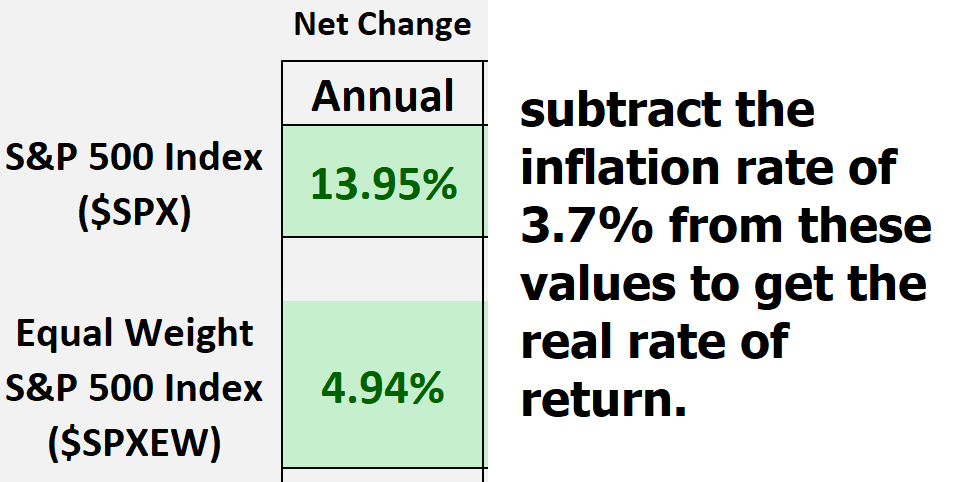
If we subtract inflation from the $SPX we come out with an ROI of 10.25% and we must recognize that this value is greatly amplified by the returns generated by the Magnificent Seven. A return of 10.25% is on par with the Compounded Annual Growth Rate of the S&P 500 over the past 10 years. With this being the case should extreme caution not be in order?
However, if we subtract the inflation rate of 3.7% from the $SPXEW we come out with an annualized gain of 1.24%. In other words, you generate a paltry gain of 1.24% after inflation and having assumed all of the risk associated with investing in stocks. In other words, what is making the $SPX shine is the reality that since the S&P 500 Index is weighted by market cap the Magnificent Seven are responsible for the stellar returns on the INDEX.
This analysis is foundational in providing a bird’s eye view of how the financial landscape defines a Risk-free rate of return and the opportunity that was available for investing in financial assets.
In the world of trading, distinguishing between facts and opinions is paramount. A fact is an objective reality, something that can be proven with evidence and remains consistent regardless of beliefs or feelings. In trading, the undeniable fact is the price of an asset. It’s the number you see on your screen, the value at which a transaction occurs, and the historical data that charts rely upon. Everything else, from market predictions to expert analyses, falls into the realm of opinions. These are subjective beliefs or views that can vary from one individual to another, often influenced by emotions, biases, or external factors.
Opinions can be treacherous terrain for traders. The danger lies in treating opinions as facts. When traders act on beliefs without concrete evidence, they risk making decisions based on what they think or feel rather than what truly is. For instance, a trader might believe that a particular stock will rise because of a recent news article or a tip from a colleague. However, if this belief isn’t grounded in factual data or thorough analysis, it’s merely an opinion. Acting on such opinions without verification will lead to costly mistakes.
For traders, the key to success is to recognize the difference between what is factual and what is opinion-based. While it’s essential to consider various viewpoints and analyses, it’s equally crucial to ground decisions in the undeniable facts of price movements. By focusing on the concrete data of what price does and has done and filtering out the noise of myriad opinions, traders can navigate the markets with clarity, precision, and confidence.
This analysis will surprise even the most astute traders. It reveals the composite conclusions of all of the price action for these assets over the past 52 weeks. In other words, it is a simple Sherlock Holmes report card. Studying these metrics will change your opinions of how you think the financial markets operate.
Since Sherlock Holmes is an international detective let’s set him loose on the International Stock Exchanges.
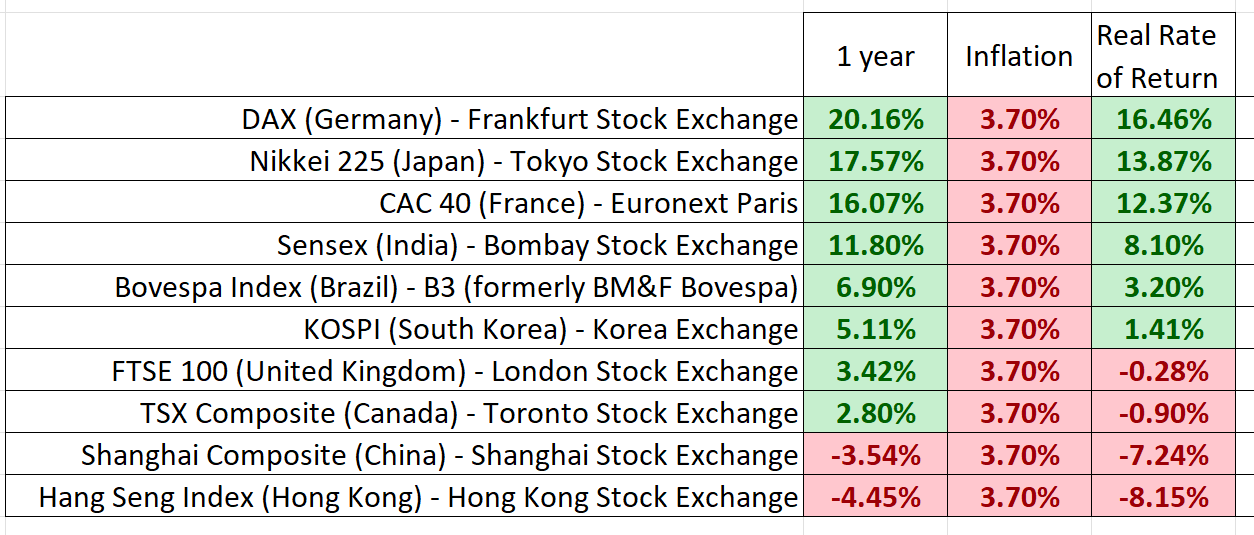
I know next to nothing about the Frankfurt and Tokyo Stock Exchanges but simply based upon their performances I am now curious and willing to explore as to why they have done so well over the past year.
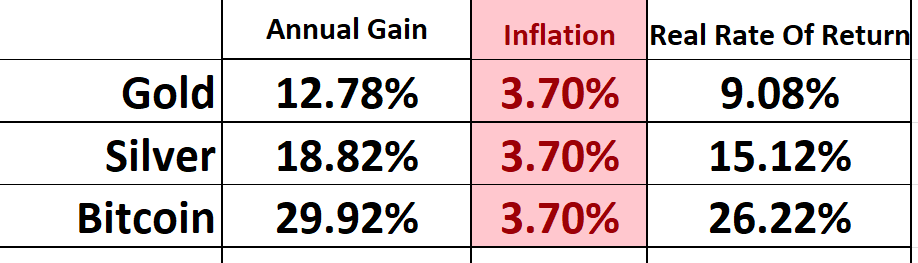
Let’s continue. Here are the annualized returns of Gold Silver and Bitcoin.
Determined to get to the bottom of the mystery let’s compare the major stock indexes, the Magnificent Seven, Gold, Silver, Bitcoin and T-Notes to see how they all stack up against one another over the past year. While it’s true this type of analysis is traditionally done at End of year, or the end of the quarter, it provides meaningful insights if it is done consistently throughout the year to get a sobering perspective what TRULY “IS” happening in the financial markets NOW.
52 Week Look Back Analysis
“There is nothing more deceptive than an obvious fact.”
-Sherlock Holmes
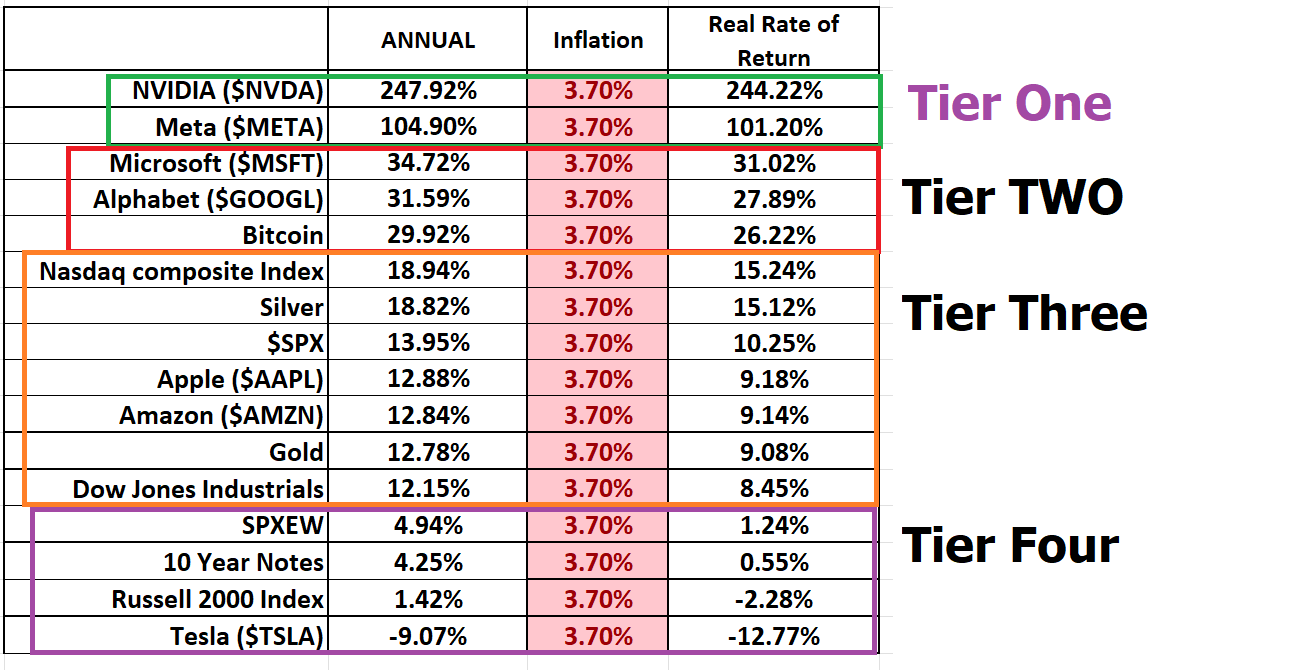
What do you see in this performance report card?
Naturally, NVIDIA and META are the outliers leading the pack. Is anyone surprised by how BITCOIN is holding pace with $MSFT and $GOOGL on the second tier? What absolutely floored me is that Silver is keeping pace with the Nasdaq and outperforming the S&P 500 Index!
Gold is keeping pace with Amazon and outperforming the Dow Jones Industrials. Trust me, you will not be reading articles in the financial media that report this level of objectivity.
The Tier Four group is for all intents having trouble keeping pace with inflation.
In the end, by asking the question, “Who is winning?” traders can align their strategies with the best trends. This not only minimizes risks but also positions traders to capitalize on solid, consistent market price action and performers.
Let’s take a moment to look at the broader landscape: The S&P 500 is soaring this year, my friends. But let’s be clear, it’s not because the street believes these corporations are about to post record-breaking profits anytime soon.
You see, the most optimistic wizards of Wall Street project that the earnings per share for companies in the S&P 500 will inch up by a mere 1% in 2023 compared to the previous year. Yet, the S&P 500? It’s skyrocketed by as much as 17%. So, in layman’s terms, stock prices are running laps around the rather modest profit growth forecasts.
A thought from yours truly: You’ll often hear that stock prices mirror future corporate earnings. Well, that’s part of the story. The market, as we know, is a fickle beast. There are times when investors seem to toss those “financial fundamentals” out the window. It’s during these phases that the market’s speculative heart races, and optimism takes the wheel. Remember the late 1990s? Or even 2021? Detailed debates about profits and losses seemed almost irrelevant.
Reading between the lines: These euphoric periods often align with “easy” monetary policies and rock-bottom interest rates. Here’s a simple question for you to evaluate : When was the last time you saw higher interest rates, flat to lower earnings and the stock market up 17%? I don’t know of any!
Now, don’t get me wrong, the Federal Reserve isn’t hinting at slashing rates. But with inflation taking a backseat, there’s a collective exhale on Wall Street, grateful that the rate hikes of yesteryear are behind us. I think BULLS should be very careful at these levels.
But it is within this sentiment that you now can put assets under the a.i. microscope to figure out the best move forward. One of the biggest challenges in trading and investing is not being aware of the monster trends that are unfolding. Remember, in the world of trading, it’s about understanding performance, recognizing winners, and making informed decisions. So, the next time you’re faced with a trading dilemma, simply ask yourself: “Who is winning?” and let solid performance guide your way.
So, listen up, traders! Imagine if Sherlock Holmes, with his razor-sharp deductive reasoning and unmatched logic, stepped into today’s financial arena. He’d first dissect the raw, undeniable facts, cutting through the market’s deafening noise. But Holmes, always ahead of the curve, wouldn’t stop there. Knowing the sheer complexity of modern trading, he’d harness the unparalleled power of artificial intelligence, machine learning, and neural networks. Why? To zero in on the one thing that matters most: the TREND.

You see, in this whirlwind of economic environment, where every tick on the chart can mean a fortune won or lost, it’s all about being on the right side of the right trend, at the right time. Most traders get this wrong, and it’s not entirely their fault. The game has changed. But here’s the secret sauce: the best tools. And who better than Holmes, combined with the might of A.I., to ensure you’re always putting the probabilities in your favor? Remember, if the money supply swells by 10%, you’ve got to grow your portfolio by 10% just to break even. Otherwise, you are the victim of currency debasement.
And in this race, price is king. It’s the beacon that either fills your coffers or leaves them empty.
Now, ask yourself: Are you equipped to spot those golden opportunities amidst the sea of trading chaos? Knowledge, my friend, is power. But the right kind of knowledge, backed by AI, is unstoppable. Dive deeper, join us for an exclusive, FREE live training session . We’ll unveil three stocks, pinpointed by AI, ready to make waves. Because in trading, movement is opportunity. Don’t be left behind. Discover the power of AI in trading and ensure your portfolio thrives. Stay sharp, stay focused, and always, always, always follow the trend.
Visit with us and check out the A.I. at our Next FREE Live Training .
It’s not magic. It’s machine learning.
Make it count.
THERE IS A SUBSTANTIAL RISK OF LOSS ASSOCIATED WITH TRADING. ONLY RISK CAPITAL SHOULD BE USED TO TRADE. TRADING STOCKS, FUTURES, OPTIONS, FOREX, AND ETFs IS NOT SUITABLE FOR EVERYONE.IMPORTANT NOTICE!
DISCLAIMER: STOCKS, FUTURES, OPTIONS, ETFs AND CURRENCY TRADING ALL HAVE LARGE POTENTIAL REWARDS, BUT THEY ALSO HAVE LARGE POTENTIAL RISK. YOU MUST BE AWARE OF THE RISKS AND BE WILLING TO ACCEPT THEM IN ORDER TO INVEST IN THESE MARKETS. DON’T TRADE WITH MONEY YOU CAN’T AFFORD TO LOSE. THIS ARTICLE AND WEBSITE IS NEITHER A SOLICITATION NOR AN OFFER TO BUY/SELL FUTURES, OPTIONS, STOCKS, OR CURRENCIES. NO REPRESENTATION IS BEING MADE THAT ANY ACCOUNT WILL OR IS LIKELY TO ACHIEVE PROFITS OR LOSSES SIMILAR TO THOSE DISCUSSED ON THIS ARTICLE OR WEBSITE. THE PAST PERFORMANCE OF ANY TRADING SYSTEM OR METHODOLOGY IS NOT NECESSARILY INDICATIVE OF FUTURE RESULTS. CFTC RULE 4.41 – HYPOTHETICAL OR SIMULATED PERFORMANCE RESULTS HAVE CERTAIN LIMITATIONS. UNLIKE AN ACTUAL PERFORMANCE RECORD, SIMULATED RESULTS DO NOT REPRESENT ACTUAL TRADING. ALSO, SINCE THE TRADES HAVE NOT BEEN EXECUTED, THE RESULTS MAY HAVE UNDER-OR-OVER COMPENSATED FOR THE IMPACT, IF ANY, OF CERTAIN MARKET FACTORS, SUCH AS LACK OF LIQUIDITY. SIMULATED TRADING PROGRAMS IN GENERAL ARE ALSO SUBJECT TO THE FACT THAT THEY ARE DESIGNED WITH THE BENEFIT OF HINDSIGHT. NO REPRESENTATION IS BEING MADE THAT ANY ACCOUNT WILL OR IS LIKELY TO ACHIEVE PROFIT OR LOSSES SIMILAR TO THOSE SHOWN.