A Wall Street analyst is like the captain of a ship in the world of finance. They’re the ones who dig deep, sift through mountains of data, and use their financial and quantitative skills to make forecasts about the future of stocks, bonds, and other financial instruments. It’s like they’re the fortune tellers of the stock market where they are tasked with determining a stock’s fair market value based upon everything that is going on in the world.
Now, how do they do it? Well, these analysts have an arsenal of methods up their sleeves to arrive at what they consider to be fair value. First up, they’ll dive into the company’s financial statements, looking at things like earnings, revenue, and cash flow. They’ll also check out the competition, industry trends, and economic conditions to see what’s cooking. They assess trends in revenue growth, margins, and earnings per share (EPS). The balance sheet is scrutinized to evaluate the company’s assets, liabilities, and shareholders’ equity. Key metrics include total assets, debt levels, and book value.
Next, they love to do a deep dive into ratios. Various financial ratios are calculated and analyzed, including:
– **Price-to-Earnings (P/E) Ratio:** Indicates how the market values the company’s earnings.
– **Price-to-Sales (P/S) Ratio:** Measures the company’s stock price relative to its revenue.
– **Price-to-Book (P/B) Ratio:** Compares the stock price to its book value per share.
– **Debt-to-Equity Ratio:** Evaluates the company’s debt burden.
– **Return on Equity (ROE):** Measures how efficiently the company uses shareholder equity to generate profits.
– **Dividend Yield:** Examines the dividend payout relative to the stock price.
It’s all about finding that sweet spot where a stock looks undervalued or overvalued. Analysts examine the company’s position within its industry, comparing it to competitors. They consider market share, competitive advantages, and barriers to entry.
And let’s not forget about discounted cash flow analysis, where they estimate a company’s future cash flows and then discount them back to the present to find the stock’s intrinsic value.
Amongst all of the data that Wall Street Analysts confront their task always remains the same. They try to determine a fair value estimate of a company’s price based upon everything that is occurring in the world. It’s no easy task!
Analysts serve as the financial compass guiding investors through the labyrinth of investment choices. These astute individuals meticulously scrutinize an extensive spectrum of assets, comprising individual stocks, sectors, and Exchange-Traded Funds (ETFs). Whether it’s the behemoth conglomerates or the nimble startups, Wall Street analysts delve deep into publicly traded companies, dissecting their financial health, growth prospects, and competitive edges. Beyond the microcosm of individual stocks, these financial sleuths cast their gaze over broader sectors and industries, from the pulsating heart of technology to the vital organs of healthcare and finance. In doing so, they unearth trends, dissect market conditions, and bring forth invaluable insights for both institutional and retail investors.
Yet not all assets bask in the limelight of analyst coverage. Traditionally most Wall Street analysts do not analyze penny stocks or a majority of small cap stocks.
There exists a meticulous curation process that separates the wheat from the chaff. Large market capitalizations often beckon the analyst’s scrutiny, with attention lavished on well-established, large-cap entities that pulse through the market’s veins. The siren call of high trading volumes captivates these financial detectives, for liquid assets are the lifeblood of market activity, attracting both investor interest and analyst attention. Publicly listed assets, on the grand stage of major stock exchanges, bask in the spotlight, offering transparency and accessibility that beckon the watchful eyes of Wall Street. Sectors teeming with dynamism or experiencing profound transformations, coupled with assets boasting sterling reputations and commanding investor demand, all earn their rightful place in the analyst’s spotlight. Unique features, robust financial performance, and seismic news events also serve as catalysts for analyst coverage, while the resonating chorus of client demand can tip the scales, prompting analysts to embark on new investigative journeys in response to the clarion call of investors seeking wisdom amidst the financial cacophony. In the intricate dance of Wall Street, it is the discerning eye of the analyst that often unveils the rhythm and rhyme hidden within the market’s complex tapestry.
Last but not least, they’ll talk to company management, attend conferences, and read research reports to get the inside scoop. It’s all about gathering as much information as possible to make those forecasts.
While I don’t value an individual analyst’s opinion very much, I find great value in looking at all of them together to determine what their consensus estimate is, along with their most bullish and bearish outlooks are.
Any trader or investor can simply do a quick Google search for the term:
“Wall Street Analysts Estimates ‘COMPANY NAME’ or ‘$Stock Symbol.’ ”
That simple search will return an abundance of results from top financial sites like:
Yahoo Finance , Bloomberg , MarketWatch , CNBC , Reuters , Zacks Investment Research , TipRanks , and the Wall Street Journal .
The information you can glean from this simple search will allow you to ask some very intelligent trading questions and assist in keeping you on the right side of the right trend at the right time.
Let me explain.
As I write these words Apple ($AAPL) is trading at $168.61
When I search Google for Wall Street Analysts estimates for $AAPL APPLE , this is the result I end up with:
Based on 30 Wall Street analysts offering 12-month price targets for Apple in the last 3 months . The average price target is $204.80 with a high forecast of $240.00 and a low forecast of $167.00 . The average price target represents a 21.46% change from the last price of $168.61 .
The first thing I like to do is to place the data on a spreadsheet and look at the variance on the Wall Street Analysts’ estimates. Where I find tremendous value is by studying and comparing the most bullish, bearish and consensus estimates to current prices. I’m not putting Wall Street Analysts on a pedestal. Instead, I’m simply evaluating their current 12-month outlook to what price is currently doing.
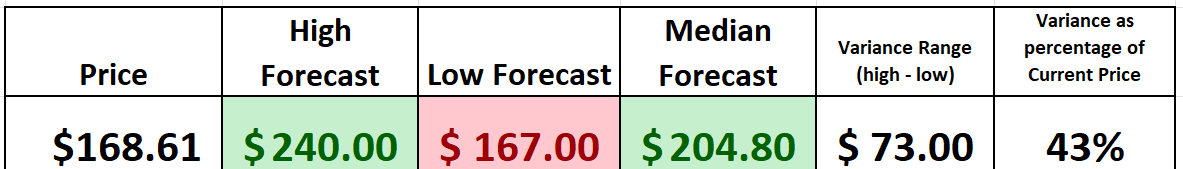
What intelligent questions would you ask based upon this grid?
The first question that I ALWAYS ask is where are we in relation to the most bullish and bearish forecasts?
You can see that the most optimistic forecast is $240. The most negative estimate is $167. The difference between these two estimates is the variance which currently represents $73, or when represented as a percentage 43%. The larger the variance the larger the volatility.
But what jumps out at me is that we are within 1% of the most negative forecast.
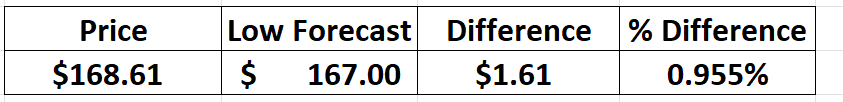
Wall Street Analysts will recalibrate their estimates on a regular basis. But based upon this current reality, the very first thing I’ll do is pay very close attention to how price is reacting to the $167 level which represents the most bearish outlook.
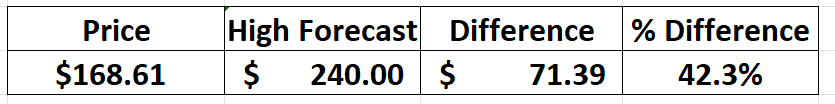
Next, we can see how far is price NOW from the most optimistic forecast?
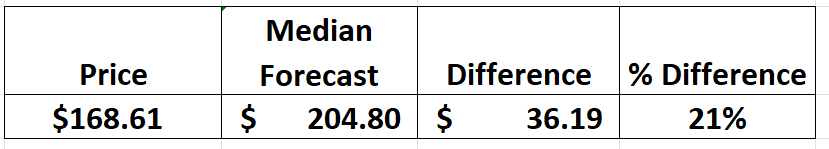
Or how far is price NOW from the Median forecast?
Armed with this basic and practical knowledge a trader armed with artificial intelligence can now incorporate this understanding into their current decision-making process by focusing on the CURRENT TREND.
Artificial Intelligence, machine learning and Neural Networks function to keep the trader on the right side, of the right trend at the right time.
Wall Street analysts indeed represent some of the brightest quantitative minds in the finance industry, armed with extensive knowledge, analytical tools, and sophisticated models. They play a pivotal role in providing fair value estimates and recommendations for stocks. Despite their impressive qualifications, it’s essential to acknowledge that analysts are not infallible, and their forecasts can be inaccurate. Nevertheless, their influence on the financial markets is undeniable.
Analysts bring a wealth of expertise and research capabilities to the table, conducting in-depth assessments of companies, industries, and economic conditions. Their recommendations and fair value estimates are based on rigorous quantitative analysis, often incorporating complex financial models and extensive data sets. While they may be wrong on occasion due to unforeseen market events or changes in circumstances, their research remains a valuable resource for investors seeking to make informed decisions. The collective wisdom of analysts can serve as a crucial benchmark against which traders and investors can evaluate their own strategies.
Investors and traders armed with A.I. and machine learning algorithms can gain even more relevance by juxtaposing their trading strategies alongside what top Wall Street Analysts are thinking. By studying the consensus of analyst opinions, traders and investors refine their strategies and make data-driven decisions. This synergy between human expertise and A.I.-driven analysis can lead to more sophisticated and informed trading approaches, enhancing the potential for profitable outcomes.
Let’s look at Apple ($AAPL) to step out of the theory and into the real world that traders face every day.
All that I have done is to look at the last 6 months of price action for $AAPL with the long term Predictive Blue Line A.I. Analysis. This VantagePoint indicator quickly highlights the trend.
I have drawn the consensus estimate of $167 by drawing a dark line on the chart near the current price level. I have also drawn the MEDIAN CONSENSUS estimate of $204.80.
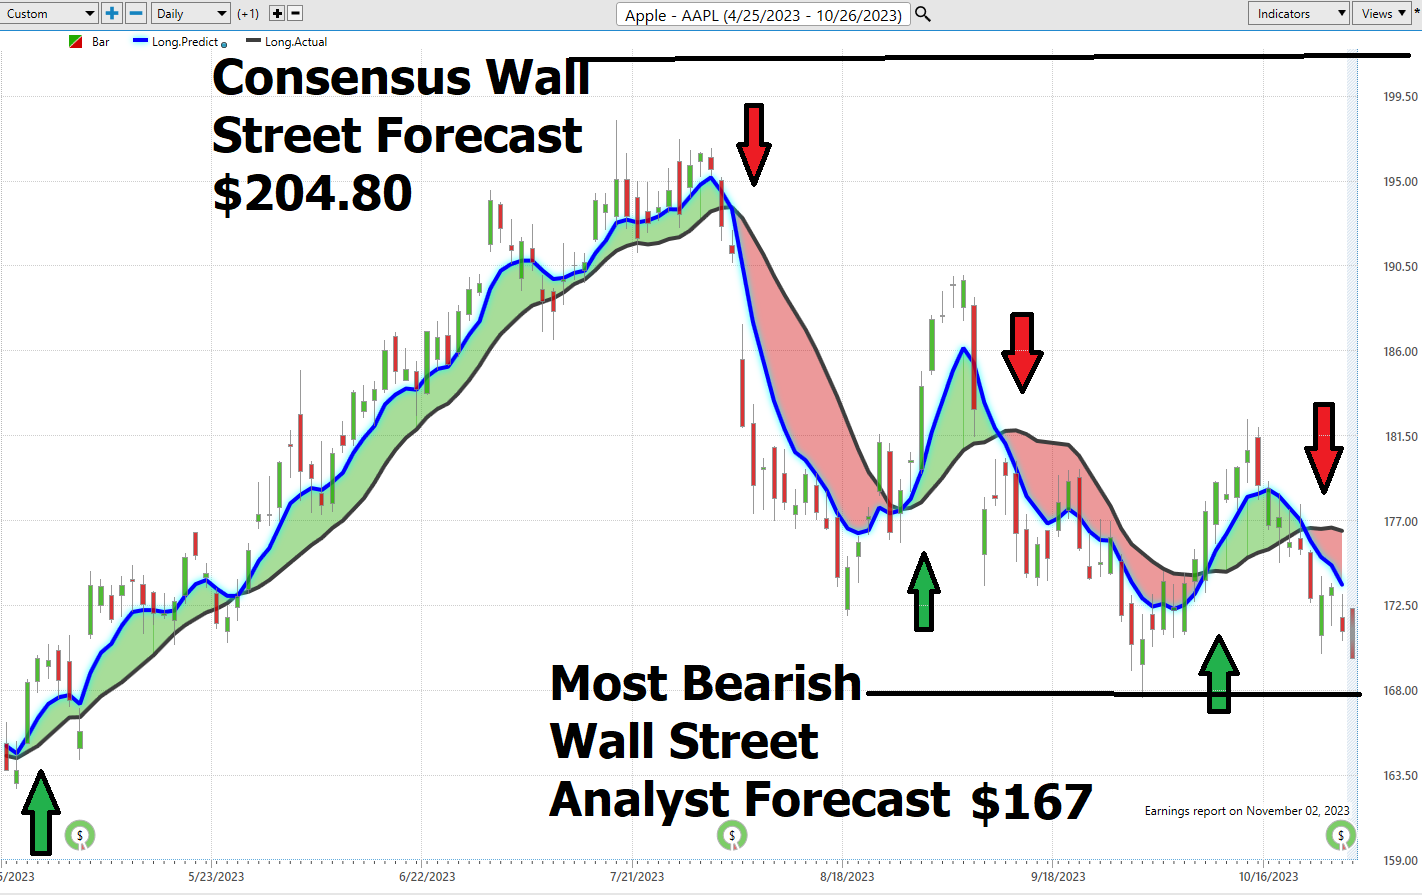
Over the last 6 months there have been 6 trend forecasts on $AAPL. You can see them all clearly labeled on the chart.
If you were a BULL, you might only take the UP forecasts.
If you were a BEAR, you might only take the Down Forecasts.
Regardless, what your outlook was, when guided by artificial intelligence you were ALWAYS positioned on the right side, of the right trend at the right time , based upon everything that was going on in the world. Not all of the trades were winners. BUT RISK was always managed according to the a.i. forecast.
Forecast #1 was a winner on the LONG SIDE and generated gains of 14%
Forecast #2 was a winner on the short side and generated gains of 5.4%
Forecast #3 was a loser on the long side and generated losses of -.24%
Forecast #4 was a winner on the short side and generated gains of 2.6%
Forecast #5 was a winner on the LONG side and generated gains of +.42%
Forecast #6 is currently open. It is short and has open profits of 2.5%.
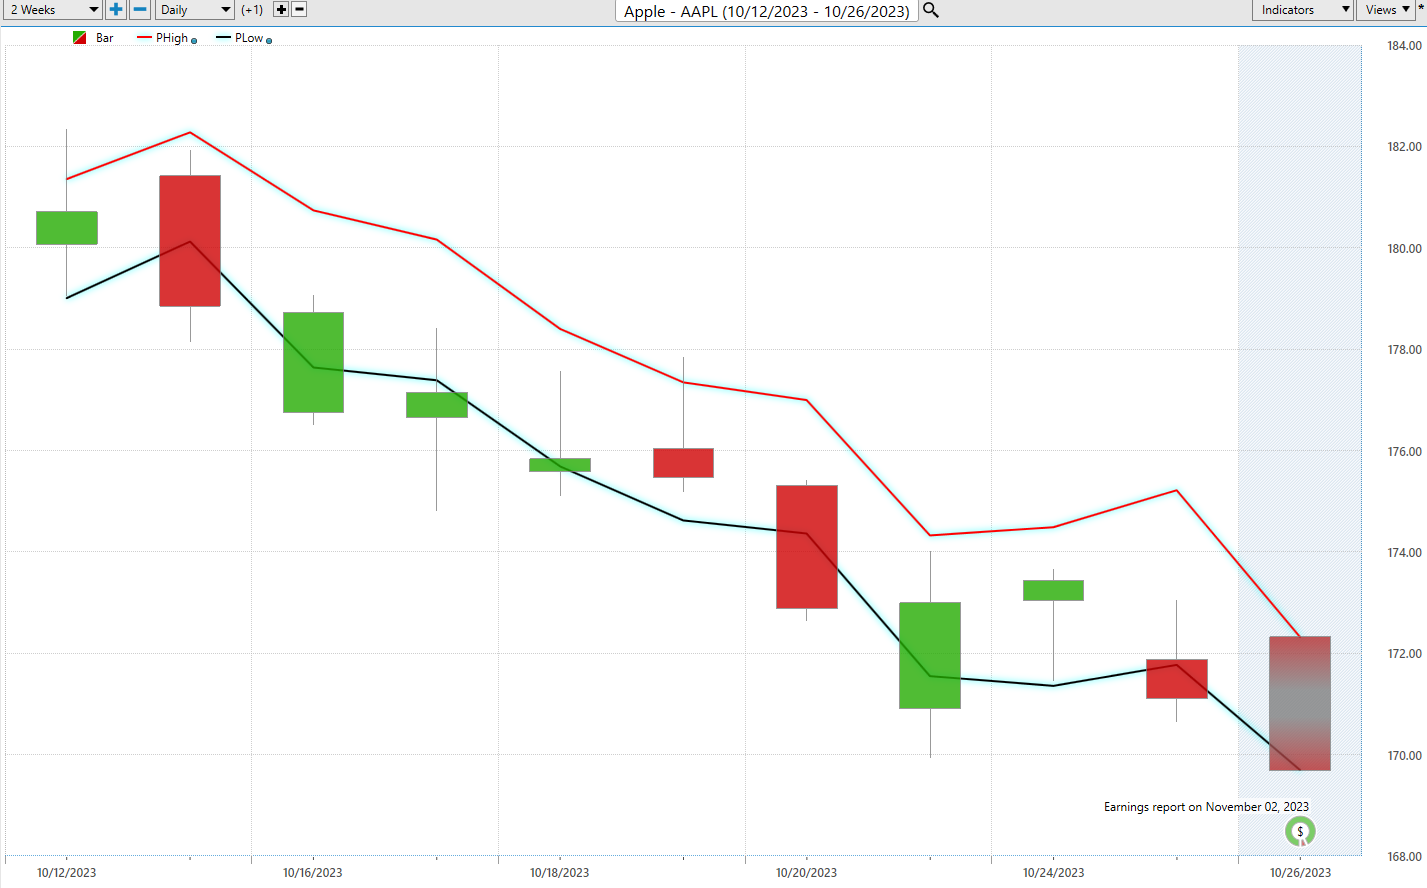
Many traders today are very short term. They are driven by very impulsive trading decisions where trades will often last a few days at most.
Here is the same chart of $AAPL reflecting the last two weeks price action with the Vantagepoint Daily Range Forecast. Power Traders using this tool will simply try to sell towards the top of the range and buy at the lower end of the range but will always be focused on the prevailing trend as dictated by the predictive blue line.
What does all this mean for $AAPL now?
My opinion is that smart traders are going to watch the price action very closely since $AAPL is testing the most bearish Wall Street Analysts forecast at the $167 price level. The trend is down. Within that simple and practical guidance lies tremendous research, statistical analysis, and horsepower.
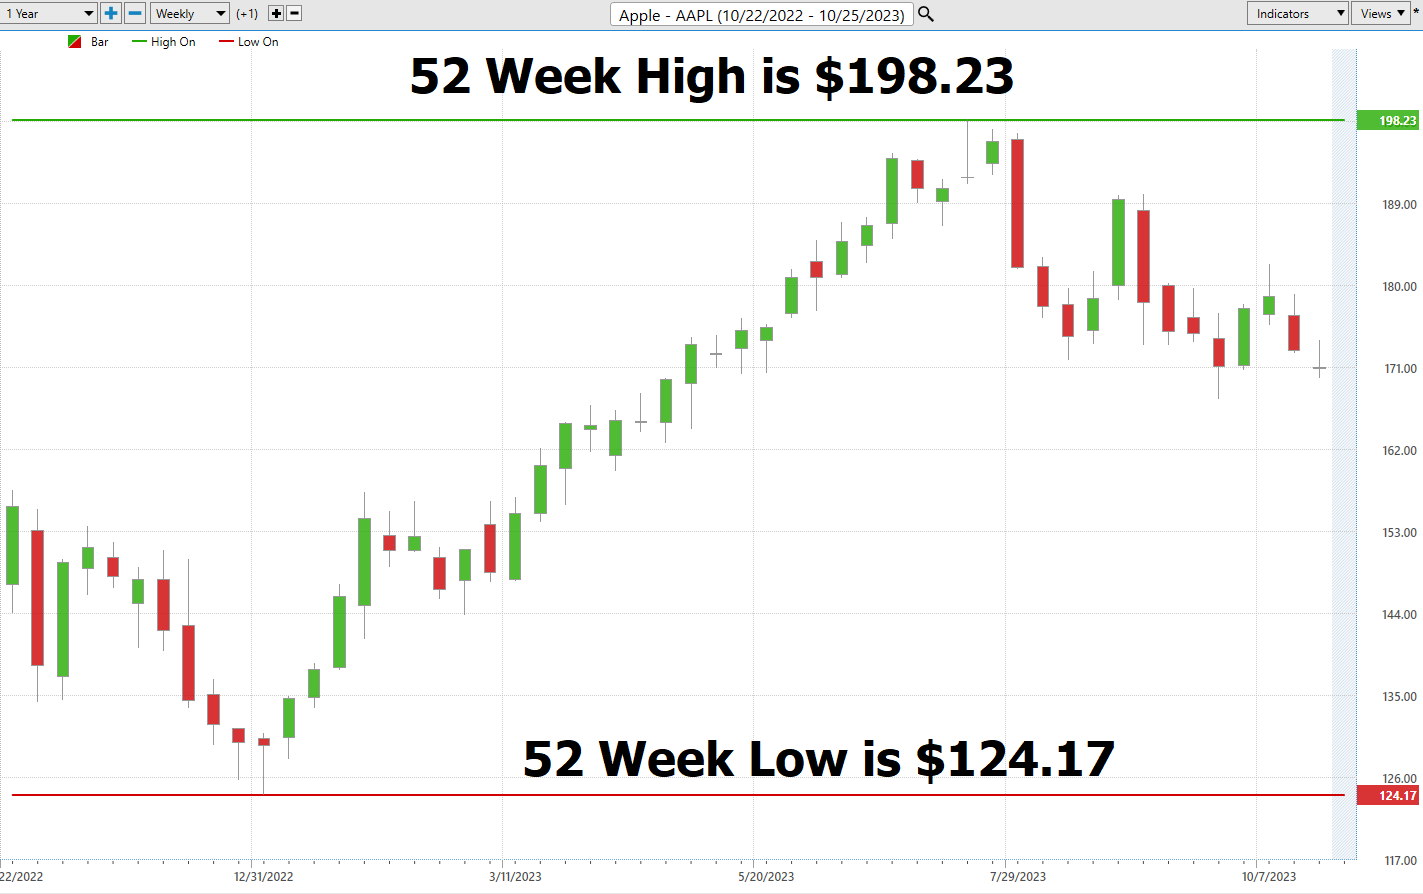
Here is a 52-week chart of $AAPL to illustrate the annual range that prices have had in Apple stock. The BEARS are clearly in control and my expectation is that should we close on a weekly chart under the $167 area, Wall Street Analysts will all revise their forecasts lower, and we will see prices continue to slide.
But in simple terms, the artificial intelligence will keep traders focused based upon the facts presented by the most recent price action. My practical suggestion is that you will create better results by simply being aware of the Wall Street Analysts forecasts and positioning yourself within the trend as defined by artificial intelligence.
Wall Street analysts, despite occasional inaccuracies in their forecasts, offer valuable insights into the fair value of stocks and the broader financial landscape. Their influence on the market cannot be overstated, and by incorporating their opinions with A.I.-driven analysis, investors can harness the collective intelligence of these quantitative minds to make more informed and potentially profitable trading decisions. While it’s essential to exercise critical judgment and diversify information sources, leveraging the expertise of Wall Street analysts in conjunction with AI can be a powerful strategy for navigating the complexities of financial markets.
To truly make a substantial impact in the world of trading, one must delve deep into the intricacies of the markets. It’s about being at the right place, at precisely the right moment, armed with the right strategy. The most adept traders out there aren’t solely fixated on amassing wealth; they are resolutely vigilant when it comes to preserving it. Their arsenal comprises a system, an unwavering discipline, honed to identify those elusive opportunities, particularly in these tumultuous times we navigate today.
Now, allow me to transport you to a realm of profound intrigue: the future of trading resides within the realm of technology. I’m referring to neural networks, the marvels of machine learning, and the unfathomable potential of artificial intelligence . Envision a world where the chasm between what’s “expected” and what “transpires” seamlessly converges. In this convergence, magic unfolds, and therein lies your destination. Artificial intelligence is not a mere ornament; it’s your golden ticket to the major leagues. Ponder this: how would you rate your decisions over the past year? Now, contrast that with what an A.I. could have accomplished. We humans possess our stubborn tendencies, succumbing to ego and occasionally failing to learn from our missteps. But machines? They thrive on errors, transmuting them into stepping stones toward perfection. If AI can triumph in the realms of Poker and Chess, what prevents it from mastering the art of trading?
It all boils down to one thing, my friend: knowledge—the kind of knowledge that can move mountains. And that’s exactly what A.I. brings to the table. It’s not just a ‘nice-to-have’; it’s your hidden ace up your sleeve in this crazy market rodeo we’re riding. So, what do you say, are you in?
Take the plunge with me, and let’s uncover how A.I. and its tech-savvy companions can lead you to your next colossal win.
We dive deep into these topics and explore them in our Live Trainings.
Please visit with us at our Next Free Live Training .
It’s not magic.
It’s machine learning.
Make it count.
THERE IS A SUBSTANTIAL RISK OF LOSS ASSOCIATED WITH TRADING. ONLY RISK CAPITAL SHOULD BE USED TO TRADE. TRADING STOCKS, FUTURES, OPTIONS, FOREX, AND ETFs IS NOT SUITABLE FOR EVERYONE.IMPORTANT NOTICE!
DISCLAIMER: STOCKS, FUTURES, OPTIONS, ETFs AND CURRENCY TRADING ALL HAVE LARGE POTENTIAL REWARDS, BUT THEY ALSO HAVE LARGE POTENTIAL RISK. YOU MUST BE AWARE OF THE RISKS AND BE WILLING TO ACCEPT THEM IN ORDER TO INVEST IN THESE MARKETS. DON’T TRADE WITH MONEY YOU CAN’T AFFORD TO LOSE. THIS ARTICLE AND WEBSITE IS NEITHER A SOLICITATION NOR AN OFFER TO BUY/SELL FUTURES, OPTIONS, STOCKS, OR CURRENCIES. NO REPRESENTATION IS BEING MADE THAT ANY ACCOUNT WILL OR IS LIKELY TO ACHIEVE PROFITS OR LOSSES SIMILAR TO THOSE DISCUSSED ON THIS ARTICLE OR WEBSITE. THE PAST PERFORMANCE OF ANY TRADING SYSTEM OR METHODOLOGY IS NOT NECESSARILY INDICATIVE OF FUTURE RESULTS. CFTC RULE 4.41 – HYPOTHETICAL OR SIMULATED PERFORMANCE RESULTS HAVE CERTAIN LIMITATIONS. UNLIKE AN ACTUAL PERFORMANCE RECORD, SIMULATED RESULTS DO NOT REPRESENT ACTUAL TRADING. ALSO, SINCE THE TRADES HAVE NOT BEEN EXECUTED, THE RESULTS MAY HAVE UNDER-OR-OVER COMPENSATED FOR THE IMPACT, IF ANY, OF CERTAIN MARKET FACTORS, SUCH AS LACK OF LIQUIDITY. SIMULATED TRADING PROGRAMS IN GENERAL ARE ALSO SUBJECT TO THE FACT THAT THEY ARE DESIGNED WITH THE BENEFIT OF HINDSIGHT. NO REPRESENTATION IS BEING MADE THAT ANY ACCOUNT WILL OR IS LIKELY TO ACHIEVE PROFIT OR LOSSES SIMILAR TO THOSE SHOWN.