You might recall the news from last week, where the economic prowess of Uncle Sam sprinted ahead with a formidable 4.9% annual GDP growth rate . To put it in the lyrical prose of media outlets like USA Today and The Wall Street Journal they described the accomplishment as “sizzling” “remarkable & phenomenal…”
President Joe Biden took center stage, describing the results as “a testament to the resilience of American consumers and American workers, supported by Bidenomics.”
GDP stands for Gross Domestic Product, and it’s like a big financial report card for a country. GDP, a term frequently bandied about like celebratory confetti on New Year’s Eve, often takes center stage in the rhetoric of politicians and mainstream economists. It’s hailed as the holy grail of economic health indicators. However, amidst the cacophony, let’s strip away the layers and discern what GDP truly represents and, perhaps more crucially, what it does not.
In its essence, Gross Domestic Product (GDP) encapsulates the grand sum of value derived from all goods and services crafted within a nation’s geographic confines during a designated timeframe—typically a year or a quarter. This metric, while comprehensive, is not an all-encompassing measure of a nation’s economic well-being. GDP does provide insights into the size and scope of an economy, but it falls short in painting a complete picture of citizens’ quality of life, societal inequalities, or sustainability. So, as we delve into the world of economics, it’s imperative to acknowledge GDP’s limitations and consider other factors to gain a more holistic view of a nation’s prosperity.
Imagine you’re checking how well your lemonade stand is doing. You’d look at how much lemonade you sold and how much money you made. You would compare your cost of production to the selling price and the end result would be your net profit.
GDP for mainstream economists and politicians claims to do the same thing but on a huge scale, measuring all the stuff a country makes and all the services it provides, like making cars, cutting hair, or building houses.
Here is the formula for GDP:

Now, here’s the tricky part. The formula above measures quantity not quality. What politicians and mainstream economists try to do when they promote GDP is to place a dollar figure on everything that is produced within a country. While this can easily be accomplished you can also see how this lends itself towards manipulation. GDP, or Gross Domestic Product, is essentially a way to slap a price tag on a nation’s total economic activity. It’s a handy tool used for comparing how different countries are doing economically or for tracking the growth of a single country’s economy over time. However, let’s delve into why GDP can be a bit of a flawed metric. First, it’s a quantity-focused measurement that doesn’t care much about quality. Imagine this: if a country splurges billions on healthcare because its population is unwell, that’ll give GDP a boost. Likewise, if a nation pours billions into military endeavors, GDP will tick up as well. But here’s the kicker – GDP doesn’t bother with distinguishing whether this spending is on productive or unproductive activities, or if it’s sustainable in the long run.
Another thorn in GDP’s side is that it doesn’t bother itself with who’s reaping the economic rewards. Picture this scenario: a country with an astronomical GDP figure, but all that wealth is concentrated in the bank accounts of just a handful of super-wealthy individuals. That doesn’t necessarily translate to a better life for the average citizen. We’re talking about a significant blind spot in the whole GDP equation.
The most effective thing that a trader can do is to break down each part of the GDP formula to make sure they understand what and how is being measured.
GDP = C + I + G + (X-M)
Let’s start with “Consumption,” the “C” in our GDP equation. This part measures the total value of all the stuff and services that households gobble up, from your morning coffee to your Amazon Prime subscription. Consumption usually takes up the lion’s share of GDP, accounting for roughly 60-70% of the total economic activity. In the good old US of A, it’s even higher, closer to the 70% mark. You could say it’s the economic lifeblood.
But… Consumption isn’t always a straightforward win.
In an economy driven by debt, sky-high consumption levels can often signal that folks are living large, but at a cost. They’re racking up debt on their credit cards, borrowing from the future, and essentially living a bit beyond their means. When interest rates are low and credit flows like water, it tends to encourage this unsustainable spending spree that artificially inflates the economy. The point that I’m making is consumption can be measured, but we must also seek to comprehend at what cost is consumption occurring for the metric to be meaningful.
For example, let’s just say as a thought exercise, that everybody in the country has a high-interest rate credit card with a $100,000 limit. If consumption is occurring because everyone is tapping out their credit card, clearly this looks good for consumption, but it is neither economically rational nor sustainable.
You see, the American consumer isn’t so much resilient as adept at obtaining new credit cards. It’s as if the credit card industry is populated by algorithms that detect a sense of desperation in applicants.
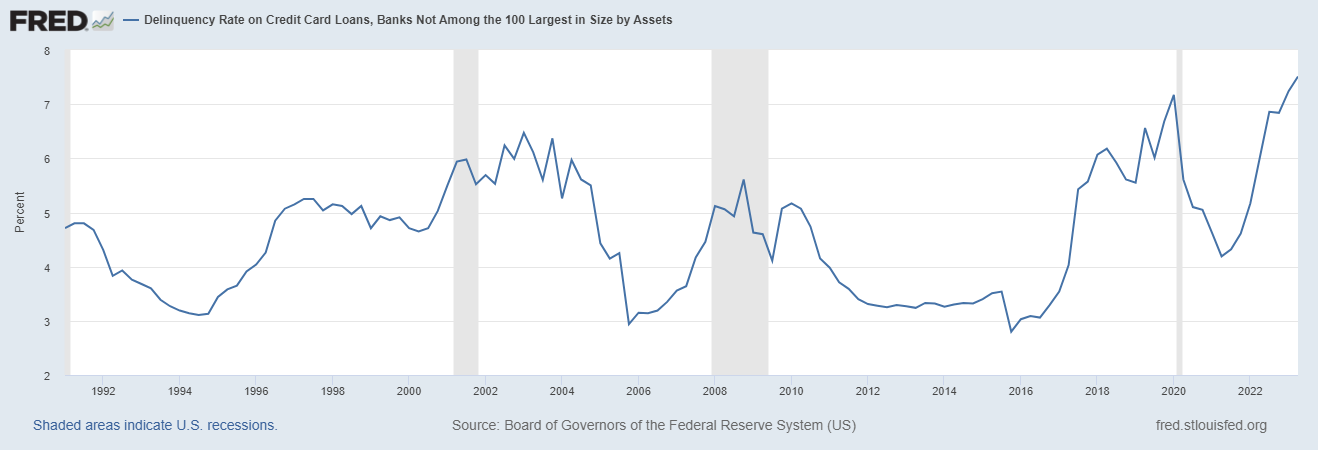
The ominous facts are these: U.S. credit card debt has reached an alarming $1 trillion, breaking records, albeit not the kind we’d celebrate. Credit card delinquency rates stand at 7.2%, surpassing even the highs of the pandemic era and 2009 during the Great Recession. Auto-loan delinquencies, at 7.3%, haven’t reached such heights since 1994.
Next, let’s delve into “Investment,” the often overlooked “I” in our GDP equation. This encompasses business investments in equipment and structures, residential construction, and even changes in business inventories. Investment is the secret sauce that fuels an economy’s long-term growth. It’s what prompts businesses to reach for the latest technology to boost productivity, and it’s the driving force behind the housing market when people invest in homes.
However, let’s not assume that all forms of investment are cut from the same cloth.
Sometimes, government policies can throw a wrench into the gears, leading to what we call “malinvestment.” This occurs when resources are funneled into projects that might not be the most beneficial for the overall economy. Think back to the mid-2000s housing bubble. A frenzy of investment poured into real estate, driven by artificially low-interest rates and lax lending standards. We all know how that rollercoaster ride ended, with a colossal crash. So, while Investment is a critical driver of growth, it’s crucial to keep an eye on the quality and sustainability of those investments.
Next is the “G” for government spending. Government spending plays a significant role in the calculation of GDP, and its impact can be far-reaching . I would go so far to state that government spending is the most crucial component of the GDP formula. Essentially, it represents the total expenditures made by the government on various programs and services, ranging from social welfare initiatives to healthcare, education, and military expenditures. These expenditures contribute to GDP by stimulating economic activity, creating jobs, and supporting various sectors of the economy.
Let’s break it down: when we talk about government spending and its role in GDP, we’re referring to all the money the government shells out on various stuff, like building infrastructure, funding public programs, and other projects. But here’s the thing: it doesn’t include transfer payments like pensions or unemployment benefits, which are essentially funds moving from one hand to another.
Now, while government spending is part of what makes up GDP, we can’t forget that this money comes from either taxes or debt, and both of those have their own economic consequences. Taxes can sometimes put a burden on individuals and businesses, affecting their spending and investment decisions. Debt, on the other hand, means we’re borrowing from our future selves or future generations, and that can lead to higher interest rates and potentially crowd out private sector activity.
Here’s the kicker: government spending isn’t always as straightforward as it seems. Sometimes it’s about taking money from one group of people and giving it to another, or even worse, funding projects that might not make much economic sense but score big politically. When the government spends more and more, it can start elbowing out the private sector, which can hinder genuine, market-driven economic activity.
However, government spending can be manipulated for political purposes, and this manipulation can have significant consequences . For instance, governments may strategically increase spending in the lead-up to an election to create the perception of economic growth and prosperity, thereby influencing voter sentiment. By pouring funds into projects, subsidies, or social programs, they aim to boost consumer and business confidence. This maneuvering can artificially inflate GDP figures, making the economy appear stronger than it actually is.
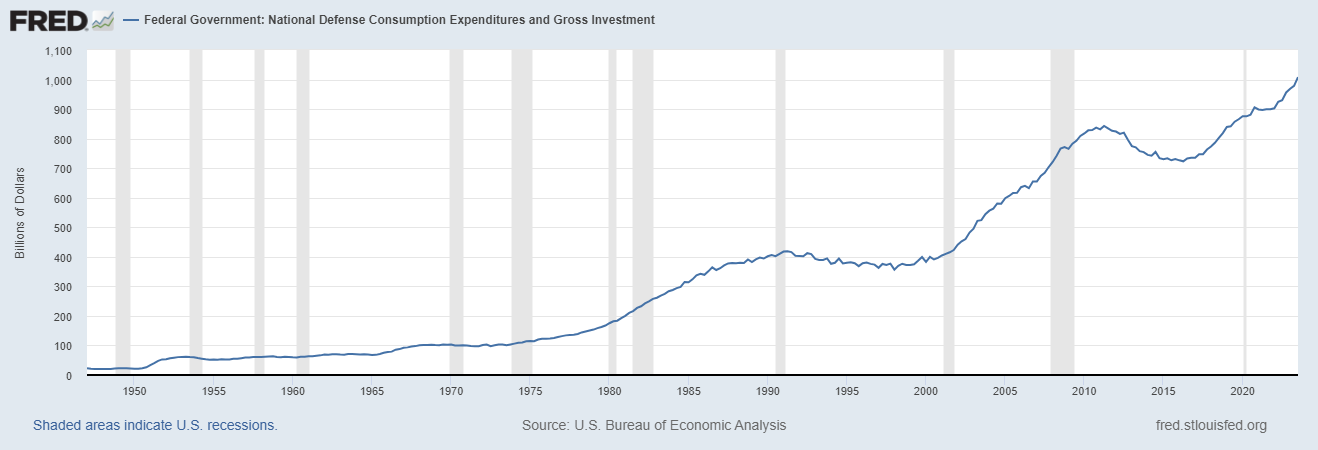
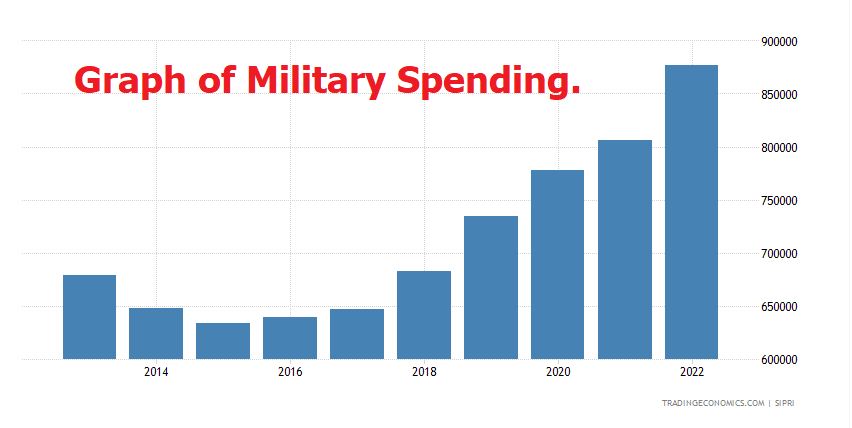
A classic example is the military-industrial complex in the United States. Increased defense spending can stimulate economic activity, create jobs, and support industries related to defense production. Politicians sometimes advocate for higher military budgets not only for national security reasons but also because it can have a positive impact on the economy, potentially boosting their popularity with certain constituencies. Similarly, increased government spending on social programs, such as Medicare or social welfare initiatives, can be used to garner support from specific voter demographics. In essence, government spending is a powerful tool that can be wielded strategically to achieve political objectives, even if it results in higher debt levels and questionable long-term economic sustainability. Our government is currently funding wars on two geographical fronts, Ukraine and Israel . It should not be a surprise to anyone who has been paying attention that defense spending in the last quarter increased by a massive 8%! Maybe I am jaded, but when I crunch the numbers for GDP it resembles more of a SPENDING indicator than a measure of production.
Politicians and economists sometimes try to make the GDP report look better than it really is. They might spend more money on things like roads or hospitals right before the GDP report comes out to boost the numbers. They do this because a high GDP can make the country seem like it’s doing great, and that can help them get re-elected or make people feel more confident about the economy.
The solution to this nagging problem is to look at GDP minus government spending. Analyzing GDP minus government spending allows for a focused assessment of the private sector’s performance, aiding in understanding resource allocation efficiency and evaluating fiscal policies.
Finally, let’s talk about Net Exports, represented by the difference between Exports (that’s the good stuff we sell to other countries) and Imports (the stuff we buy from abroad). If a country is exporting more than it’s importing, we call it a trade surplus. But if it’s importing more than it’s exporting, that’s a trade deficit.
Here is a simple analogy to understand trade deficits: Imagine you have a lemonade stand, and you sell lemonade to your friends. Now, let’s say you buy some cool new toys from your friend Tim. You give Tim money for the toys, right? That’s you buying stuff from him.
But here’s the catch: Tim doesn’t buy any lemonade from your stand in return. So, you’re spending money on his toys, but he’s not spending money on your lemonade. That means you have a “trade deficit” with Tim because you’re buying more from him than he’s buying from you.
In the real world, countries can also have trade deficits. It happens when a country buys more stuff from other countries (like toys, electronics, or clothes) than those other countries buy from it. So, just like with your lemonade stand, it means they’re spending more money on imports than they’re getting from exports. That’s what we call a trade deficit, and it can have some economic effects that people often talk about.
But here’s the catch – if a country’s stuck in a trade deficit for too long, it could be a sign of trouble. It might mean the country is spending more than it can really afford, sort of like maxing out your credit cards. Or it could be because they’re just not competitive in the global market, which can happen for all sorts of reasons, like outdated infrastructure or too many pesky regulations. So, trade deficits aren’t all good or all bad, but they sure tell us something about what’s going on in the world of economics.
The United States has been running trade deficits for several decades. It’s been a consistent trend in the country’s trade balance since the early 1970s. Prior to that time, the U.S. generally had trade surpluses, which means it exported more goods and services than it imported.
The shift towards trade deficits began in the 1970s for various reasons, including the OPEC oil crisis, which led to higher oil prices and increased imports of oil, and changes in the global economic landscape. The strength of the U.S. dollar also played a role, making American goods more expensive for foreign buyers and imports cheaper for U.S. consumers.
Since then, the U.S. has often experienced trade deficits, with occasional periods of trade surpluses in specific years. These trade deficits have become a topic of economic and political discussion, with different viewpoints on their causes and consequences. Some argue that trade deficits can be harmful to domestic industries and employment, while others believe they reflect the strength and diversity of the U.S. economy.
The point I’m making is that the GDP report showed that the economy did grow at an annual rate of 4.9%. But to understand how it accomplished that we need to comprehend the nuances of each component of the GDP formula. For those delving into the world of markets, finance, and economics, it’s crucial to grasp these elements, not as absolute truths, but as valuable tools in comprehending the intricate and unpredictable nature of the global economy.
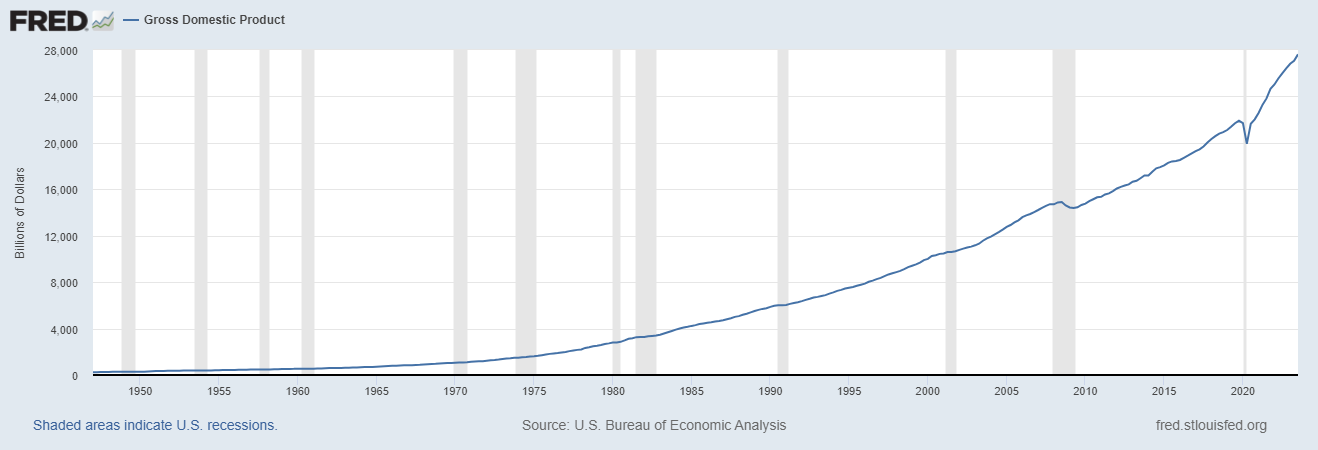
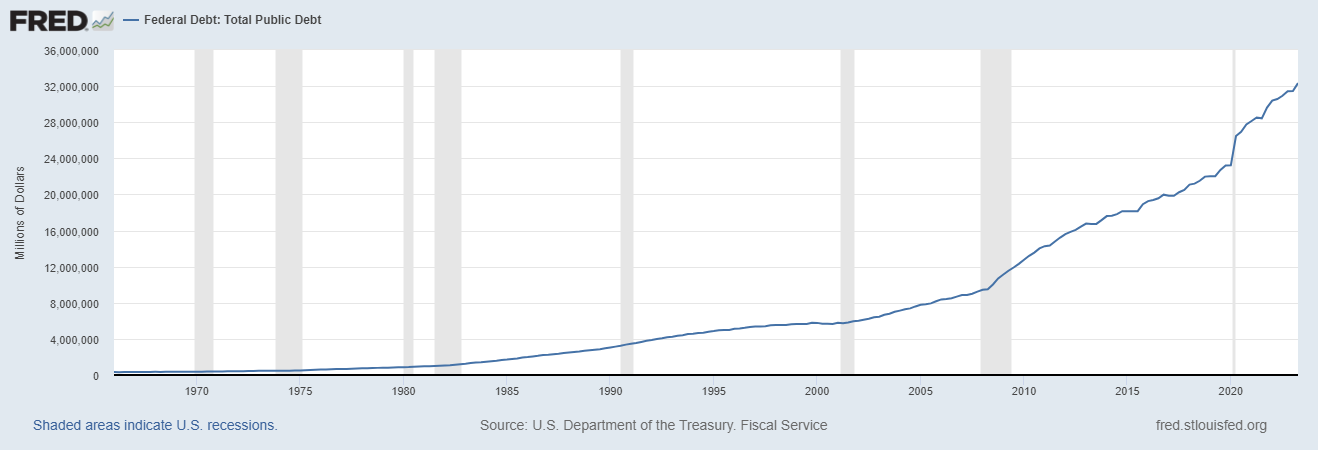
Here is a chart of GDP in the United States followed by Total Debt. Note how similar the graphs look. The point is that historically speaking a 4.9% increase in GDP is amazing. Equally important is that the United States added $2 trillion to the deficit in 2023. Recognize that these two statistics are very similar and moving forward I hope you recognize that economists and politicians love to talk about GDP growth while turning a blind eye to the growing debt that is causing the GDP growth.
Deficit spending and GDP are similar in that they are both key concepts related to a country’s economic activity and government finances. However, they are distinct in their focus and implications.
GDP, or Gross Domestic Product, is a measure of the total economic output of a country within a specific time frame.
Deficit spending, on the other hand, pertains to a government’s fiscal policy. It occurs when a government’s expenditures exceed its revenues or tax collections in a given period. In other words, the government is spending more money than it is taking in through taxes and other sources of income. This results in a budget deficit, which is often financed by borrowing through the issuance of government bonds or debt instruments.
The similarity between GDP and deficit spending lies in the fact that government spending is one component of GDP. When the government increases its spending, it can contribute to GDP growth, especially in times of economic downturns when private sector spending may be low. However, deficit spending can also have consequences, such as an increase in government debt, which may impact future economic stability and fiscal policy.
In summary, GDP measures the overall economic activity of a country, while deficit spending relates to the government’s fiscal policy of spending more than it collects in revenue. While they are related through government spending’s influence on GDP, they serve different purposes and have distinct implications for a nation’s economy. Traders should exercise caution when relying solely on GDP as a trading indicator. While GDP provides valuable insights into an economy’s overall health, it predominantly reflects the state of government spending. It’s crucial to recognize that the private sector and market dynamics can significantly differ from the government’s fiscal position. Hence, traders must consider a broader range of economic indicators and market-specific data to make well-informed trading decisions, as GDP alone may not fully capture the nuances of private sector performance and market sentiment.
The GDP report is calculated by experts at the Bureau of Economic Analysis (BEA) in the United States. The report is usually released a month or so after each quarter ends, so there are four GDP reports in a year. It’s an important tool for understanding how well a country’s economy is doing, but it’s essential to look beyond the numbers and understand if they’re being influenced for political or other reasons.
What does this mean to you the trader?
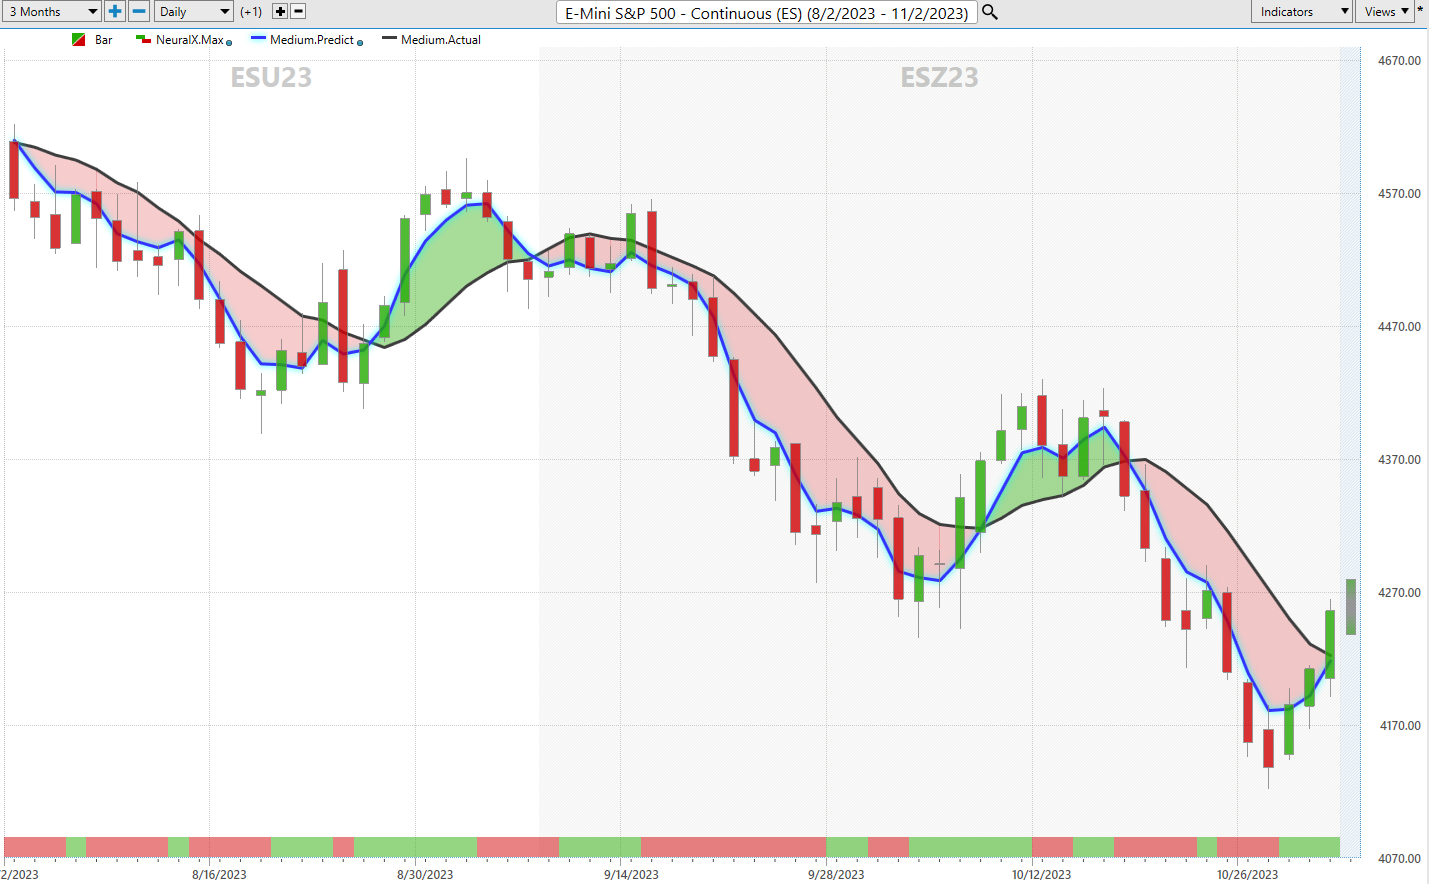
We are in a Presidential Election year. What always occurs in these situations is that whoever is in the office will do everything possible to make themselves and the economy look as wonderful as possible. As I consistently emphasize, my approach involves deep economic analysis, but I refrain from letting my thinking, or my conclusions cloud my trading decisions. Instead, I leverage artificial intelligence to enhance my decision-making process.
I think the economy is very problematic. But our government’s spending directed at the stock market will most likely result in a return of the bullish trend. Regardless, in the past I was paralyzed by fear scared that my analysis was too early, or that I was totally wrong. Today, I can simply allow artificial intelligence to discern the trend and I can decide if and how to participate.
At present, the markets diverge significantly from my economic assessment, and I acknowledge that reality. Markets, in essence, operate as discounting mechanisms, swiftly responding to current data to project an asset’s or economy’s future value. They diligently weigh information, including industry trends, economic indicators, and even sentiment, to establish real-time pricing, factoring in available information to discount a company’s future performance. Consequently, markets exhibit wild fluctuations in response to changing expectations or news as they actively strive to determine fair asset and commodity prices based on their existing comprehension.
In today’s landscape, artificial intelligence has become an indispensable ally for traders, with precise timing being paramount in successful trading.
Artificial intelligence , machine learning, and neural networks have wrought a revolution in the trading arena. These technologies empower traders with profound insights into market trends, enabling them to discern patterns and predict future asset price movements. AI also excels in swiftly analyzing news articles to grasp the implications of economic or political events on markets, facilitating rapid, informed decision-making. Moreover, A.I. tools adeptly gauge risk levels, allowing traders to assess potential losses and adapt their strategies accordingly. Ultimately, AI-based methodologies equip traders with a potent arsenal, enabling quicker, more intelligent trading decisions.
The sheer computational capacity of AI technology facilitates precise, in-depth analyses of market trends and financial conditions. Neural networks possess the capability to “learn” from vast datasets at a rate thousands of times faster than human processing, unveiling patterns often imperceptible to the human eye. Furthermore, they excel in identifying correlations that can forecast future outcomes with unparalleled accuracy. In sum, these technologies usher in advanced analytics, resulting in more astute trader decisions – an appealing prospect for any investor.
Rest assured, when A.I. signals a bearish forecast for stocks, I’ll be diligently exploring shorting opportunities, given the pessimistic narrative outlined in this article. The detailed analysis may span weeks or months, but I have the assurance that artificial intelligence will alert me to any bearish trend forecasts. In the interim, the markets are quick to change and adapt to new information.
The answers provided by A.I. may come as a revelation, elucidating the path for small traders to steadily grow their accounts through consistent, calculated market moves.
In today’s landscape, Artificial Intelligence, Machine Learning, and Neural Networks stand as essential safeguards for your portfolio, guiding investors toward more informed and profitable decisions.
We’ll discuss strategies like this one and show you at least three stocks that have been identified by the A.I. that are poised for big movement.
Discover why artificial intelligence is the solution professional traders go-to for less risk, more rewards, and guaranteed peace of mind.
It’s not magic. It’s machine learning.
Make it count!
THERE IS A SUBSTANTIAL RISK OF LOSS ASSOCIATED WITH TRADING. ONLY RISK CAPITAL SHOULD BE USED TO TRADE. TRADING STOCKS, FUTURES, OPTIONS, FOREX, AND ETFs IS NOT SUITABLE FOR EVERYONE.IMPORTANT NOTICE!
DISCLAIMER: STOCKS, FUTURES, OPTIONS, ETFs AND CURRENCY TRADING ALL HAVE LARGE POTENTIAL REWARDS, BUT THEY ALSO HAVE LARGE POTENTIAL RISK. YOU MUST BE AWARE OF THE RISKS AND BE WILLING TO ACCEPT THEM IN ORDER TO INVEST IN THESE MARKETS. DON’T TRADE WITH MONEY YOU CAN’T AFFORD TO LOSE. THIS ARTICLE AND WEBSITE IS NEITHER A SOLICITATION NOR AN OFFER TO BUY/SELL FUTURES, OPTIONS, STOCKS, OR CURRENCIES. NO REPRESENTATION IS BEING MADE THAT ANY ACCOUNT WILL OR IS LIKELY TO ACHIEVE PROFITS OR LOSSES SIMILAR TO THOSE DISCUSSED ON THIS ARTICLE OR WEBSITE. THE PAST PERFORMANCE OF ANY TRADING SYSTEM OR METHODOLOGY IS NOT NECESSARILY INDICATIVE OF FUTURE RESULTS. CFTC RULE 4.41 – HYPOTHETICAL OR SIMULATED PERFORMANCE RESULTS HAVE CERTAIN LIMITATIONS. UNLIKE AN ACTUAL PERFORMANCE RECORD, SIMULATED RESULTS DO NOT REPRESENT ACTUAL TRADING. ALSO, SINCE THE TRADES HAVE NOT BEEN EXECUTED, THE RESULTS MAY HAVE UNDER-OR-OVER COMPENSATED FOR THE IMPACT, IF ANY, OF CERTAIN MARKET FACTORS, SUCH AS LACK OF LIQUIDITY. SIMULATED TRADING PROGRAMS IN GENERAL ARE ALSO SUBJECT TO THE FACT THAT THEY ARE DESIGNED WITH THE BENEFIT OF HINDSIGHT. NO REPRESENTATION IS BEING MADE THAT ANY ACCOUNT WILL OR IS LIKELY TO ACHIEVE PROFIT OR LOSSES SIMILAR TO THOSE SHOWN.