-
View Larger Image
Welcome to the Artificial Intelligence Outlook for Forex trading.
VIDEO TRANSCRIPT
Hello everyone. Welcome back. My name is Greg Firman and this is the VantagePoint AI Market Outlook for the week of June the 5th, 2023. Now, to get started this week, we’ll begin with the dollar index.
U.S. Dollar Index
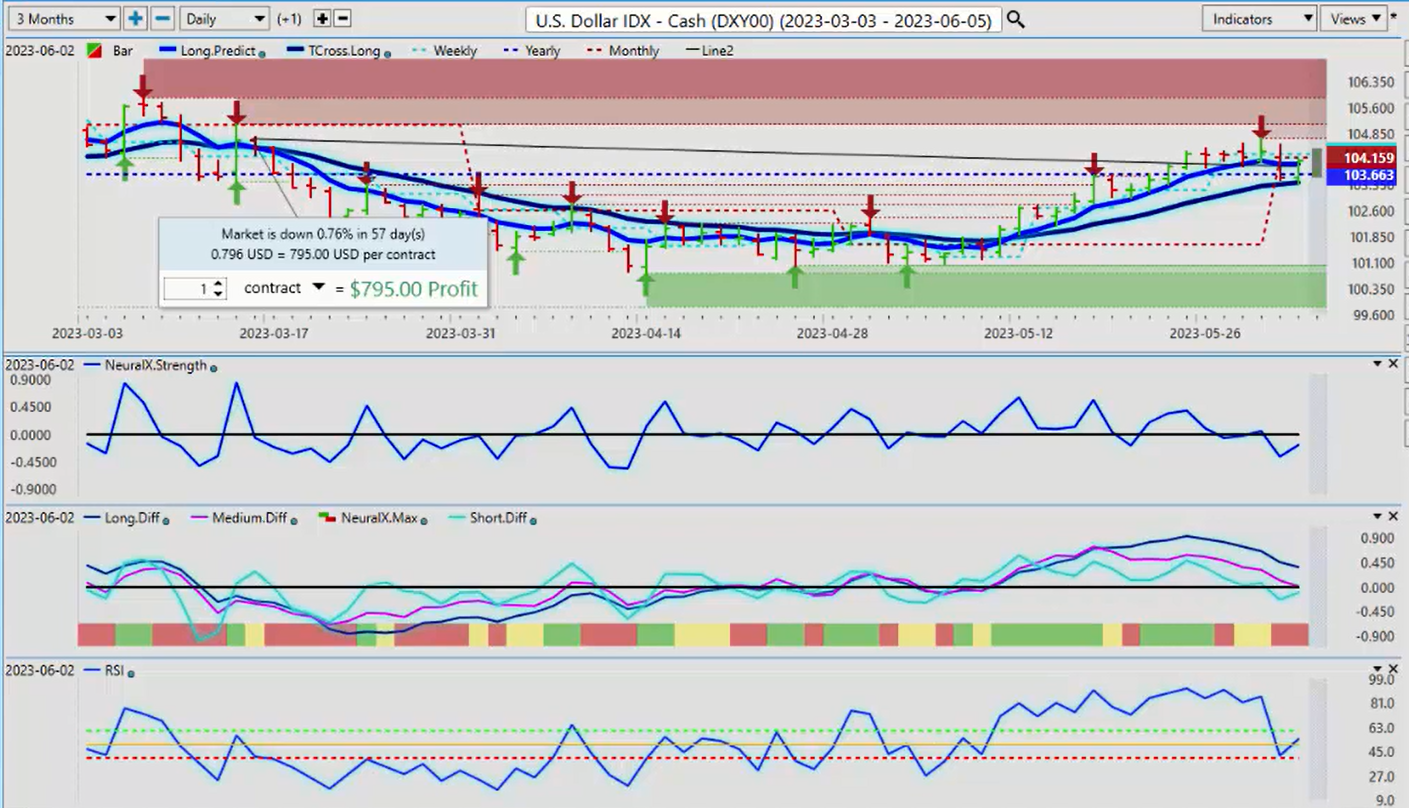
Let’s have a quick look at the performance of the dollar index. Basically, over the last 57 days, we’re still down 0.76% and essentially, over the last several weeks, the dollar is seeing some buying with the debt ceiling. But again, that’s a short term move in most cases. So when we look closer at that, the dollar still negative on the month, negative in the first week of June. Now, the non-farm payroll number has come out. That number, in my respectful opinion, was not a good number. The U-6 number has moved higher, wage disinflation, you’ve got numerous issues inside that report and on top of all that, the unemployment rate is ticked up with the U-6, not down.
So again, when you look at the internals of the different sectors, there’s very little meat on the bone for the Fed to be hiking anything, again, only in my respectful opinion. But the performance is what we need to look at. Now, what I’ve done here is I’ve looked right around this March period when there was heavy buying of the dollar, and most of your analysts are saying, “Okay, only buy dollars, only sell stocks, only sell gold and Bitcoin.” None of that has come to fruition, guys. We must remember that. We’re simply retracing back to where we’ve already been. So right now, the dollar has come down to the VantagePoint T cross long. That T cross long coming in at 103.42. So for next week’s trading, we must turn positive on the year if we’re going to buy dollars. But again, at this particular time, the indicators in VantagePoint are very mixed and I believe it will take a few days for the market to digest that payroll number to really see what’s inside that, and the closer they look, I don’t think they’re going to like what they see.
So again, in most cases in the dollar cycle, which I’ve talked about on here and in the VantagePoint live training room, is that we have this dollar cycle where we see buying in the dollar up to, and including, the non-farm payroll, and then usually by the Tuesday or the Wednesday of the following week, regardless of what that number is, real money is no longer buying dollars. So again, be very, very cautious at the start of the week because that unemployment rate is not what it actually appears to be. Again, in my respectful opinion only. But we have a couple of levels. Our monthly opening price, all of our resistance up here is, again, still unable to turn positive. Our monthly opening price, 104.15. We’re above our yearly opening price, but just barely, and we’ve breached it multiple times this past week. Our weekly opening price, again, 104.24. So all of our resistance is just above the 104 area. But if we can’t hold above this by Tuesday or Wednesday, then basically, that’s the green light to start selling dollars.
Gold
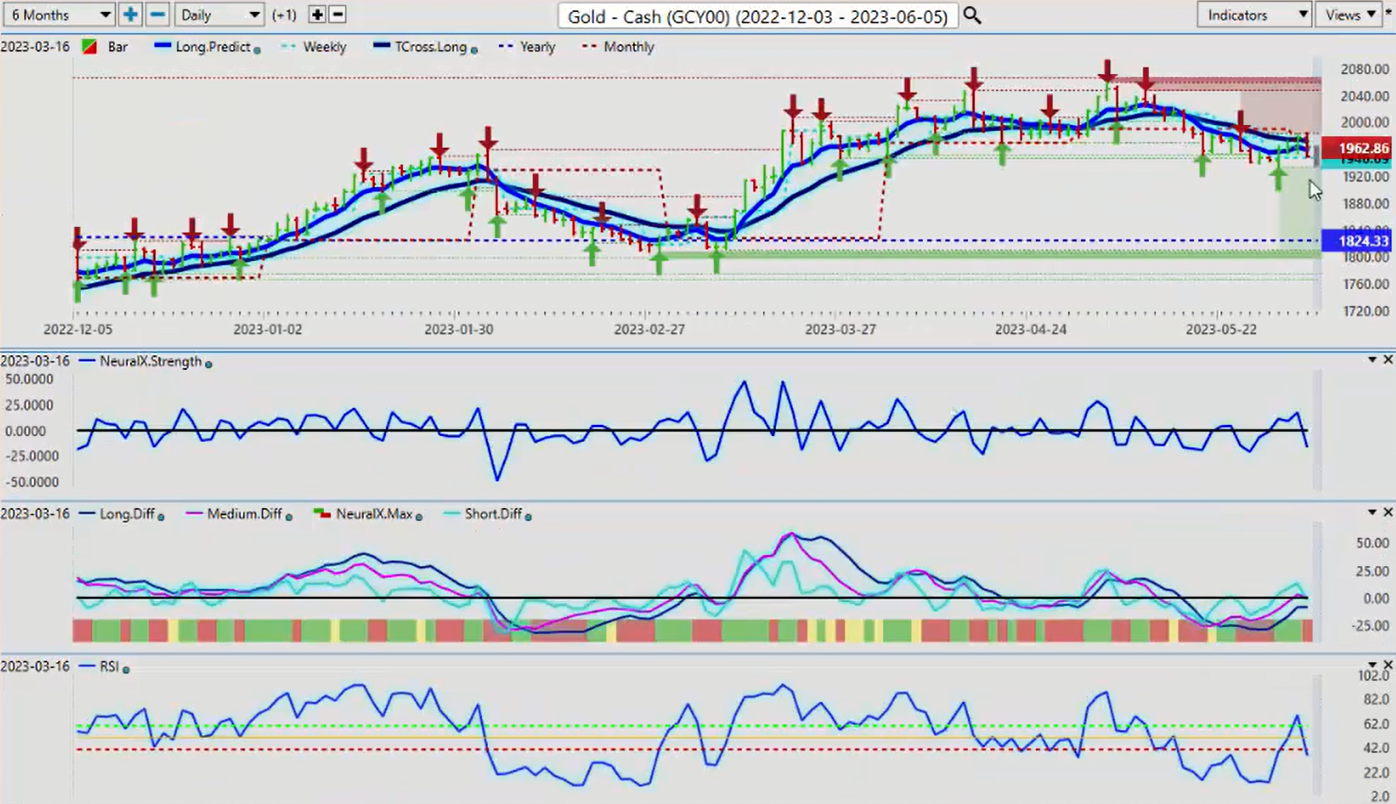
Now, with this, we can see gold is starting to recover somewhat, but failing at the T cross long at 19.71. So if the dollar can break lower, that should trigger some gold longs here. But the indicators here, also on gold, are somewhat mixed. We have a short term and a medium term crossover, but not a long term. The position of the predicted RSI still has a bearish tone to it. We’re sitting at 36.1, suggesting there’s still a little bit more downside momentum building here, but we also have a newly formed verified support low at 19.32, so that’s basically your support to start the week. We’ll see if we can hold above that. If we can, the dollar breaks down, then we see gold going higher.
S&P 500 Index
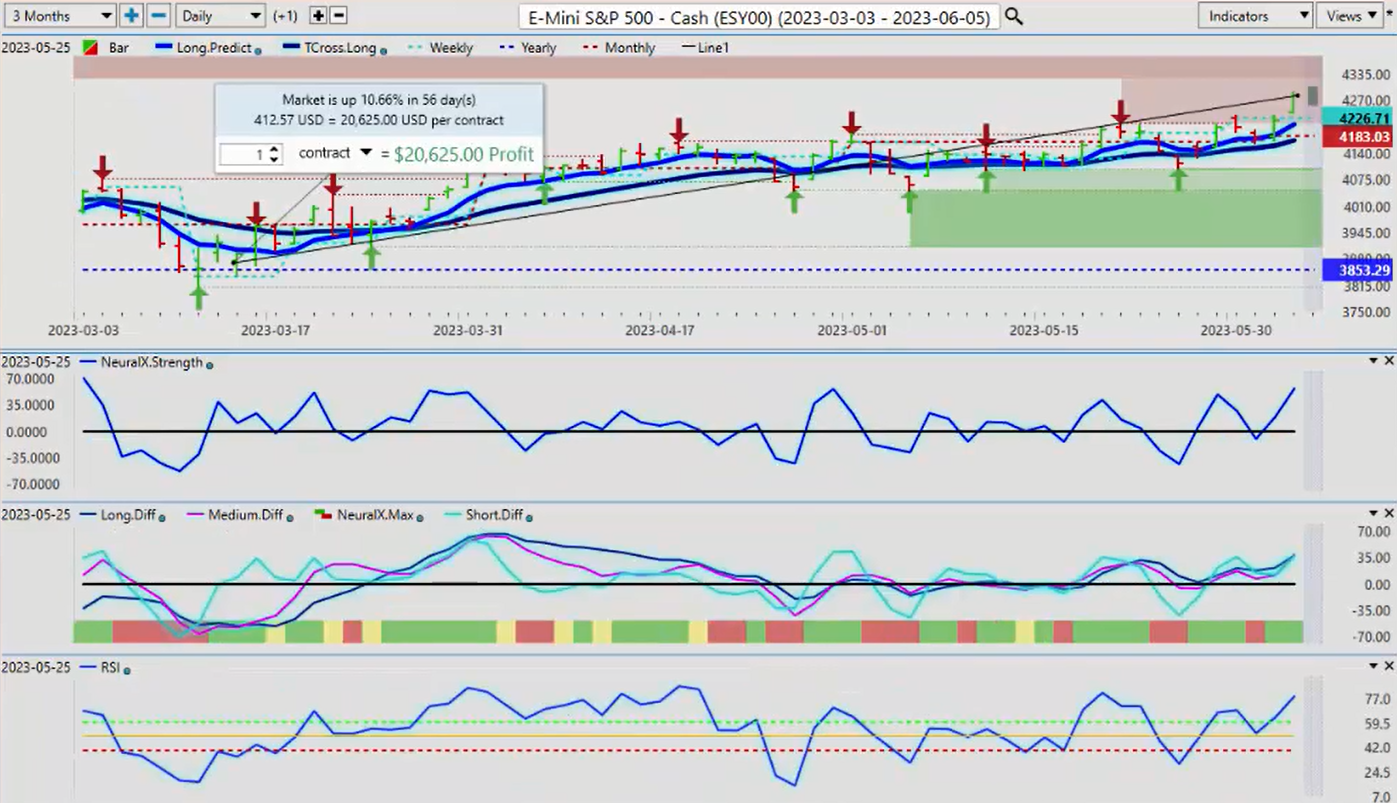
Now, when we look at the stock market here, I think it really is a good time to have a deeper dive into this. This volatility where we saw the dollar sell off, back when everybody was telling us to buy dollars back in March, and we all know how that turned out, but I was never in that camp. So what I was looking at was a comparative analysis to the S&P 500, the oil sector, oil stocks, which I’ll talk about in a moment here. But first of all, we look at this yearly opening price, and we never really broke down below that. I’ve shown, in the previous weekly outlooks, the buying opportunity off the yearly opening price. But right now, from this reversal point back in mid-March, the S&P 500 is up 10.66%, which is a very, very strong move.
So, again, when we look at this, the intermarket correlation or inverse correlation is, if the dollar is going down, stocks are going up. So when we look at the comparative where we’re at currently, right now, the dollar index is up a mere 0.38% on the year when we’re using an accurate measurement of performance. When we look at the S&P 500, we’re up considerably higher than that, and over the last three months alone, we’re up 10.66%. So there’s a clear definition of a trend there, which favors stocks, commodities, but it doesn’t favor the dollar, and that’s the way we want to look at this. So for next week, if the S&P 500 were looking forward to build on these gains, we need that dollar starting to fail by Wednesday of next week. If that’s the case, then the S&P has room to extend its gains.
The first level of support would be our long predicted, 4211, followed by our T cross long at 4172. The theory here too, again, our monthly opening price, 41.83, that’s our key support level, and that would be the area we would be looking for longs.
Light Sweet Crude Oil
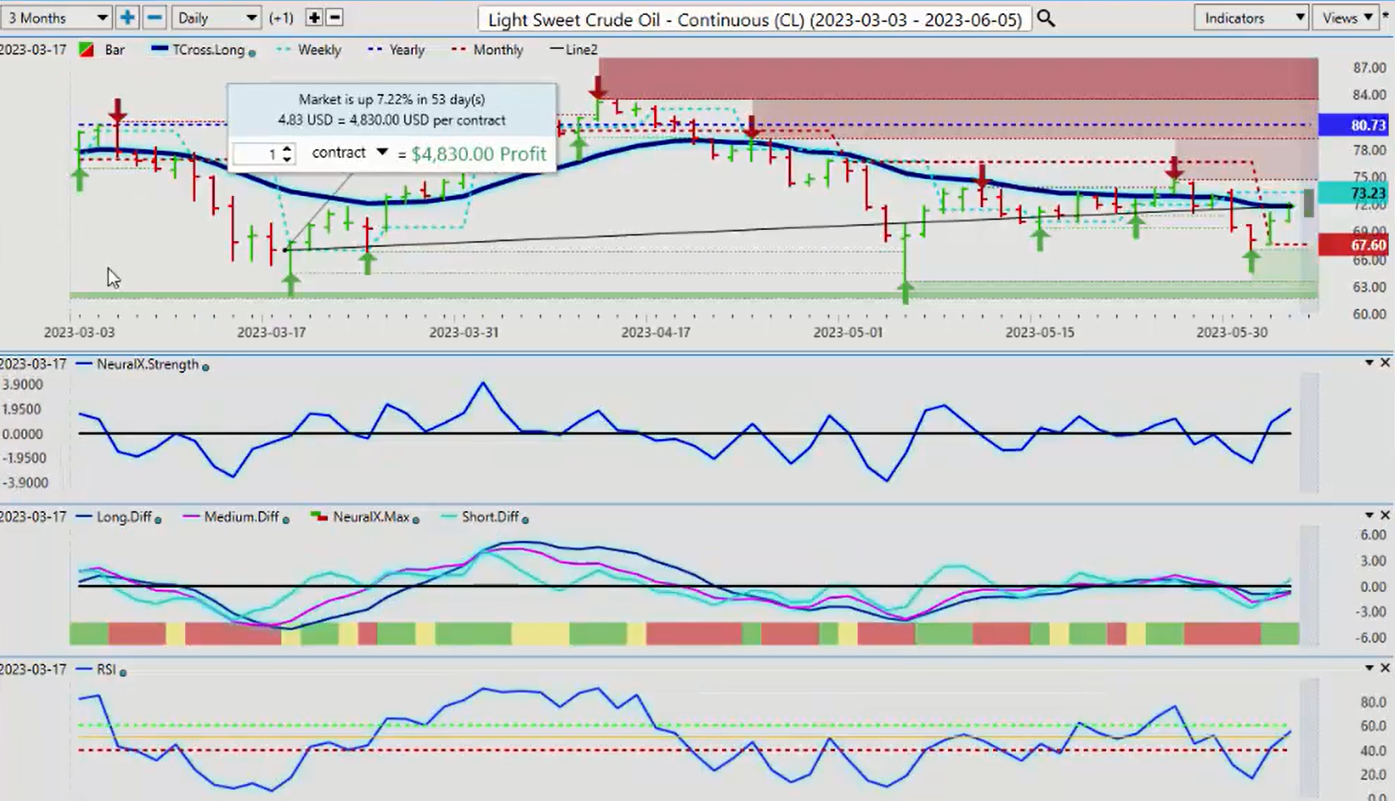
Now, when we look at light sweet crude oil, a lot of misinformation, disinformation about oil, some of the energy stocks, so let’s see if we can clear some of this up. Basically back in March, when the stocks turned around and violently reversed, caught a lot of people off guard when the S&P and the global indexes reversed higher, oil actually reversed higher with that. We have Saudi Arabia and all this stuff that’s not real, it’s just noise, like the debt ceiling is caught… The drop in oil in the last 25, 30 days has largely been because of the debt ceiling and assuming that the US is going to default, but again, as I’ve stated on here, the probability of a default is almost zero.
We’ve seen this movie before, guys. We know what the outcome is, so the volatility was somewhat unnecessary, but it was a very, very good opportunity to pick up longs on, not just oil, but oil stocks. If we look at this closer, right now, oil is challenging the VantagePoint T cross long. But since that recovery of the S&P 500, the positive intermarket correlation, here, to oil and the S&P 500 is indisputable. The S&P 500, approximately 10.66%, but oil is right behind it at 7.22% from the recovery date when everybody got caught short on both of these markets. So if we actually do a comparative analysis and we look at the Hess stock, Hess stock, from the same period, as of Friday, is up 16.9%. This is exactly where you want to be over the last several months, ignoring the foolishness of the last 20 or 30 days with the debt ceiling conflict.
This is just noise guys, right? You have a long-term seasonality, 20 plus year seasonality, that tells us oil goes up between May and July 3rd. So as you can see, when we do a comparative analysis to Keysight technologies over the same period, is up only a mere 6.07%. This is not the place we want to be necessarily, or in the alternative, we can be in both, but we don’t want to be saying that this is not the place to be. This is exactly where we want to be, guys. The numbers don’t lie. The key phrase for 2023 should be “facts matter”, right? So again, Hess being one of your top performers, several days or 20 days of a downtrend was simply a buying opportunity. Now, we’re making a series of higher lows. So again, unless this particular stock… Well, what it would take is for oil to completely collapse and oil will likely move lower later in the summer, but for right now, it’s very, very strong.
But again, we don’t want to get caught up in too short term of moves because again, when you actually look at the real performance from the global intermarket correlations and the reversal points from between the dollar, the S&P 500 oil and gold, then we see that, actually, Hess is one of your top performers right across the board. Now, Meta, some of these stocks, they’ve done very well also. But again, the comparison between Hess and Keysight technology heavily, clearly favors Hess.
Bitcoin
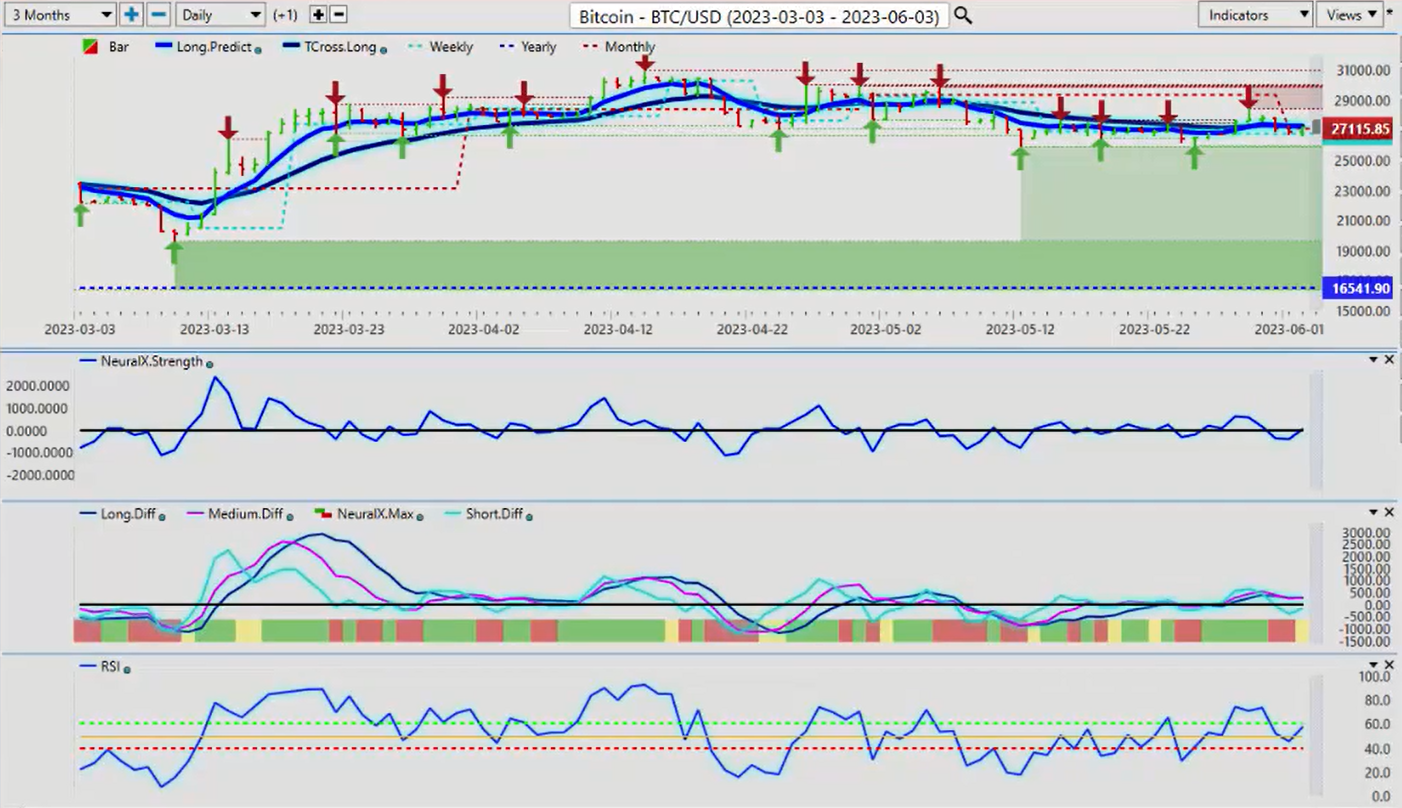
Now, when we look at some of the additional markets here, Bitcoin, they’re telling us that Bitcoin has had its worst month in 2023 and it just paints a horrible picture, doesn’t it? But in an actual fact, guys, once again, if we look at the reversal point going back into when the S&P 500 turned, then we can see that, yes, the Bitcoin has been down slightly, but nothing goes straight up and nothing goes straight down.
What they failed to mention is that Bitcoin, from this period, is still up over 25%. So for next week, June is usually a hotter month, I might add, for Bitcoin, but it’s usually not until the end of the month or beginning into July. So we’ve got heavy support that’s coming in at the low of 25,881, this verified support, we’re looking for that area too. I would prefer that it would hold, but either way, Bitcoin, in my respectful opinion, is a buying opportunity, the numbers on the year clearly tell us that. But again, we can see that multiple markets, the core lesson here is that dollar up, everything else down. So next week, going into our trading, if the dollar follows its normal pattern and it sells off by Wednesday, then most of these other markets are going to continue to advance. That would be a number of your stocks that I’ve just mentioned, your oil higher, possibly gold higher, but stocks. If you look at the Russell 2000 from last week, a massive move on Thursday and Friday on that.
So these are the things we want to make sure we’re looking at and not getting caught up in short term 10, 20 day trading, because that doesn’t make a trend, guys. That, usually, is simply showing you a reversal or the markets responding to some noise like the debt ceiling, like the Fed flip flopping back and forth. So we want to remember this, but to begin, we have to make sure that we understand, 16,541, Bitcoin is very, very much one of your top performers on the year, and we would continue to look to buy Bitcoin and Bitcoin related stocks or blockchain related stocks while we’re holding above that particular level.
Euro versus U.S. Dollar
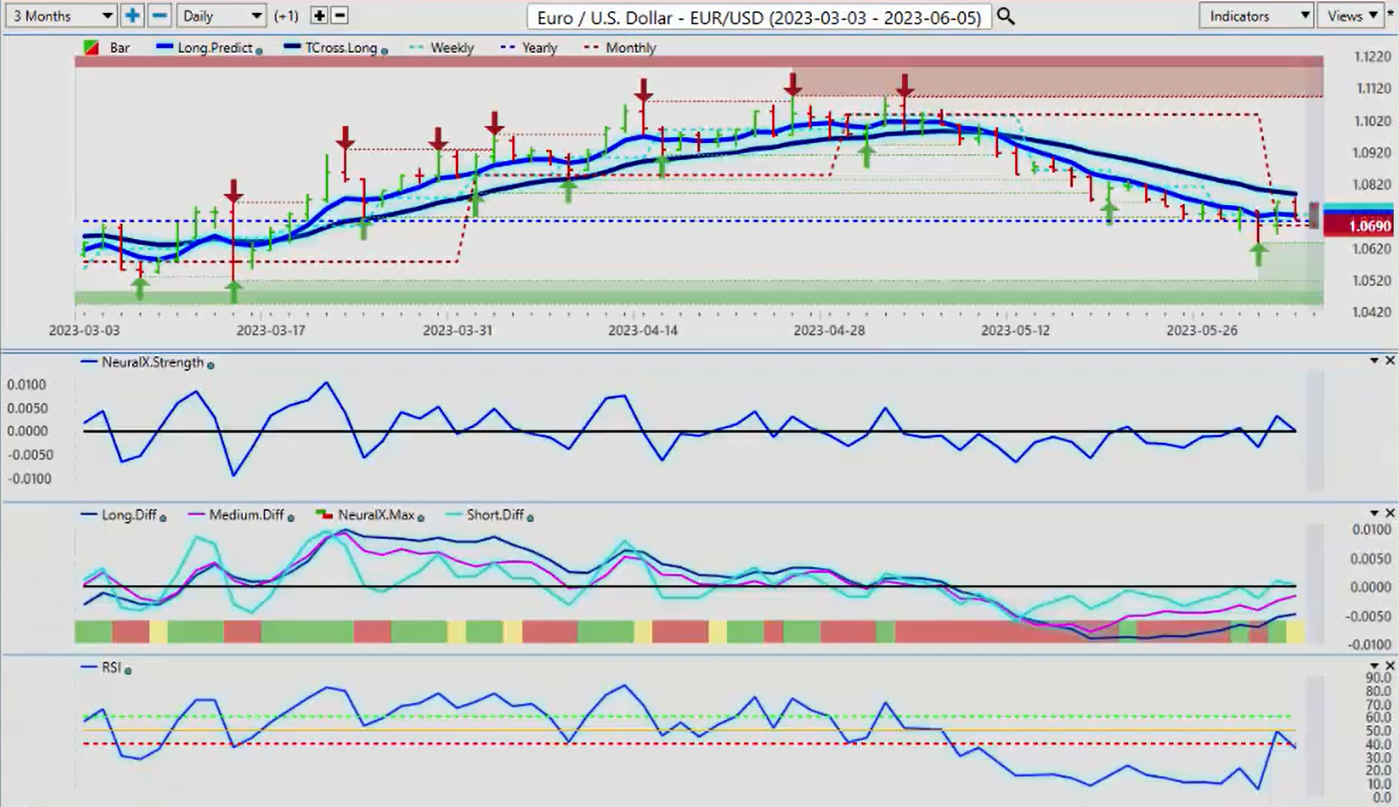
Now, as we go into some of our main Forex pairs, once again, we’ve got a number of different pairs we can look at to determine this. But remember that most of your Forex pairs have one thing in common. You’re either buying or selling US dollars.
I believe the real rates will favor the Euro in the near future, but right now, we can see that the battle lines are being drawn right along the yearly opening price that’s identified in the VantagePoint software. That yearly opening price, approximately… Remember, Forex is a decentralized exchange. That number can vary slightly. We’ll just call it right around 107, 106.90. I know I was talking to a few of you guys and, “Well, my broker platform says this,” “Mine says that,” That’s because some broker platforms open earlier than others and you can get a slightly different number, and also, some of the brokers have wider spreads on that opening on Sunday night. So tomato, tomato, we just want to get roughly close to that. But for now, the Euro is holding its own.
So the theory here is that if the Euro continues to hold above its yearly opening price, then the dollar is likely to move lower. When we also look closer at the dollar, we need to understand that the dollar got to this level, where it is now, based on the Feds saying that he was only going to hike rates 0.95% in 2022, and he ends up hiking over 4.5%. So that distortion or that confusion around the Fed has caused a significant amount of selloff here. But we can also further assess here. If we go back to this period where we had this significant reversal in the markets, which I believe was a bear trap against all of those markets, which, if you go back and look at the weekly outlooks in March, I am a strong advocate that this is the wrong move, selling stocks, buying dollars, because 2023 will not be the same as 2022 for the dollar. That is extremely unlikely, barring some catastrophic, risk off event, which we’re not currently seeing right now.
So once again, when we look at this, we can assess, here, that we’re looking to hold above this particular level, but a lot of people use the Euro US as a barometer for the rest of the pairs. So right now, our VantagePoint T cross long, 107.86, that’s the target we’re looking to break through to get the Euro back into its upward momentum, and I suspect that is possible by approximately Wednesday, Thursday, maybe even on Tuesday of next week. Now, my concerns here are, predicted differences are rising, they’re going in the right direction. Our neural index is saying short-term volatility, that’s perfectly normal while the market digests that very confusing labor report out of the US on Friday. So we’ll let that settle, but the reverse check mark here in the RSI is a concern for me because we’re not getting above that 50 level.
So once we get above 50, we’re looking to break above 60 on the predicted RSI. Then we’ve got momentum, okay?
U.S. Dollar versus Swiss Franc
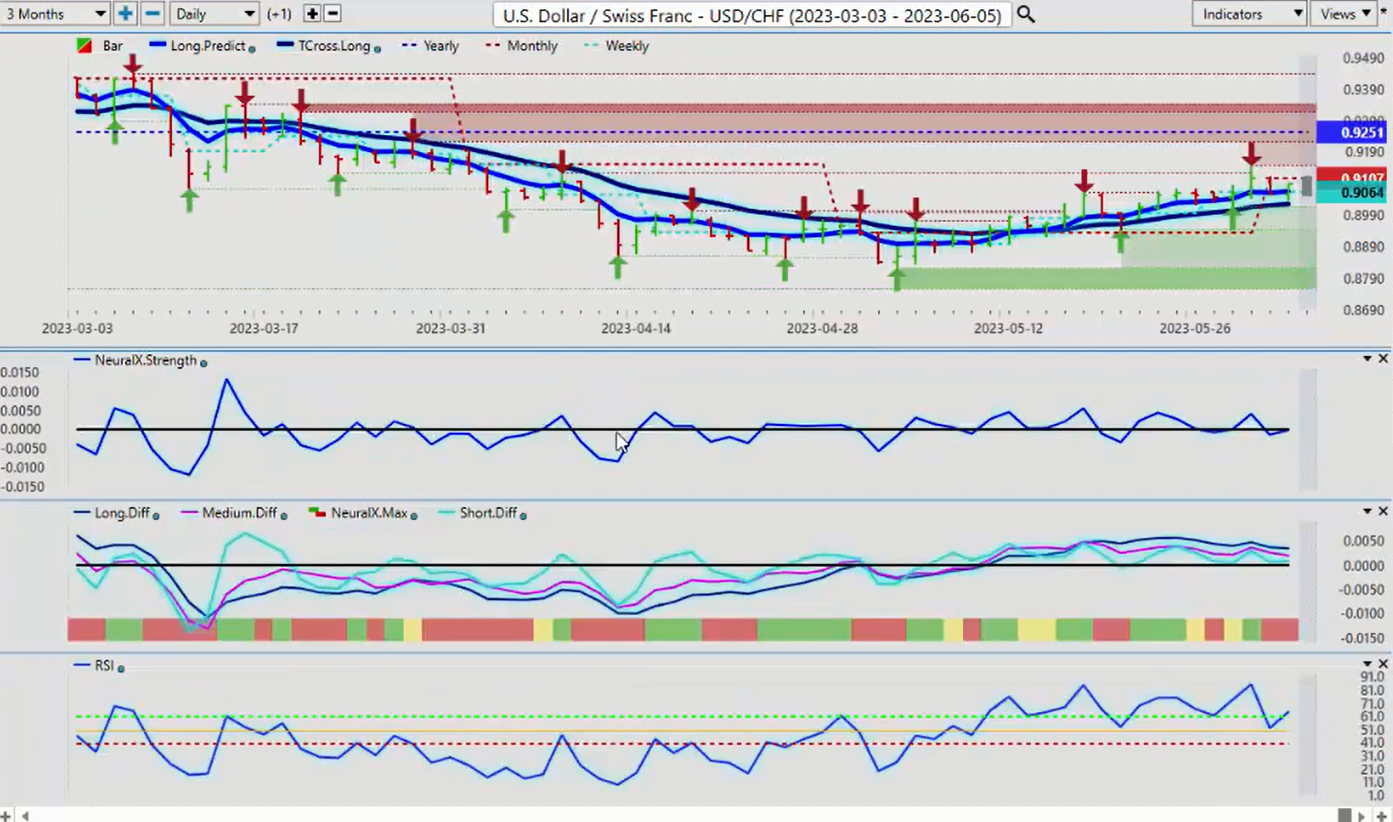
US Swiss Franc, again, a dollar trade, basically a dollar index trade. Firmly below its yearly opening price, really showing the depreciation of the US dollar. Despite these crazy rate hikes from the Fed, we remain below 92.51. So again, in my respectful opinion only, I prefer to buy something when it’s positive on the year because it tells me what the real trend is. So this real trend, right now, when we look at this over the last six months, it’s not pretty, guys. It’s not pretty at all. You can see that if we look from the beginning of the year, and again, this is a very strong barometer for what the real price of the dollar index is. When I measure this, I can say, “Okay, well if they’re telling me to buy dollars, then why is this still down 1.87%?” And you have to realize, a currency pair that’s down 1.87% on the year is significant compared to a stock.
So again, I’ll continue to monitor this and update everybody each week, but I’m looking at, can the dollar make gains against the Swiss Franc? And it just doesn’t seem as though it can. It was thrown a life preserver on Friday or T cross long 90.26, but again, a very shallow bounce. We’re still negative on the month, the monthly opening price, 91.07. If I’m buying this, the minimum requirement I need is to be above the T cross long, but I also want to be above the monthly opening price. So keep that in mind because we’ve got a very mixed bag of indicators, but you see that reverse check mark.
So there’s still some life in the dollar here. It’s not done by any means, don’t get me wrong, but we have a very objective way of looking at it, that the dollar has to remain positive on the year, must remain above the VantagePoint T-cross long. All of these things must connect. We don’t want to take subjective trading methodologies, “Well, I think it’s going to do this,” Or, “I think it’s going to do that.” We want to draw some lines in the sand here.
British Pound versus U.S. Dollar
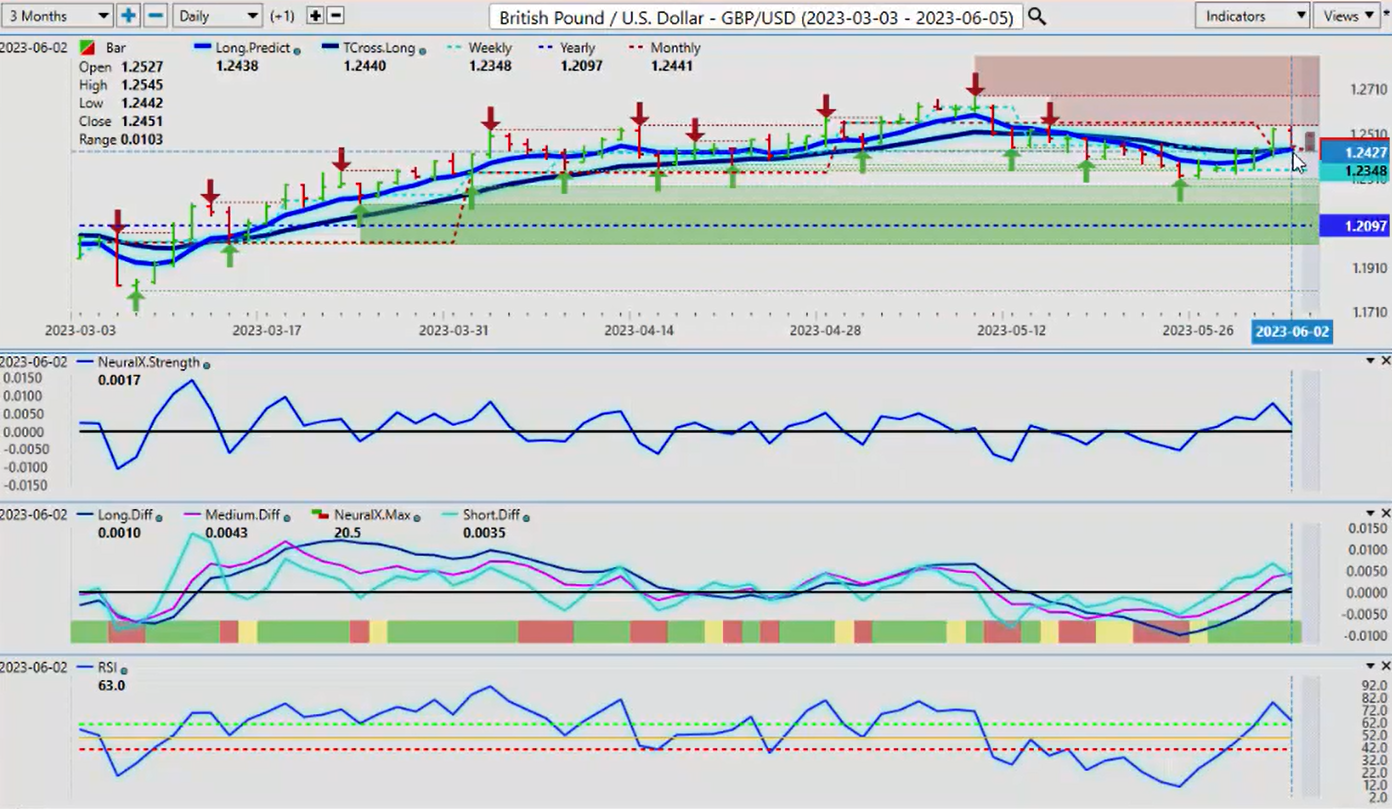
Now, the pound dollar, again, it remains positive on the year. If the dollar were to sell off as suggested here, if the dollar follows its normal pattern, then this could be a good place to be buying the pound dollar but we need to stay above 124.40, the VantagePoint T cross long. I would prefer that we stay above our monthly opening price also. That’s coming in at 124.41 also. So we’ve got a lot of support slash resistance right around this particular area. If we’re holding above 124.41 and the T cross long, we’re looking to buy this thing on a dip. So what I suspect they will do is flush out some stops, maybe Monday and Tuesday, and then Wednesday and Thursday we see the pound recovering. It’s just a question of how deep they’re going to try and push this to get those stops. So again, keep an eye on that particular area.
The indicators in VantagePoint or predicted differences are turning positive. We’ve got a short term crossover, a medium term crossover, and a long-term crossover has just taken place. So it certainly does look bullish for the pound. Now, when we look at one of the main pairs, again, US Canada is a Hess stock trade. It is a light sweet crude oil trade. And this is one of the reasons why, with my own direct clients and in the VantagePoint live training room, we’ve been focusing heavily on buying energy, buying oil, and ignoring the silliness over the last 20 days because it’s not relevant. We know that that debt ceiling was getting settled. We know there’s a 20 year seasonality that oil goes up between May and July. We know this, guys, so we can’t be misled by this or that. We need to focus on the prize here, which is making money.
U.S. Dollar versus Canadian Dollar
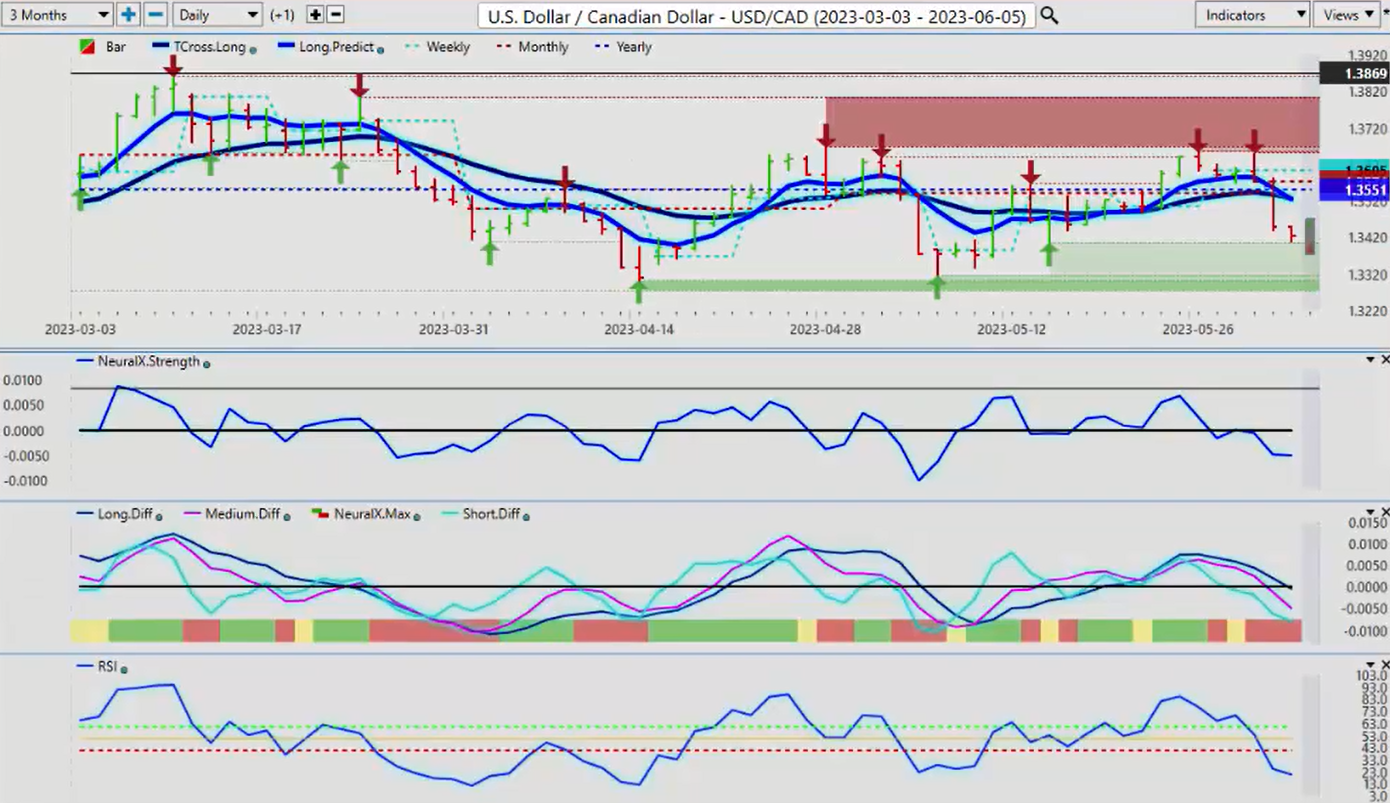
So US Canada has taken a big dropdown on oil recovering, oil stocks recovering, but we’re hitting a verified support low. So a little bit of caution here on this move down. That support low, that’s coming in at or about 134.05. So what I suspect is a significant upward bounce on Monday only, maybe Tuesday, and then we retrace back to our T cross long, 135.21. We have our yearly opening and our monthly opening price is coming in at 135.74, 135.51, so we know all of where our resistance is. So there’s two ways that this can be played next week. We wait for that retracement higher, which is what I prefer, or we play a breakout down below 134.05, which is a much higher risk. We would then target that low coming in around 133.15. I believe we can get to that by the end of the month or mid-month, 133.15, absolutely within their crosshairs. The indicators in VantagePoint, the short momentum is building. Neural index strength, predicted differences, another fresh crossover.
On the long-term crossover, this dark colored blue line, RSI is getting a little bit oversold here. But again, overbought and oversold is not a real thing, guys. What you’re doing is telling the market, when you say something is oversold, you’re saying, “Okay, stop going lower, turn around and go higher.” Mathematically, it doesn’t make a lot of sense. If oil is going to be gaining strength, stocks are going to be gaining strength that heavily favors three currencies, the Canadian, the Aussie, and the New Zealand, and indirectly, I would argue, even the Euro and the British pound. But for now, we’ve got our key levels that we need to watch. So when we look at the Aussie currency, we can see that the Aussie currency is recovering just like the Canadian dollar is. Higher stocks, higher commodities like oil responding so we’ve got an early signal here. We’ve crossed our T cross long on a Friday, but guys, how could we do that if the labor report was so good? The answer is, the labor report was not good, in my opinion, at all. There was nothing in that report that justifies the Fed.
If we look at the ISM numbers from last week, 46, that’s contraction, not expansion in an economy, right? So let’s not lose sight of this, and let’s take the media with a grain of salt here.
Australian Dollar versus U.S. Dollar
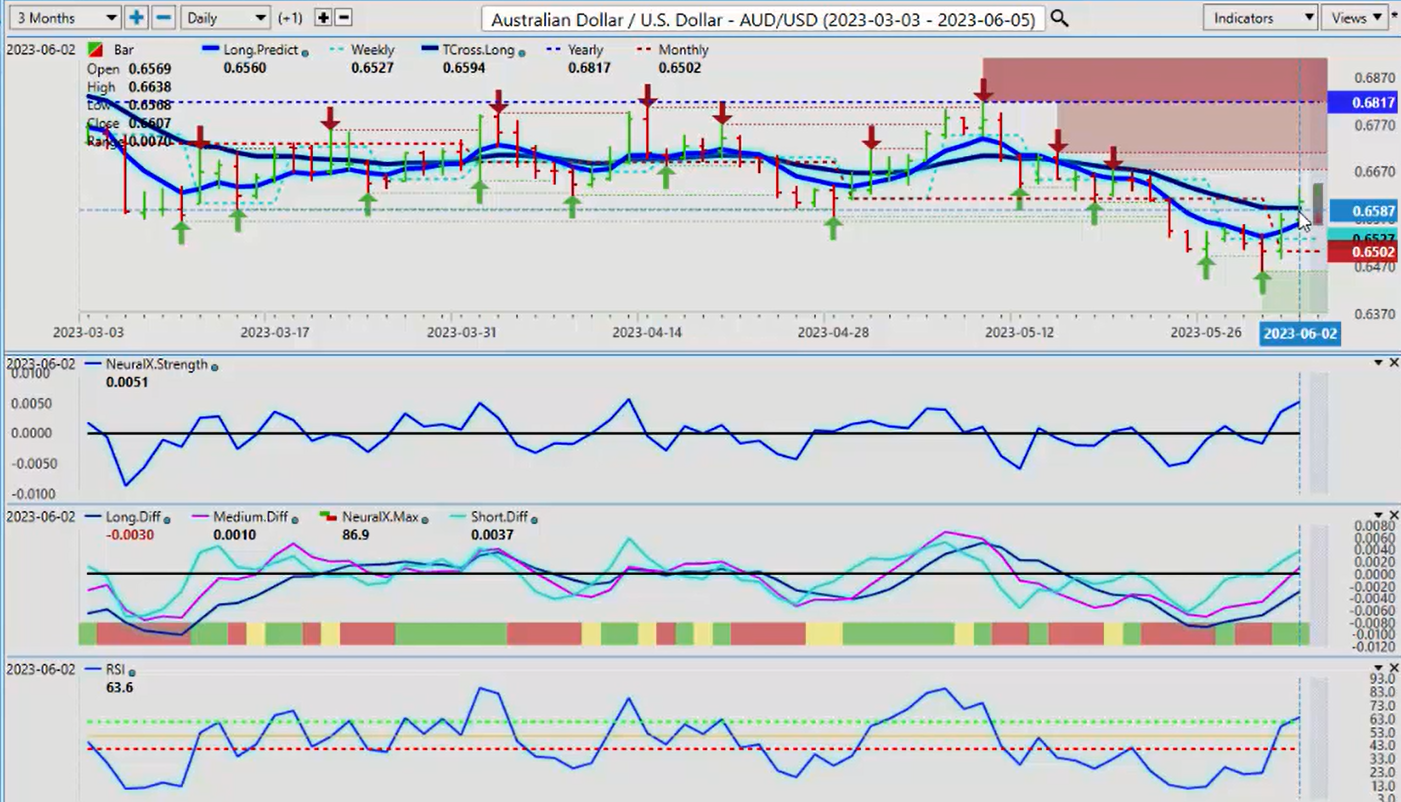
So we’ve crossed over that T cross long, 65.94. You can expect a pullback for sure, but we’ve got our monthly opening per coming at 65.05. We would be long while above this area. We are still down on the year, 68.17, but again, if the dollar is getting ready to make a longer term move down, then pairs like Aussie US or New Zealand US, even US CAD, they provide opportunity, but the Aussie is lagging the Canadian dollar here.
New Zealand versus U.S. Dollar
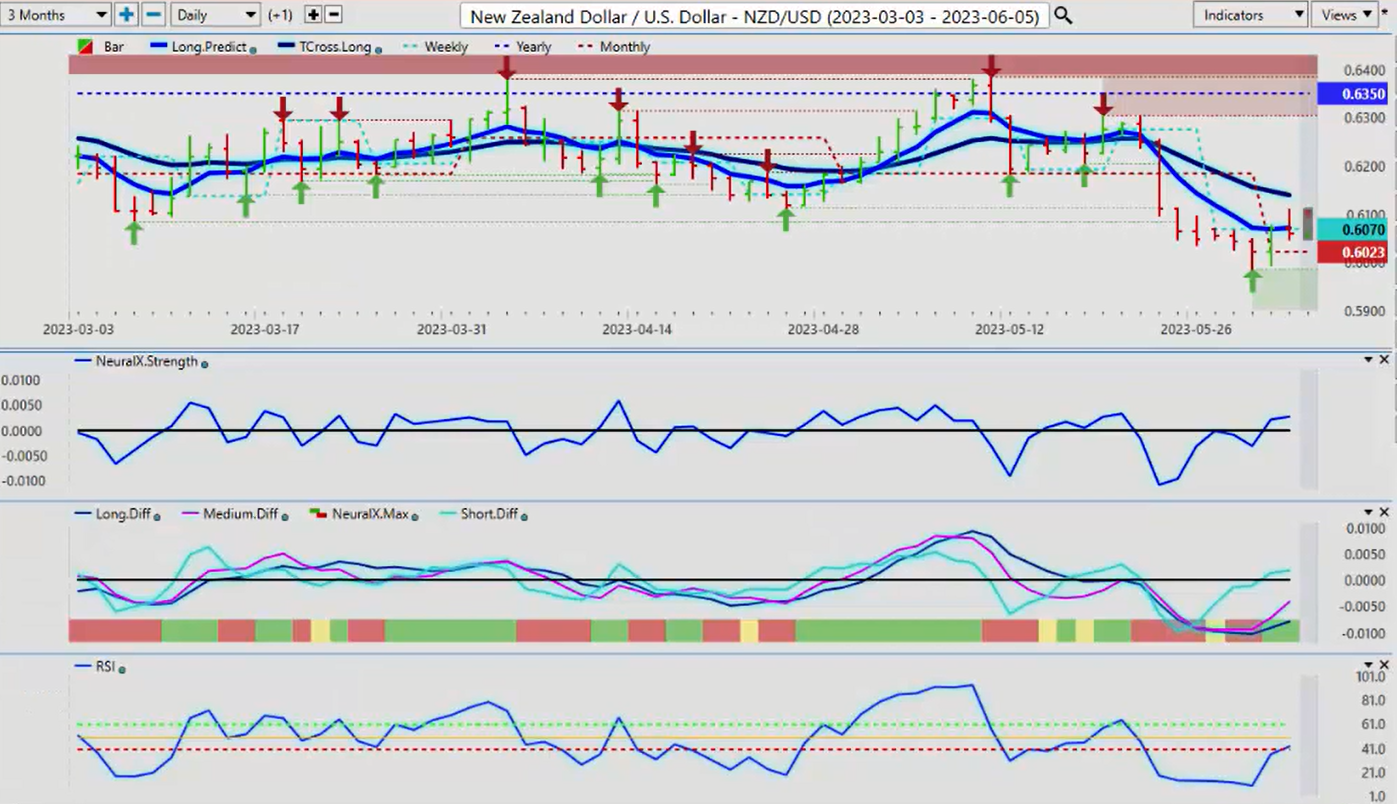
When we look at the Kiwi, the Kiwi, also, is lagging the Canadian dollar. So if the stocks can continue to push higher, then these are places of opportunity. When we look at the VantagePoint indicators on New Zealand, our neural index strength, our predicted differences are rising, our neural index is rising, our predicted RSI is rising. So it’s telling us we’ve got momentum.
So we simply use the monthly opening price and say, “Okay, I want to hold positive on the month of 2023, and I want to use that as a pivot level.” So you could say, “Okay, you know what, Greg? I think you’re wrong on just about all of this.” That’s fine, I’m cool with that. So then you would put your sell orders just below, about 30 pips below the monthly opening price, and once it’s confirmed it’s not going higher, then you can take the short side of this or you can straddle that area. But right now, I would argue, at the very least, we’re going to retrace to that all important T cross long at 61.39. So with that said, this is the VantagePoint AI Market Outlook for the week of June the 5th, 2023.