-
View Larger Image
Welcome to the Artificial Intelligence Outlook for Forex trading.
VIDEO TRANSCRIPT
Hello, everyone. Welcome back. My name is Greg Firman and this is the VantagePoint AI Market Outlook for the week of June the 12th, 2023.
SPDR SPY ETF ($SPY)
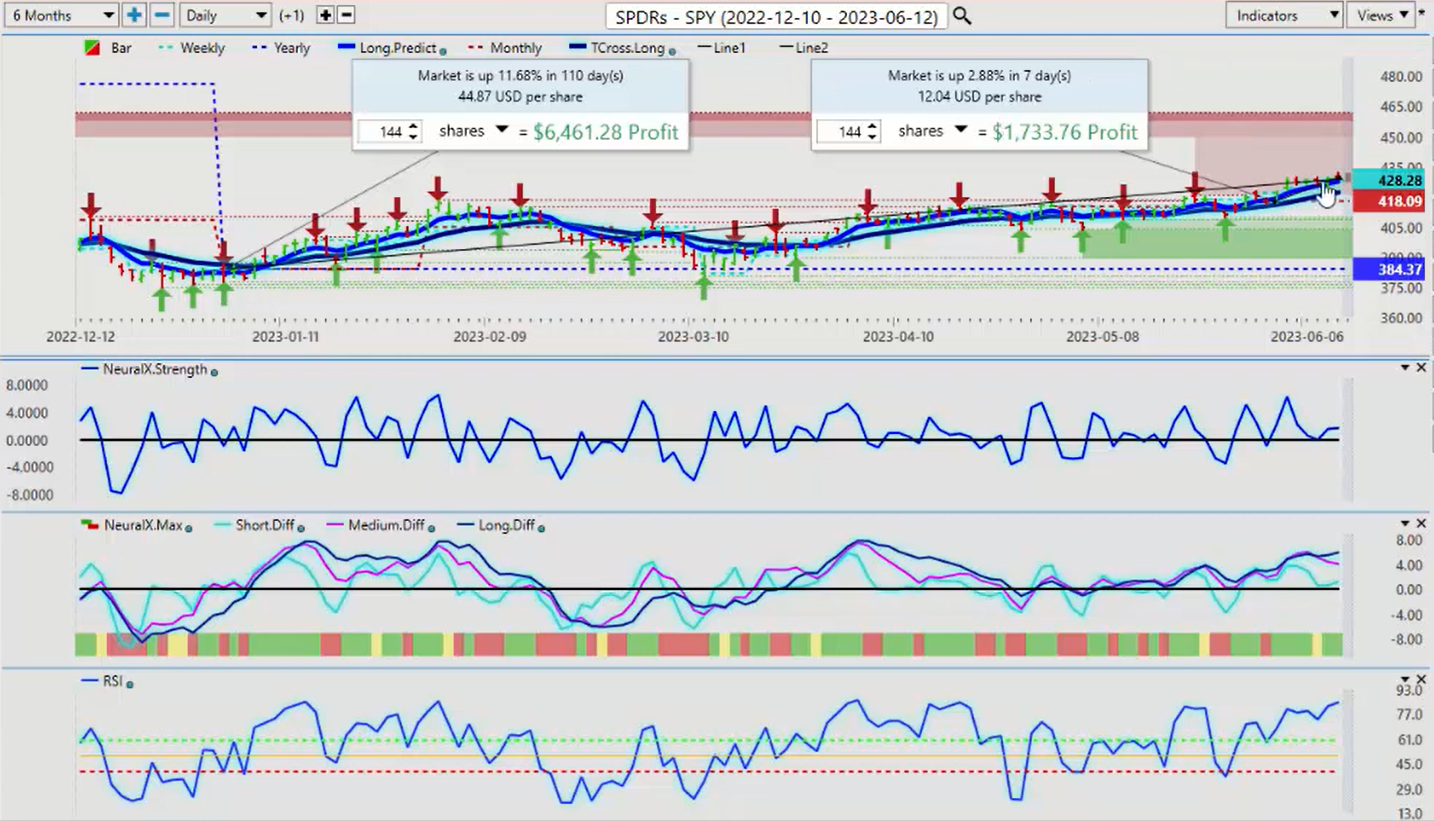
Now to get started this week, we’ll take a look at the broader market so we can get an accurate look at how things are going so far in 2023 and also in the month of June. So we can see right now that the SPY ETF is up 11.68% in the calendar year, and in the beginning of June 1st until to approximately June the 9th, we’re looking at about a 2.88% rise. So what we look at here is accurate measurement points of true performance in 2023. We don’t want to go back 365 days to last June unless we’re using seasonal tools because, again, that can be very misleading in price and it’s a lagging indicator. So right now, the SPYs are doing relatively well in the year and in the month.
However, we do have an MA diff cross that is moving lower, suggesting that this particular move is starting to weaken here. Now our predicted RSI is sitting at 82.3, which is not horrible, but it’s not good either. So we look for the core VantagePoint indicators to hold. Now our T-Cross long, when we look at this a little bit closer, our main support level we’re going to be using here is of course the monthly opening price in the T-Cross long. The monthly opening price is 418. Our T-Cross long is 421. The SPYs will only remain positive if we can hold above these particular levels, but we’ve got a warning sign of a potential corrective move lower.
U.S. Dollar Index
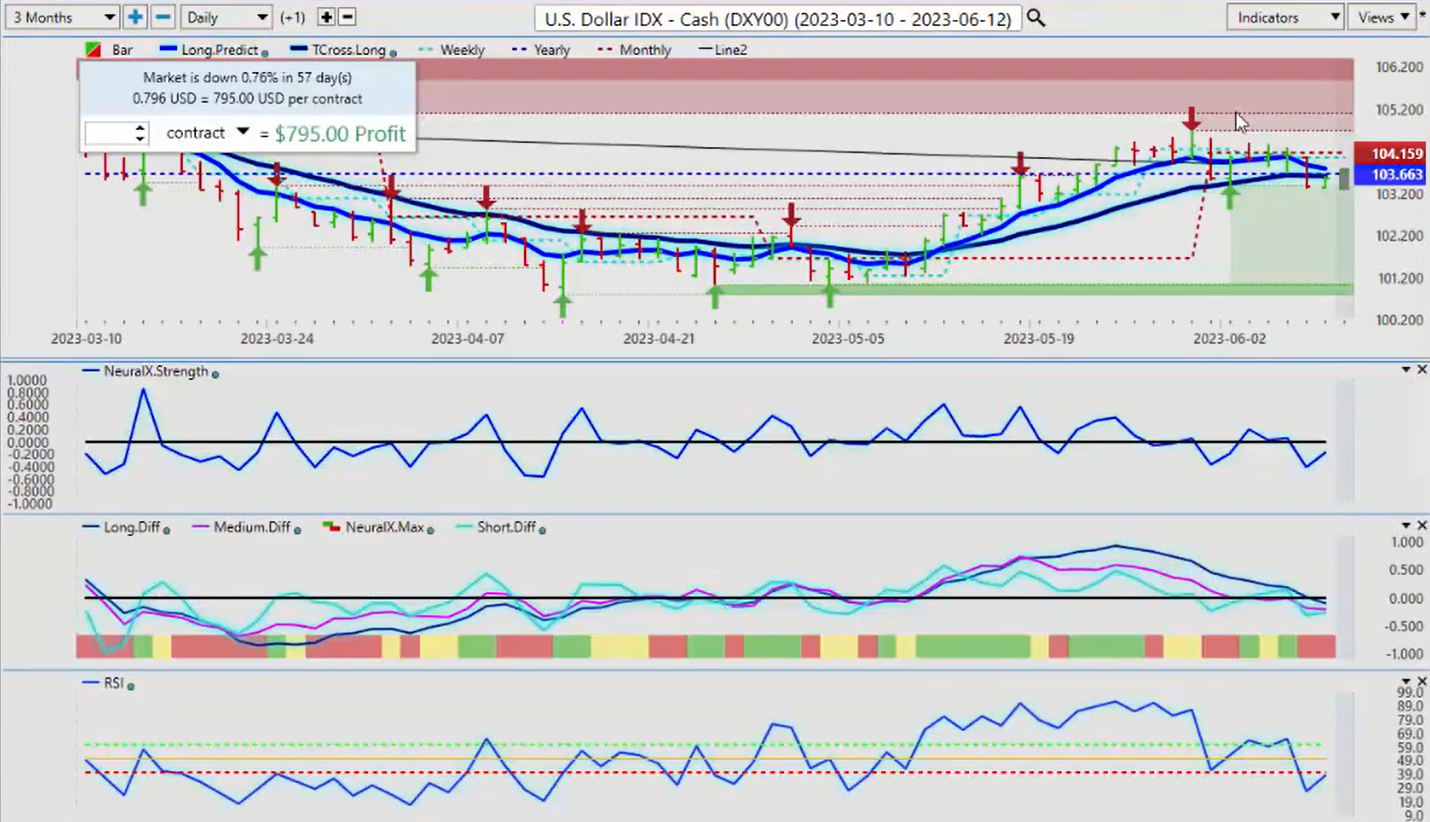
Now, when we look at the dollar from this past trading week, we discussed this at length each month about this dollar cycle that I’ve advised you guys on, and what the dollar cycle is, is basically a period of known dollar strength and weakness.
Now the dollar is normally quite strong going into the payroll number. Then as I said in last week’s weekly outlook, what I’ve seen very often over the last 20 some odd years is that the dollar mysteriously sells off just after that. So when we look at this past calendar week, when we go back our five days here, we can assess very clearly that there was little to no dollar strength last week. So we would look in our main Forex pairs here based around this known cycle in the dollar to basically look for places of value to short the dollar. Buying Euro US, buying pound dollars, selling US CAD, buying AUS US. This is the main thing. Now, when this dollar cycle occurs, usually that gives a boost to the equity markets and gold prices. So when we look at the dollar right now, you can see using the weekly and the monthly opening price as a guideline, we want to use those to validate the VantagePoint signals.
So in this particular case, the predicted differences were rising rate or were falling rate off the bat at the beginning of the week. We push above the monthly opening price, but we’ve never closed above it. We come down on Wednesday, test our T-Cross long only to rise on Thursday and then break. We’ve moved lower again on Friday. Very, very close here when we look at our T-Cross long, 103.59 and we’re closing out the week 103.55. So basically what we would look for next week is again, can we maintain this momentum below the VantagePoint T-Cross long, but more specifically below the monthly opening price. So again, the signals and vantage point, we’ve got a short, medium, and long term crossover to the downside now.
The neural index is down, but again, that reverse check mark in the predicted RSI saying there’s not a lot of downward momentum here. So what I would like to see is an additional break of this low sitting down here about the 103.25, 103.30 area. If we can break down below that, then that should signal a longer period of dollar weakness. But we do need to be cautious next week. We’ve got several central banks, Australia and the Bank of Canada hiking this past week unexpectedly. So we can’t rule out another hike from the Fed. But what we do need to understand is that we’re nearing the end of these rate hikes, not at the beginning of it. So the dollar is not going to see the same kind of strength that it did in 2022, and that’s yet another reason why we don’t want to use rolling performance, go back 360 days from today because it’s not really relevant.
Guys, we need to stay relevant. The dollar has not had a good year. It’s been below its yearly opening price the bulk of the year, and that’s what we would focus on is current price. It’s very much like using a predicted moving average versus a simple moving average. That’s a very good analogy when you’re looking at rolling performance versus performance based on the start of the week, the start of the month, and the start of the year.
Gold
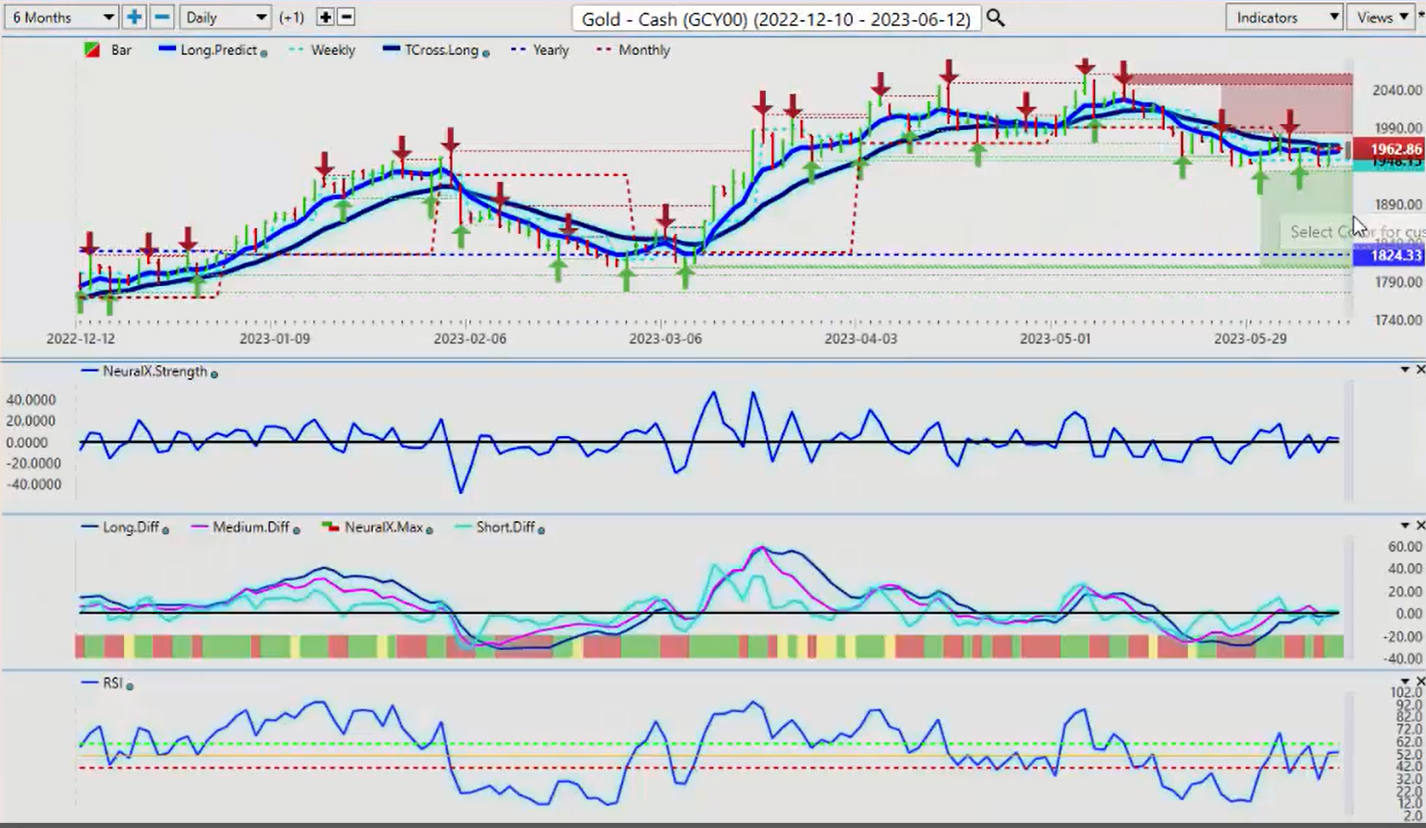
Now, when we look at gold prices for next week, once again with that Fed likely going to hike, our indicators right now on gold are very mixed. We’re sitting right on… The predicted differences are sitting on the zero line, predicted RSI sitting at 50. This is very often how things look going into a Fed week. We’ve got pretty solid support down here at 1938.
I would imagine that’s going to be challenged here, 1932 probably at the beginning of the week because again, we are in Fed Week. We could see some gold weakness prior to the announcement, but the longer term view on gold would still remain moderately bullish. Now, our monthly opening price here, 1962, we’re closing pretty much right on that particular level, but we need to get moving. But the good thing is on this past week, our weekly opening price of 1948, we’ve pretty much held above that most of the week, but very, very choppy trade. Our T-Cross long 1966, we get a sustained break of that. Then we should be able to start making a push back towards that 2000 mark, but it’s going to be dependent on what the Fed’s statement is this coming week. So again, watch that very closely.
S&P 500 Index
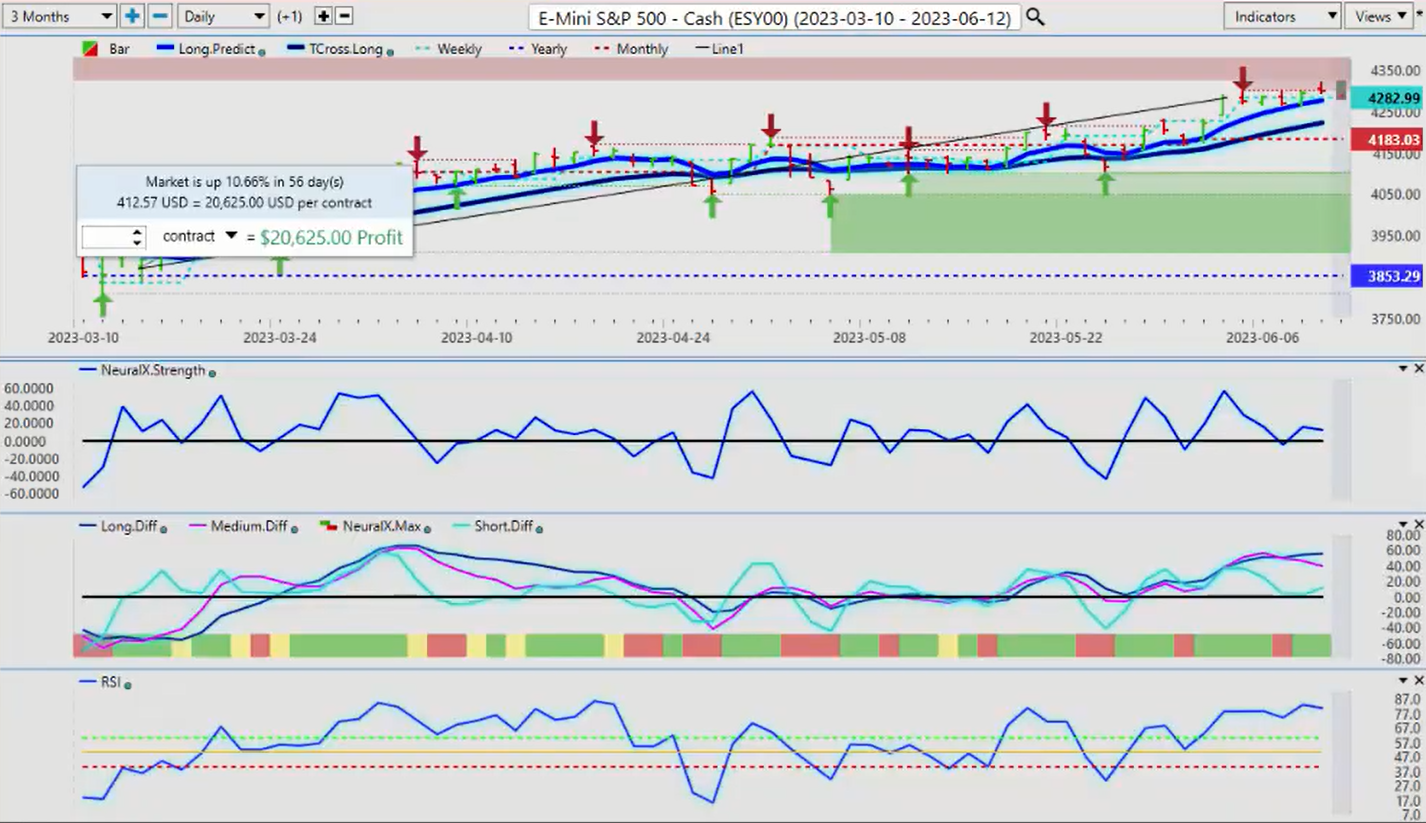
Now the S&P 500 mirrors the SPY ETF. So again, we can see that we’re getting a little bit toppy up here. I would imagine we’re going to have a few problems with equities next week because of the Fed. But right now the indicators in VantagePoint are warning us of a move lower in stocks, this pink line crossing the blue line. Once the neural index comes on board, we get a falling RSI and we break down below our long predicted at 4275. I believe stocks will come under selling pressure in the days ahead, but they’re also likely to recover towards the end of this month.
Light Sweet Crude Oil
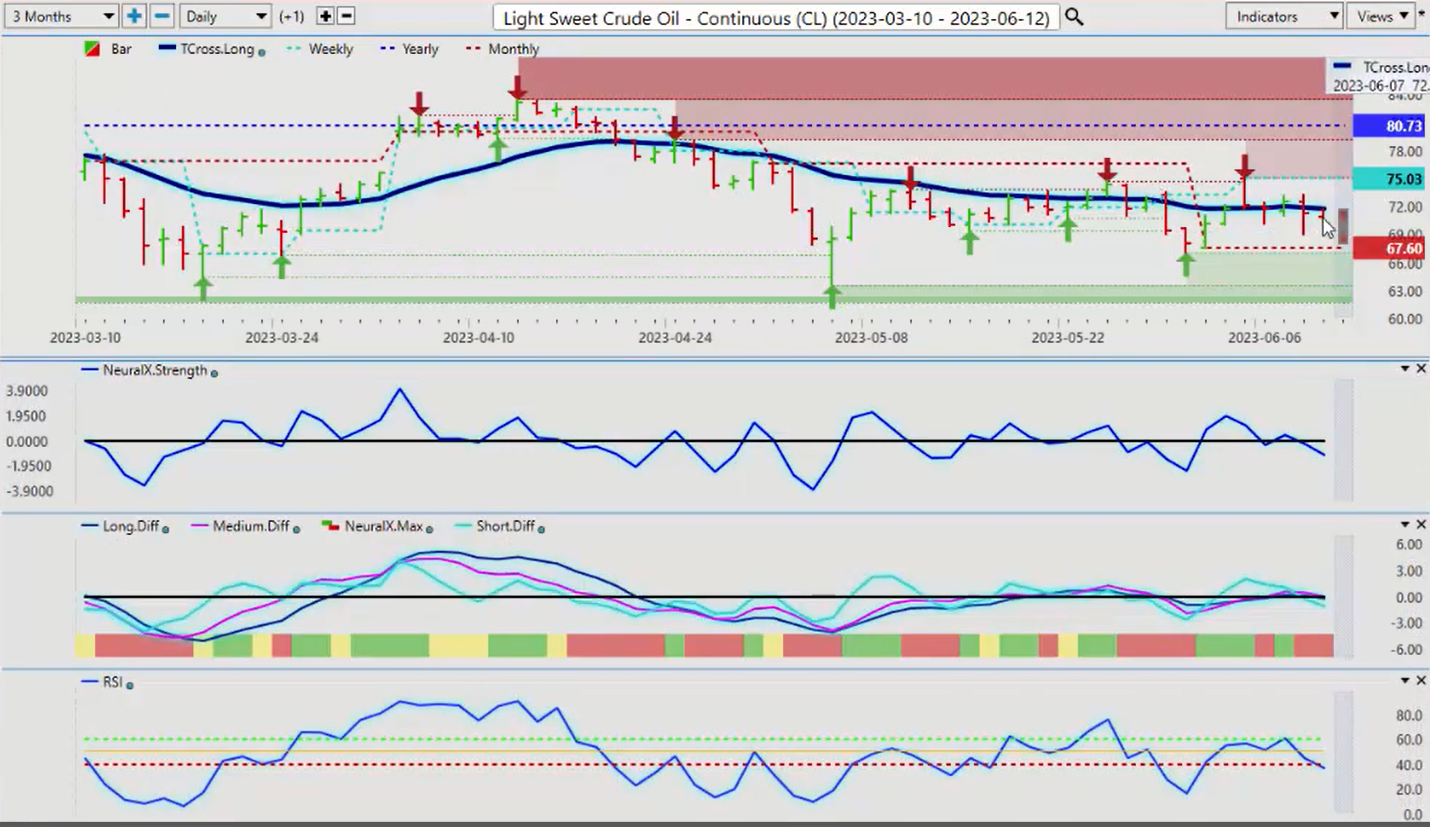
Now when we look at light sweet crude oil, we talked about this one in last week’s presentation. Again, we’ve got some choppy, choppy trade with oil prices. But going back and forth, we’re holding above. June has been a good month for oil contracts, our monthly opening price coming in at 67.60.
We would remain long while above this, but we would expect a little bit more downside. My concern is the US labor report was not good. We’ve got an inverted yield curve. We’ve got ISM numbers showing contraction, not expansion. Wage deflation. So it does paint the picture for a recession, which could be a negative for oil. But again, in most cases the seasonal pattern, the strengthened oil doesn’t end until about mid-July. So look for a break of our T-Cross long above 71.75 for the potential for more longs. Keeping in mind that we still do have a problem here with a potential recession.
Bitcoin
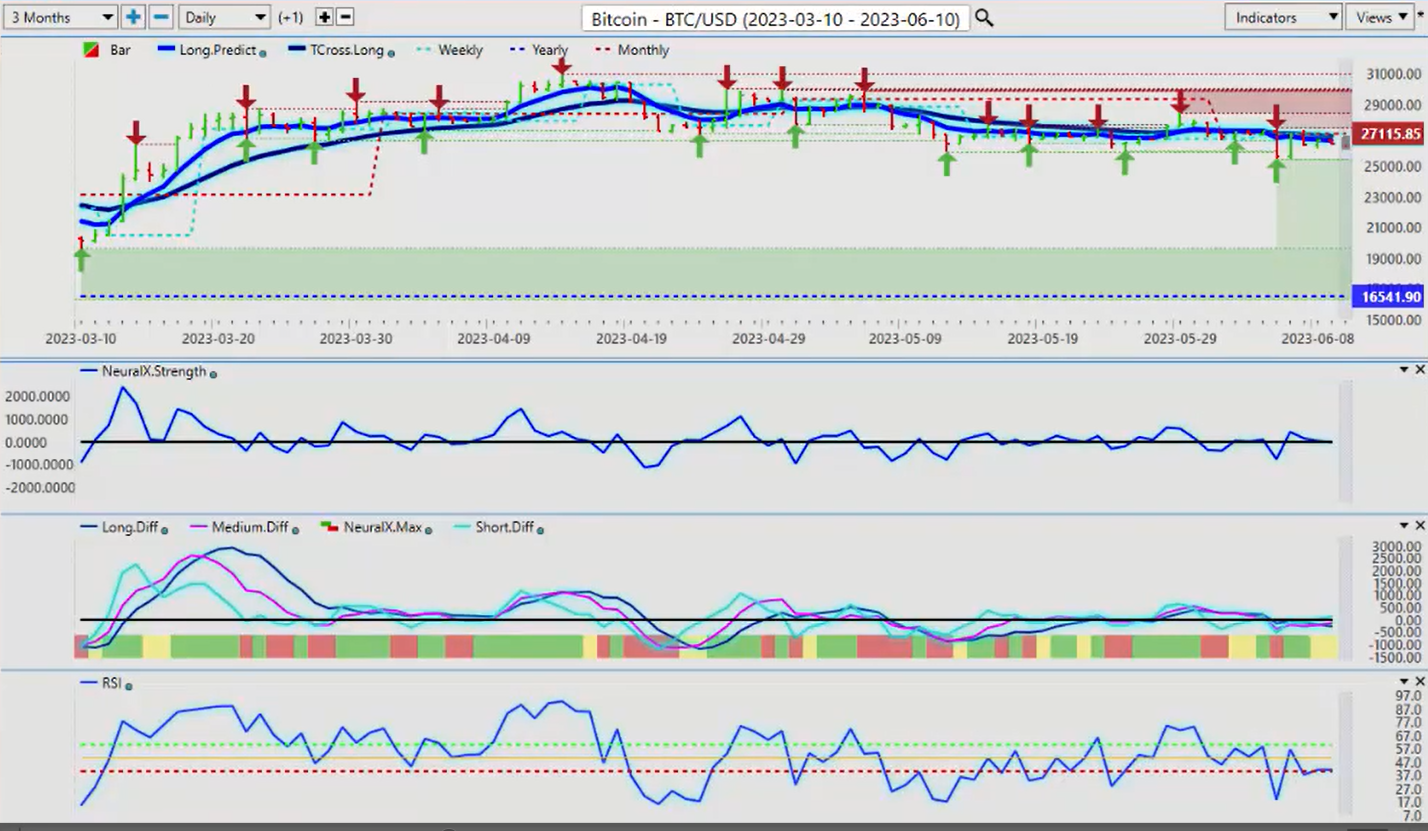
Now Bitcoin pretty much going sideways. I can give everybody kind of a bit of a heads-up just for now is that usually Bitcoin sees its rise towards the end of June, the beginning of July, where it starts to make its move. So we should expect some downside to come into play here. But what I would look for is this area, this low down around 25,400 to hold. This is not just about Bitcoin versus the US dollar guys. Bitcoin, you’ve got a number of Bitcoin blockchain based stocks out there that is very similar to the way stocks react to the S&P 500. So look for some of those Bitcoin stocks. There’s numerous stocks out there. If Bitcoin’s doing well, then those blockchain stocks are going to be doing well. In future presentations or the VantagePoint live training room, we work on this on a regular weekly basis. Very, very important.
The indicators here, pretty much neutral to slightly negative, but you can see that there’s a very small buy signal forming there. But again, not a very strong one.
Euro versus U.S. Dollar
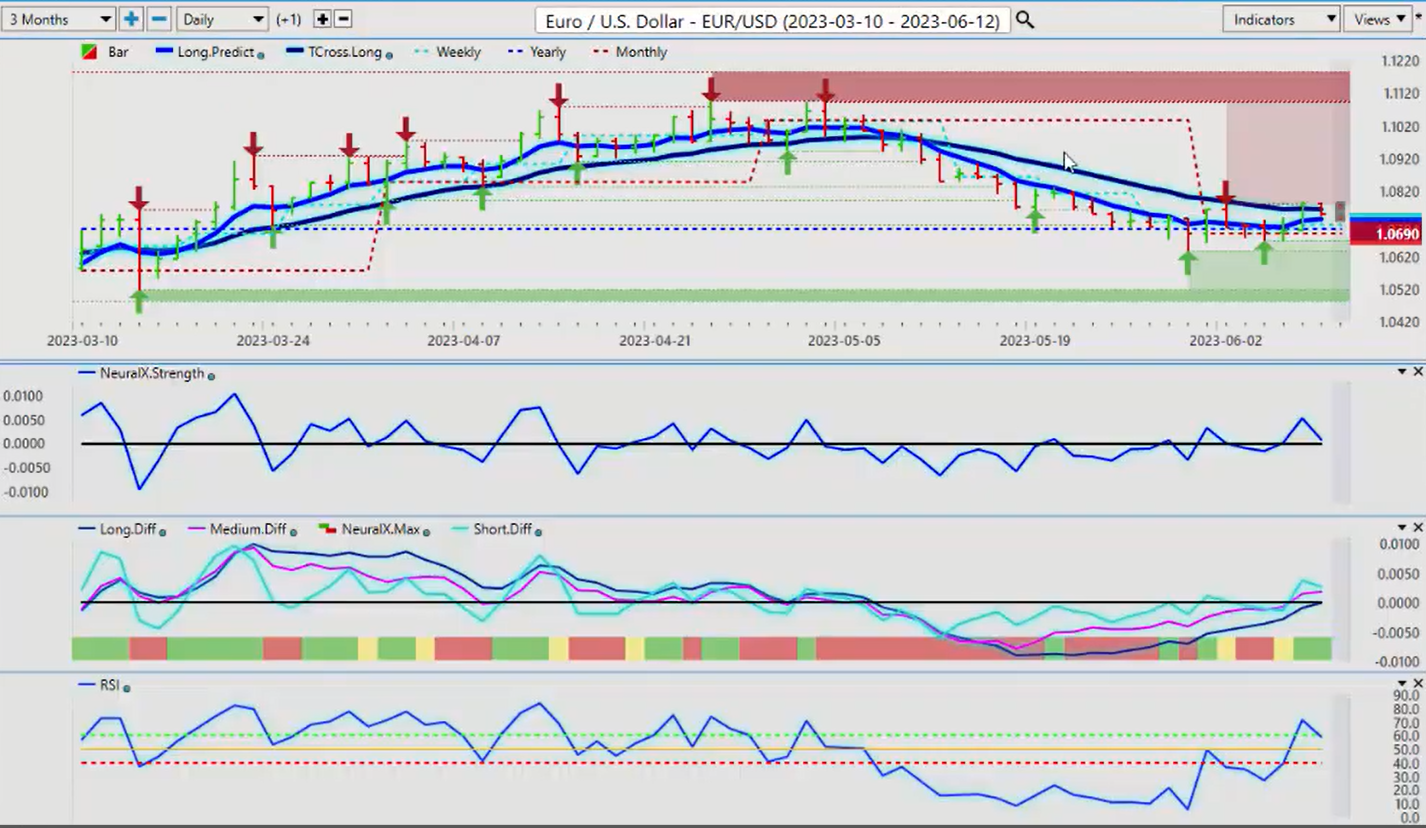
Now, when we look at the main Forex pairs here, pretty decent trading this past week. The Euro was probably one of the easier trades, but again, that’s based around that dollar cycle. If the dollar is going lower, Euro US has to go higher regardless of the technicals, the fundamentals, all these different things. Obviously again, this month didn’t matter. Where everybody was bullish on the dollar, they got caught on the long side. So be careful.
Now even with the Euro, we must break through this T-Cross long and stay above it. 107.63, we use our weekly and our monthly opening price and our yearly opening price as leverage, and you can see that basically by Wednesday, which I had talked about in last week’s Forex weekly outlook about this dollar cycle that expect the dollar to reverse Tuesday or Wednesday. That’s exactly what we saw. But this is a monthly occurrence, guys, not in August and not in December, but most of those other months it’s 80% of the time. This is what happens.
So again, the Euro needs to get moving here. We’ve got some verified resistance also that coming in at 107.79, if we can take out 107.79 guys, that opens the door back towards the 111 area. The indicators from VantagePoint are positive. Here are predicted differences, but again, a reverse check mark here on the predicted RSI and on the neural index strength. So again, we know the exact line here in the sand, 107. Again, this area, this resistance high about 107.79, excuse me, that’s the level we need to break.
U.S. Dollar versus Swiss Franc
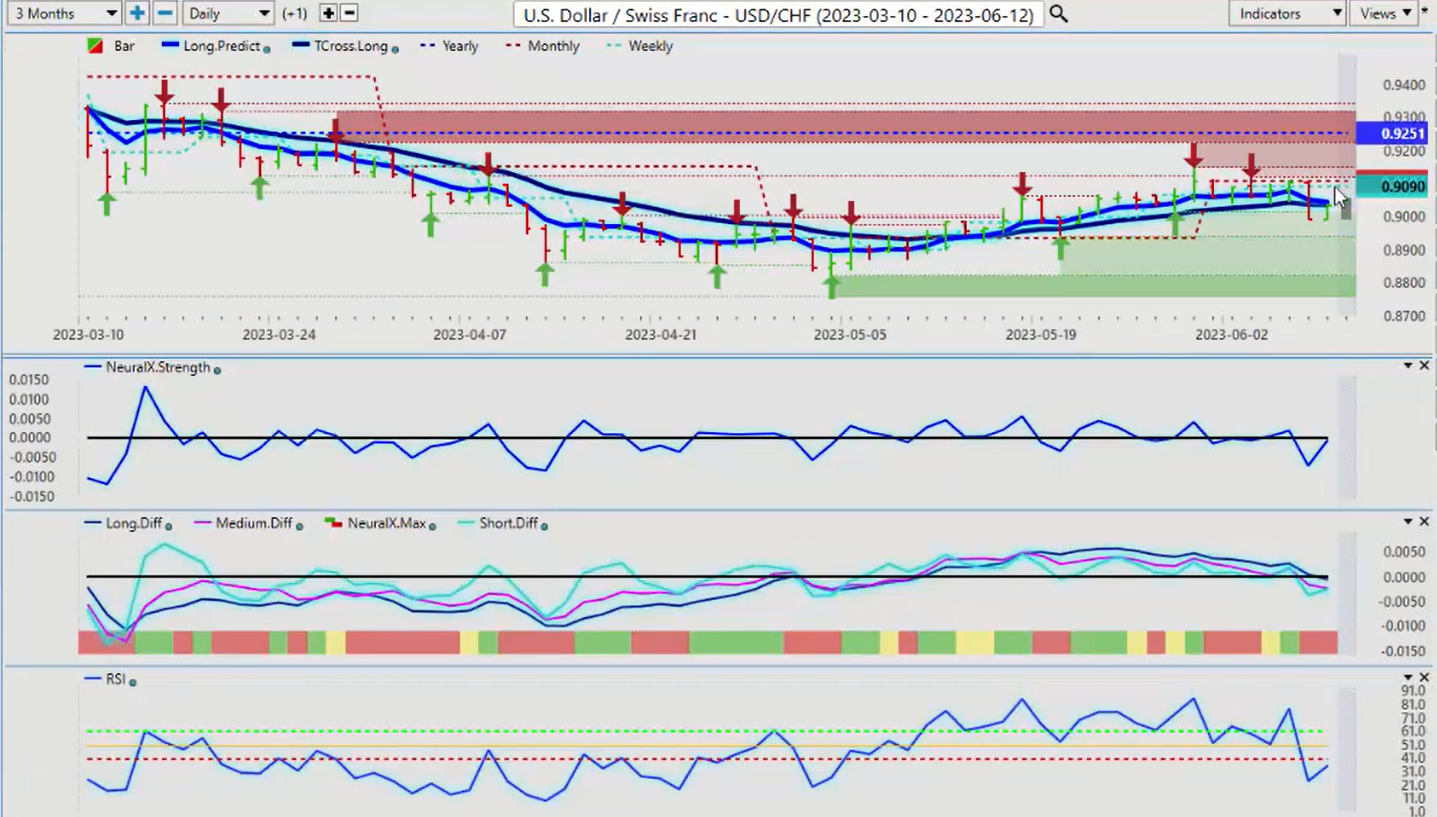
Now, the US Swiss Franc, again, when we look at real interest rates or we look at even previous interest rates, the last time the US was at 5%, I believe the Swiss National Bank was around 3%. So now the US is back almost at five, but the Swiss National Bank is only at 1.5% on their rates, but at the same time, the US dollar index is showing a 40% depreciation against the Swiss Franc because back in 05 and 06 when those rates were there, the US Swiss Franc pair was trading between 120 and 140. So significant depreciation is seen here in the dollar. And even during this period, as we can see, this is basically a daily trade, using that monthly opening price and saying, okay, we’re in a period of known dollar weakness after the non-farm payroll number.
Every time the market comes up to the monthly opening price, we just hit the sell button if it breaks. But this trend is starting to gain some momentum here. The yearly opening price, 92.51, the monthly opening price, 91.07, those are two resistance points. If you believe that this pair will go higher, my recommendation would be put your first buy order would have to be above the monthly opening price, your secondary buy order above the yearly.
But we need the VantagePoint indicators to confirm that. And at the current time, they are not. The short, medium, and long-term crossovers have all taken place and you can see we are moving lower yet again.
British Pound versus U.S. Dollar
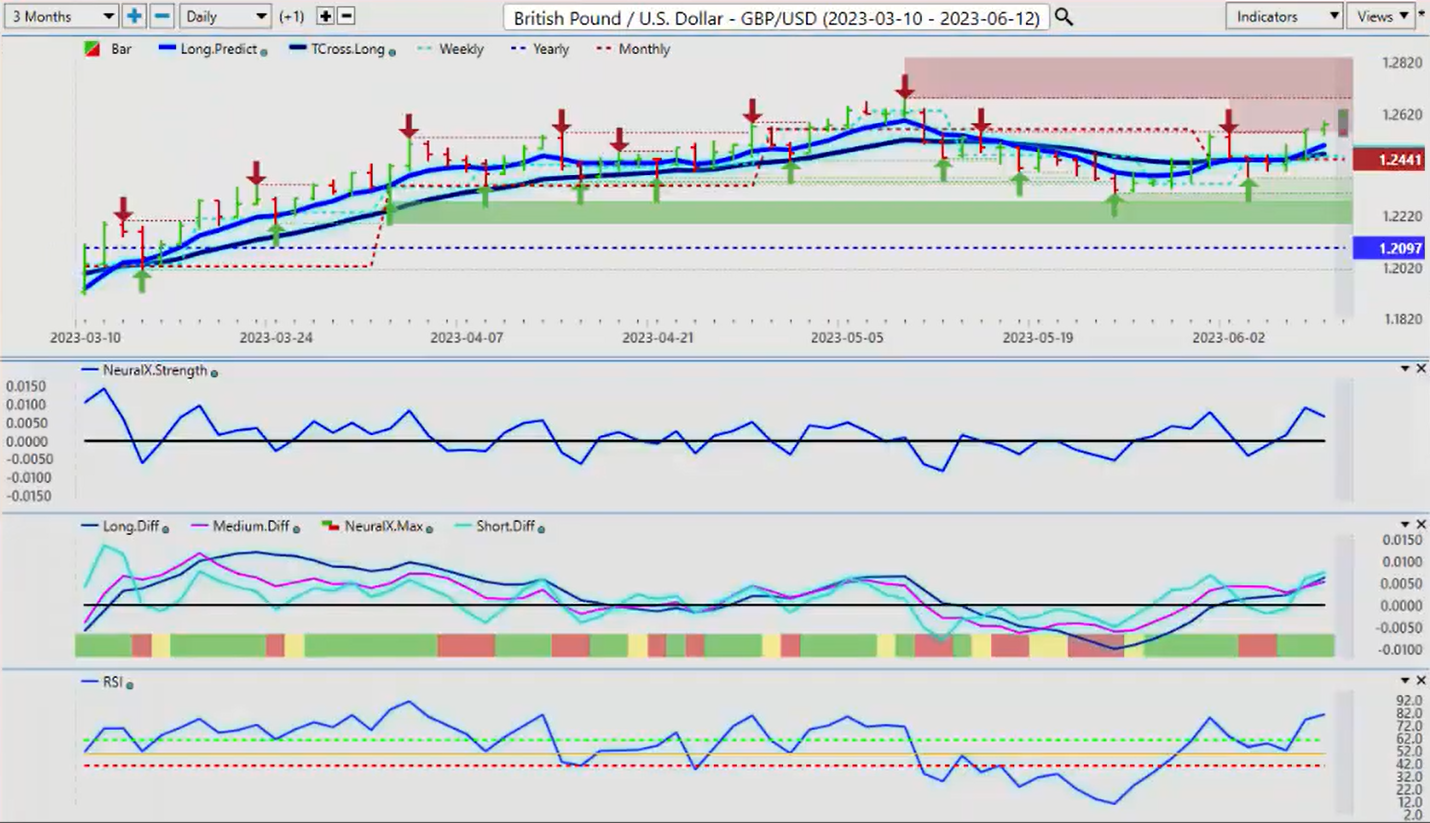
The British pound this week, again, another place to simply sell dollars based on that dollar cycle. We can see by Wednesday the pound is fully recovering, breaking through that verified resistance high at 125.61. The question is how much momentum do we have here? The indicators from VantagePoint, a little bit mixed. Our predicted differences are looking good, but this will depend on what the Fed does next week. Very important that we monitor that activity because again, I think it would be safe to say that these central banks are literally talking out of both sides of their mouth, flip-flopping back and forth, be very, very cautious around that.
It’s something we have very little control over, so monitor that. But for now, we stay long while above 124.41. We’re at the yearly opening price, 120.97, the weekly opening price 125.54, also an excellent area to be buying this off last week.
U.S. Dollars versus Japanese Yen
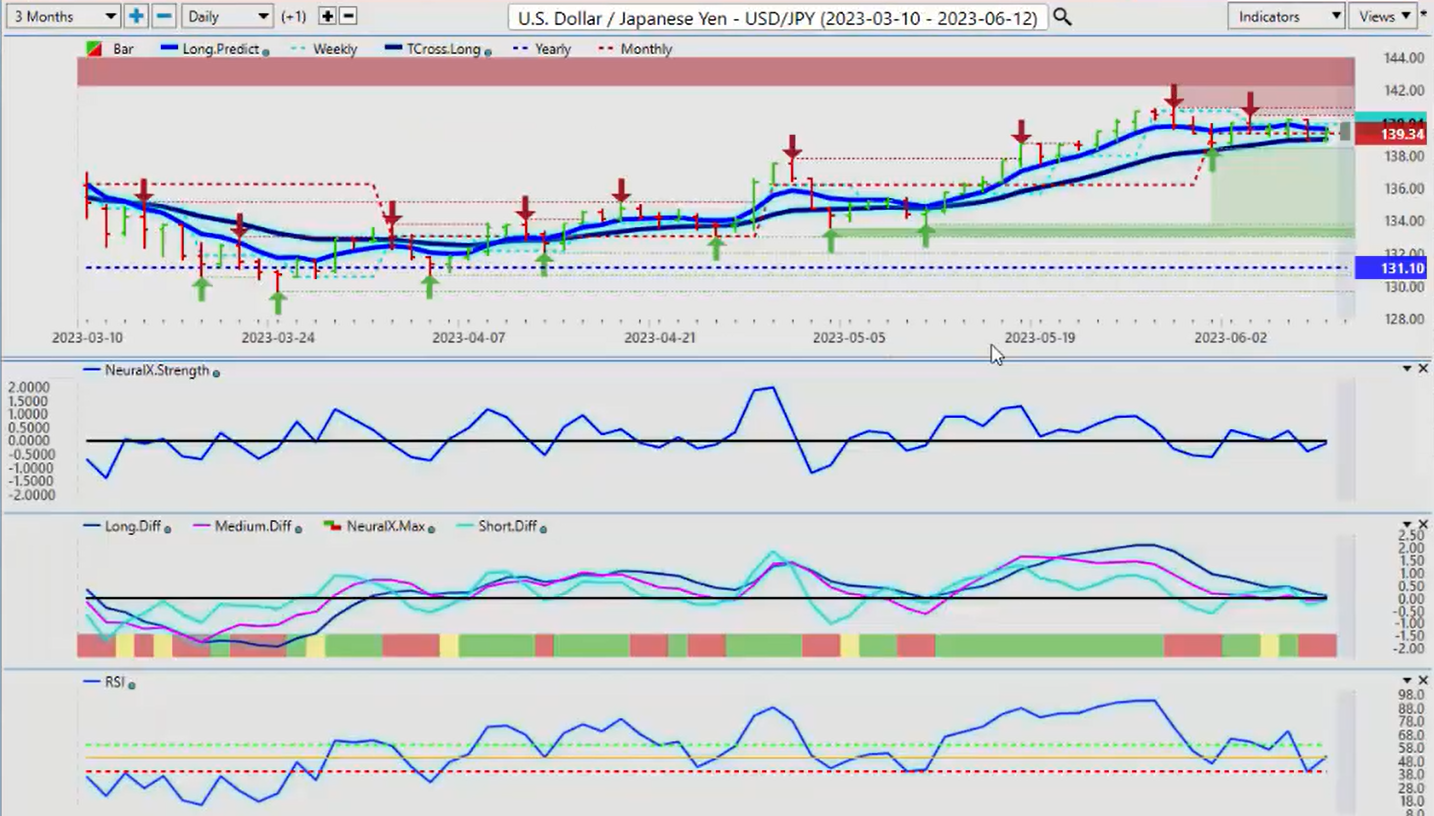
Now, when we look at the dollar yen, the one place the dollar has fared very well is because of interest rates, the negative interest rates in the yen. But even here you can see that the dollar did not make a lot of gains against the yen. When we look at it a little closer, it actually lost ground by the end of the week. But the value here from VantagePoint, giving us that T-Cross long, you can see that that is what’s containing this. So that T-Cross long, 138.98, if stocks move lower, the dollar starts to show additional weakness.
We don’t get a hawkish fed. Then you could see this breakdown. So watch this pair very closely. But again, this reverse check mark on that predicted RSI using a 60/40 split on the predicted RSI and a nine period predicted RSI instead of a 14. Then basically it really brings this indicator into play because we’re not looking for overbought or oversold. Again, that was an effective tool in 1970, but not so much in 2023. We’re looking to gauge momentum. So this reverse check mark just told me we’re losing that momentum on the downside and be careful, and then I match that to the T-Cross long at 138.93. So again, be very, very cautious. But for the more savvy trader, if you believe that this like me, that this will ultimately be going lower, then you would put your sell orders just below the T-Cross long 138.98.
So 138.70 or so, and then when it breaks down below that, we’re sitting there waiting for it.
U.S. Dollar versus Canadian Dollar
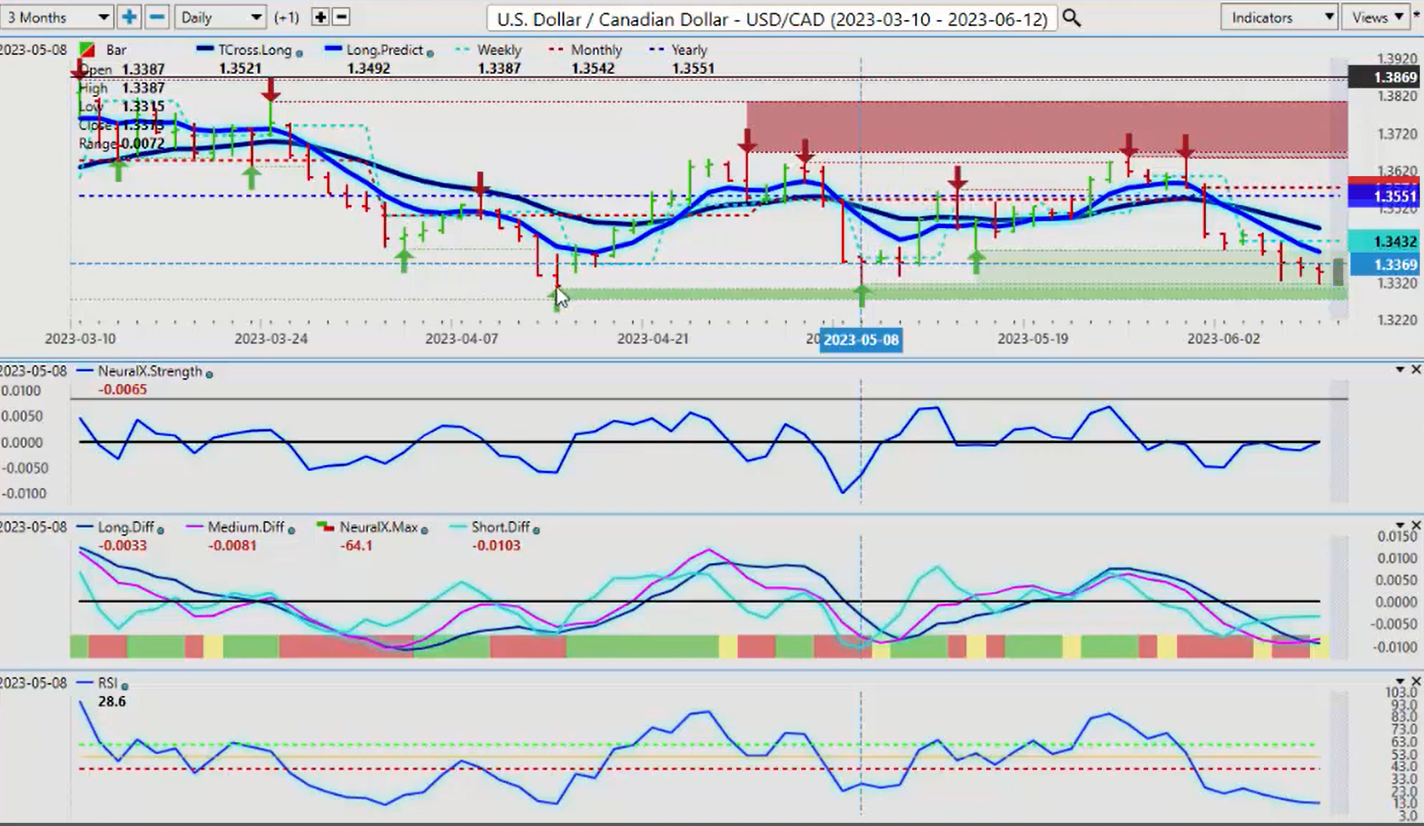
Now with our main commodities/equity based currencies, little shocked that the Bank of Canada hiked here because if anybody saw the unemployment numbers out of Canada on Friday, they certainly do not support a rate hike. Once again, I think that the central banks are going to have to move their inflation targets. You’re not getting down to 2% anytime soon, no matter how much you hike. So again, US Canada is coming down to a verified support low that coming at 133.02. There is a very strong possibility that this level is going to hold and US Canada is going to reverse at the very minimum back to the vantage point T-Cross long at 134.65. If we can’t get stocks moving higher and oil moving higher, then this pair is going to reverse back up even if the dollar index moves lower.
So watch it very closely because right now on a Saturday, this presentation again is an outlook, not a recap of something that’s already happened. Guys, there’s a buy signal there forming heavily oversold 12.9 on the predicted RSI. Now, I will point out again, just because something’s oversold doesn’t mean its going to go higher, but when we combine the VantagePoint neural index, the neural index strength, and the medium term crossing, the long-term predicted difference, this points to potentially a very significant reversal on this pair to start the week next week. So watch that one on Monday very closely. I could even go as far as to argue that US Canada, we’ve closed the week at approximately 133.48 I think. We may not move much below that, guys. It may just simply go straight back up. So watch for opportunity there also.
Australian Dollar versus U.S. Dollar
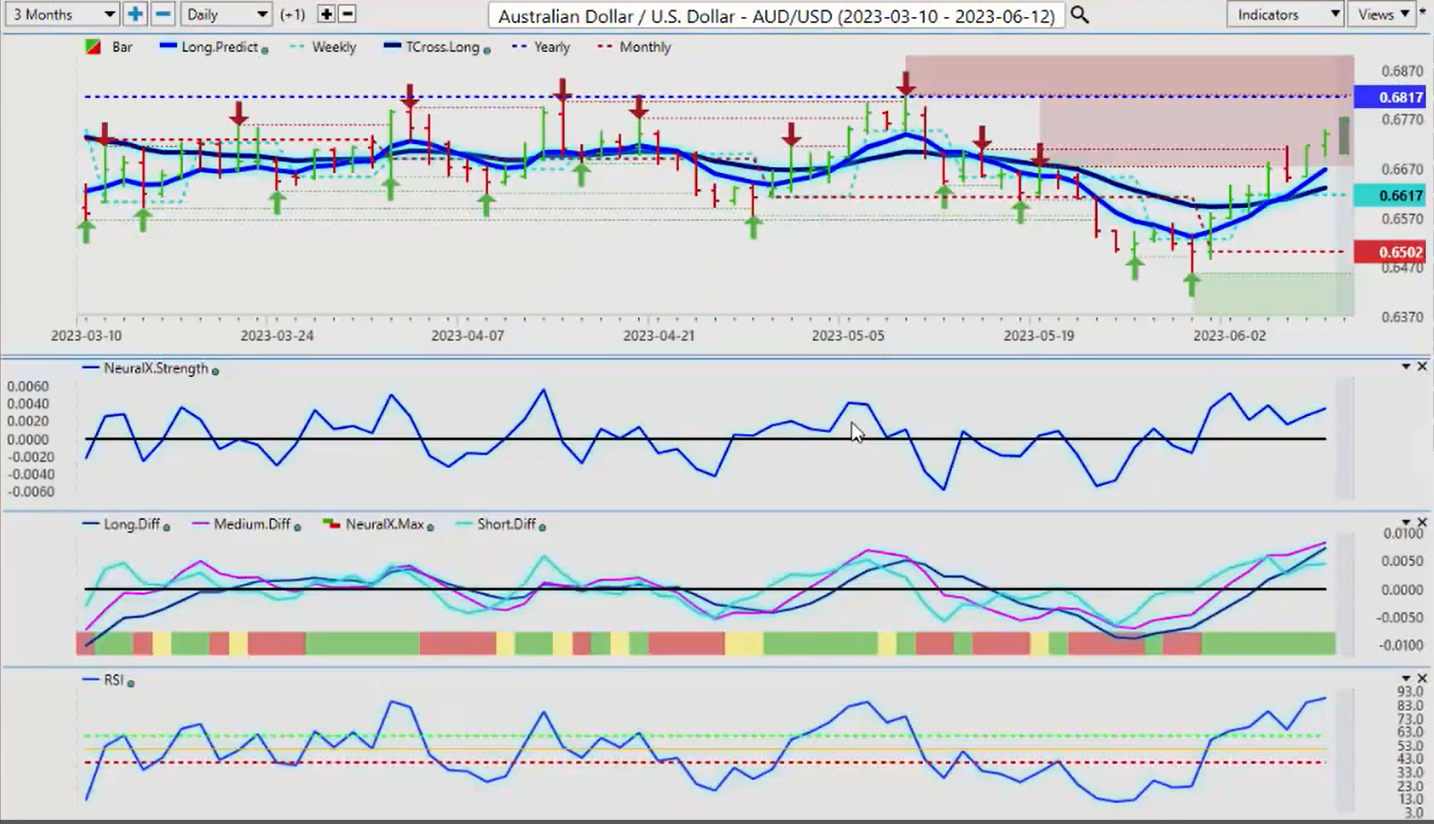
Now, when we look at our additional two equity-based currencies, the Aussie and the Kiwi, the Aussie’s the clear winner here, but again, we’re still negative on the year.
That somewhat of a surprise hike from the Bank of Australia also. Once again, I think globally these central banks are going to have to rethink what they’re doing because clearly it’s not working. So again, if stocks start to tank, we could see the Aussie reverse back down to the T-Cross long. But this is a very similar trade to US Canada. US Canada goes up, the probability that Aussie US goes lower is very, very high. So use US Canada, the intermarket correlation to gauge this, that T-Cross long 66.31, a very strong possibility we could be retracing back to that as the indicators become… We’re a little bit overdone. So a corrective move, if nothing else to the long predicted at 66.70 is in the cards to say the least to begin the week. We look at the Kiwi. The Kiwi is not faired as well, nearly as well, and this is because of the Aussie New Zealand cross pair.
New Zealand versus U.S. Dollar
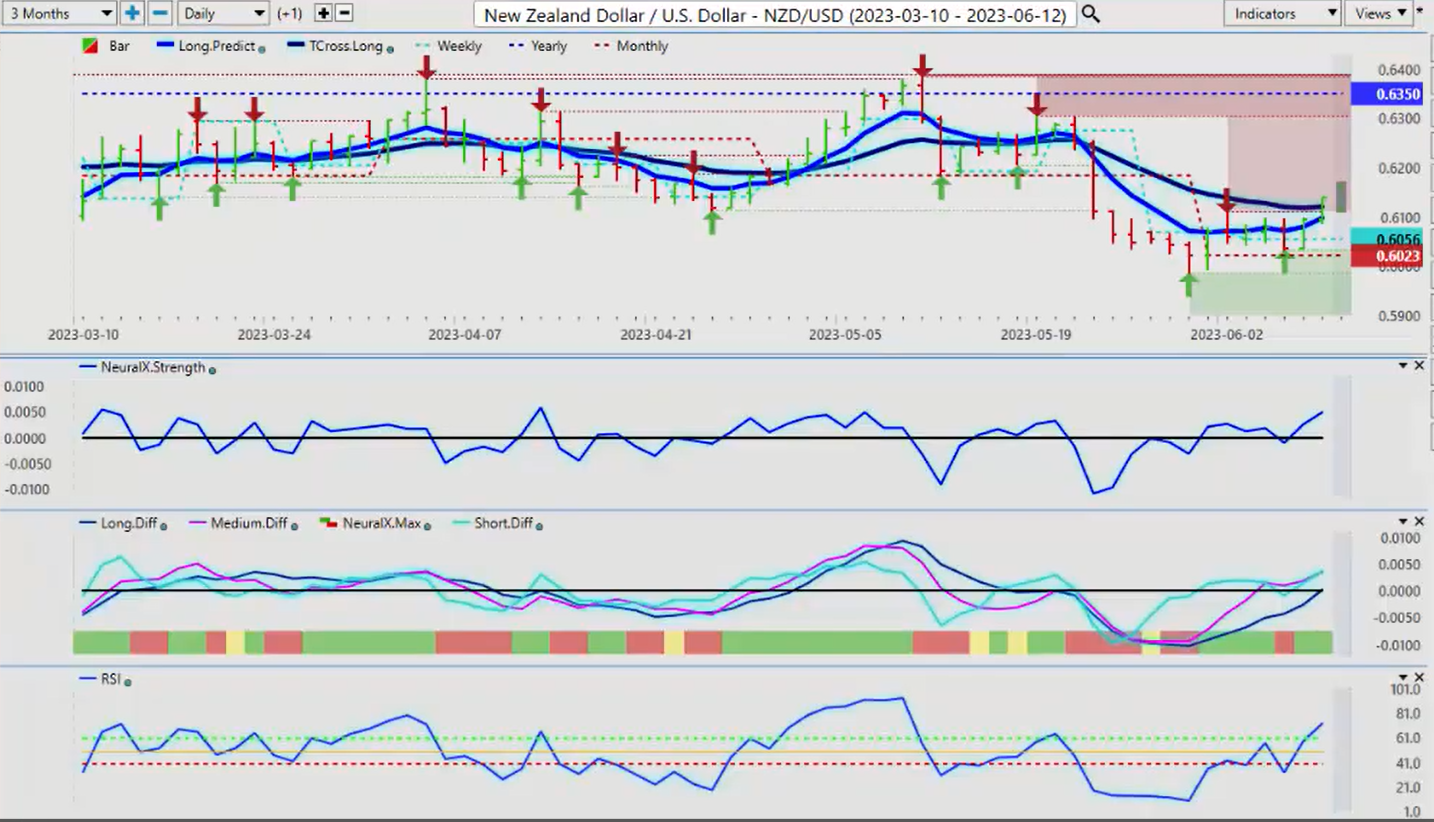
The Aussie New Zealand cross pair has been a very strong trade to the long side in May and already in June. So right now the New Zealand is showing signs of life here. The predicted differences are moving higher. Our predicted RSI is broken above 60 or it’s at 50. The break of 60 is what we look for. We’re at 72.7. That’s still showing upward momentum. Again, we’re not looking for an overbought or oversold condition, guys. That’s the equivalent of telling the market to stop going higher, turnaround and go lower. That’s not a great play here unless we have something else in the software to support that. At the current time, we don’t. So again, we will continue to monitor this, but we need to hold above the VantagePoint T-Cross long 61.21. If we do, then next week would be a good week for the Aussie, the Kiwi, and the Canadian dollar. So with that said, this is the VantagePoint AI Market Outlook for the week of June the 12th, 2023.