-
View Larger Image
Welcome to the Artificial Intelligence Outlook for Forex trading.
VIDEO TRANSCRIPT
Hello everyone, welcome back. My name is Greg Firman. And this is the VantagePoint AI Market Outlook for the week of July the 10th, 2023.
Now, to get started, this week, we’re going to look at the broader market and where we’re at with the equities, the Dollar Index, oil, gold, Bitcoin, all of your major markets.
SPDR SPY ETF – $SPY
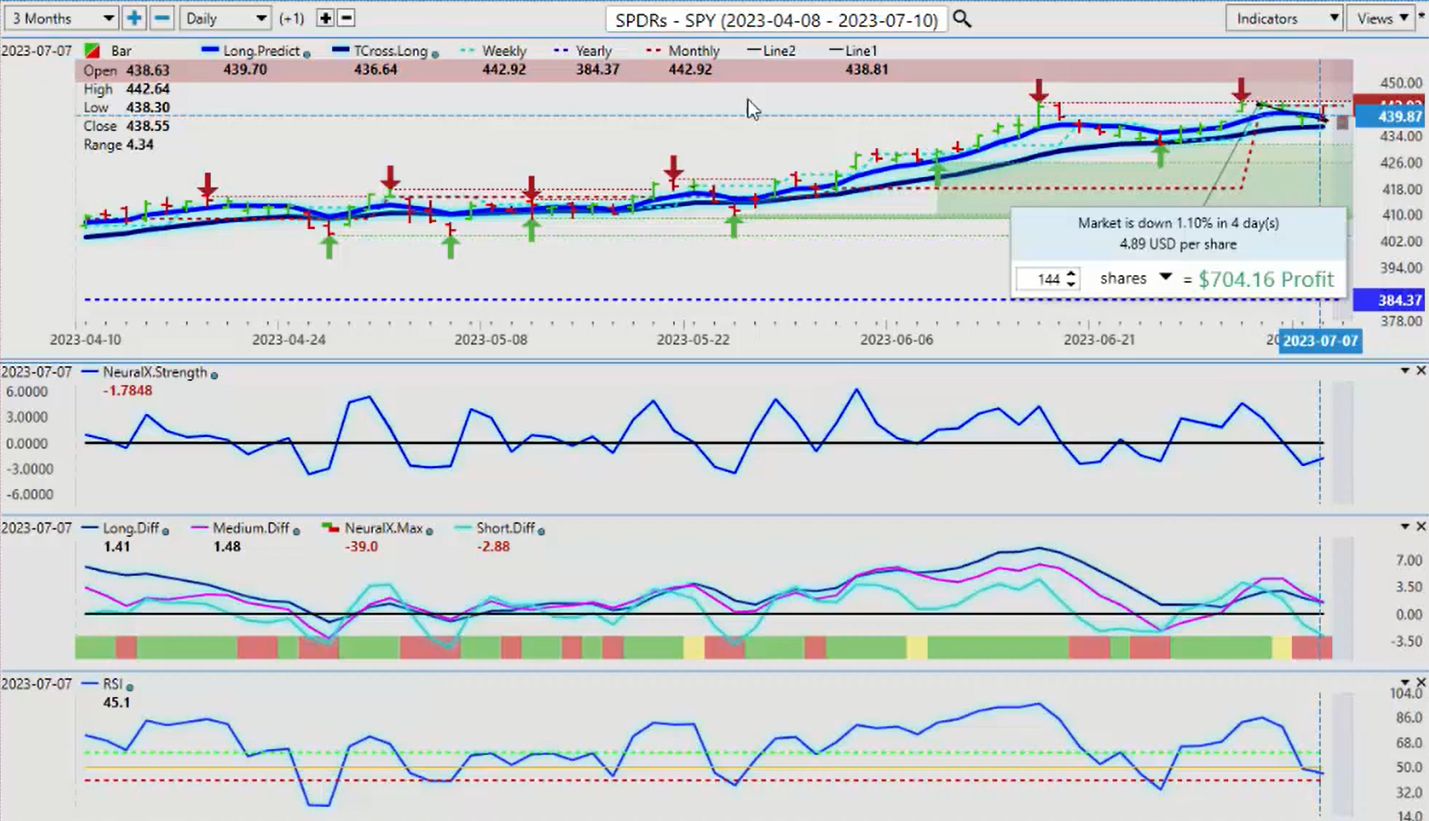
Now, the first thing we want to look at, the SPYs, the S&P 500 are up approximately 15% on the year, but as we can see here, the SPYs are not actually up 3%, they’re actually down to start the month.
Now, what I’ve talked about on these weekly outlooks is, again, not getting involved with rolling performance, keeping our anchor points constant at the beginning of the month, the beginning of the year, the beginning of the week. There’s always an advantage in that because we can see where the market is.
Now, again, in last week’s presentation, I talked more specifically about the dollar cycle and that this past week would not be a good week to buy the equity markets, but next week could be much better. We’ve pulled back, we’re down 1% on the SPYs, but you can see that we’re stopping at the VantagePoint T-cross long 436. This is the level we would want to watch for next week, but again, very important that we identify. We don’t want to go back five random days or 30 random days or 365 random days, we want to make sure we’re staying current and we’re not dragging something from 2022 into 2023. That, in my respectful opinion, is a classic mistake of your less experienced traders. Now, again, when we look at these things, we want to make sure we’re identifying these VantagePoint key levels, the T-cross long and what the indicators actually look like.
Now, the predicted RSI is not showing momentum here, it’s showing that we’re stalling out. I’ve got a 60/40 split on the predicted RSI. The Predicted Differences are a bit of a concern, but as I have stated many times in these outlooks, there is a dollar cycle, it’s at the end of the month into the first week of the new month. That cycle of dollar buying ends by, usually, Wednesday of the following week of the nonfarm payroll number, regardless of what that number is.
Now, the payroll number on Friday, not a good number at all, there was very little good things in that report, or what I should say, there was very little in there that justifies further excessive rate hikes. We can’t stop the Fed from hiking one or two more times, but the data is catching up to them. So this could favor stocks going forward, but in my respectful opinion, we wouldn’t have been buying stocks last week anyway, we would be looking for the dollar cycle to finish so we could then look at this more closely.
So next week is looking better. We have a reverse check mark on the Neural Index Strength. So again, we’re just waiting for the indicators to roll back up, but if we know our major support level, then again, we can buy from that particular level. Our monthly opening price is 442.92. It’s very easy to validate your trades on a weekly basis.
Another way of playing this is simply putting a buy limit order above the monthly opening price. And once we’ve got confirmation that the Fed is not likely going to hike much further, the dollar cycle is done, then we can buy this one as we move higher. Now, again, the same thing is applicable to the S&P 500 because it’s basically the exact same trade.
So we’re up about 15% approximately on the year. But again, when we look at this using our proper performance measurements, then we can see that the S&P 500 actually didn’t have a very good week last week at all, it was actually down 1.35% because again, we’re not picking random five days, random 30 days, we’re being very specific, the start of the new month, the start of the new week, the start of the new year. This will make it very easy for you to validate your trades, whether you should be going long or short.
So the S&P 500, again, we’re not building into that momentum with a break of the 40 level on the predicted RSI, we’ve come down on Thursday, hit the VantagePoint T-cross long to the number at 4385, which by the way, we were doing live in the VantagePoint trading room, and then we saw a significant move back up off that T-cross long. We would look to build on that next week, but we must get over the monthly opening price, that level coming in at 4450.
So again, a very simplistic way for you to validate your trade if you’re a buyer. Or you can put buy limit orders above that monthly opening price, so if the market does take off to the upside, then you will have an exact level where you want to get into that particular trade.
U.S. Dollar Index
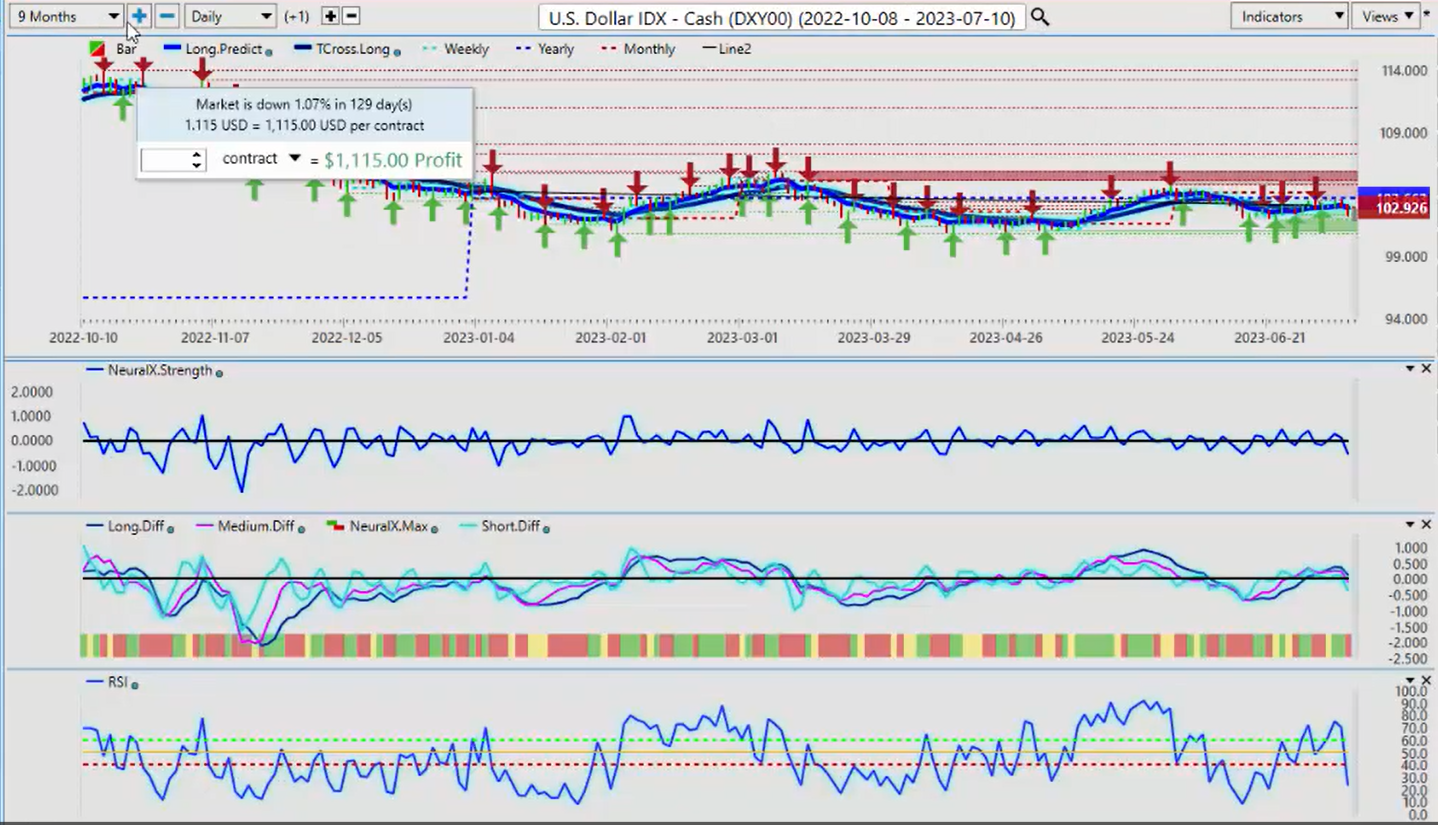
Now, when we look at the Dollar Index, again, the Dollar Index remains down on the year despite what you’re hearing from the media, TV, et cetera. And I think that this chart very clearly, basically tells us that that labor report was not good. The ADP report missing it by a country mile. I don’t even know why we’re using the ADP matrix at this particular time, but again, they’ve modified it to allow for the global shutdowns, COVID, all these things. But again, when we look at this now, this speaks volumes for the dollar’s cycle.
Now, you can see in this past week, we’ve come right up to the, basically, the yearly opening price, so that’s coming at 103.66, and we’ve had a significant failure from that particular level. So once again, to illustrate to everybody why these anchor points are so important, because that tells me where my resistance is using an accurate yearly opening price, not going back to June or July of last year, a rolling performance because again, it’s lagging, it’s misleading, and it’s not something that we want to bank on. We can look at it, but we need to stay current. It’s very much like the difference between a Predicted Moving Average and a simple moving average, one has little value, the other one has significant value.
So again, right now, our resistance going in for next week, 102.95. I anticipate the dollar will still see some strength on Monday and Tuesday, but Wednesday and Thursday of next week, we’re likely to see the dollar in trouble again. Now, the Fed may come in and say things to change that, I have no control over that, but in my respectful opinion, there’s very little that the Fed can say to sway us that he shouldn’t actually be hiking. So again, these indicators are pretty firm. Our pink line has crossed over our zero line, a medium-term crossover has taken place. Neural Index and Neural Index Strength are both significantly down.
So again, we identify the yearly opening prices, our major resistance point, the VantagePoint T-cross long coming in at 102.95, that is likely the retracement point or the long predicted at 102.90. But either way, guys, resistance is stacked up against the dollar.
Gold
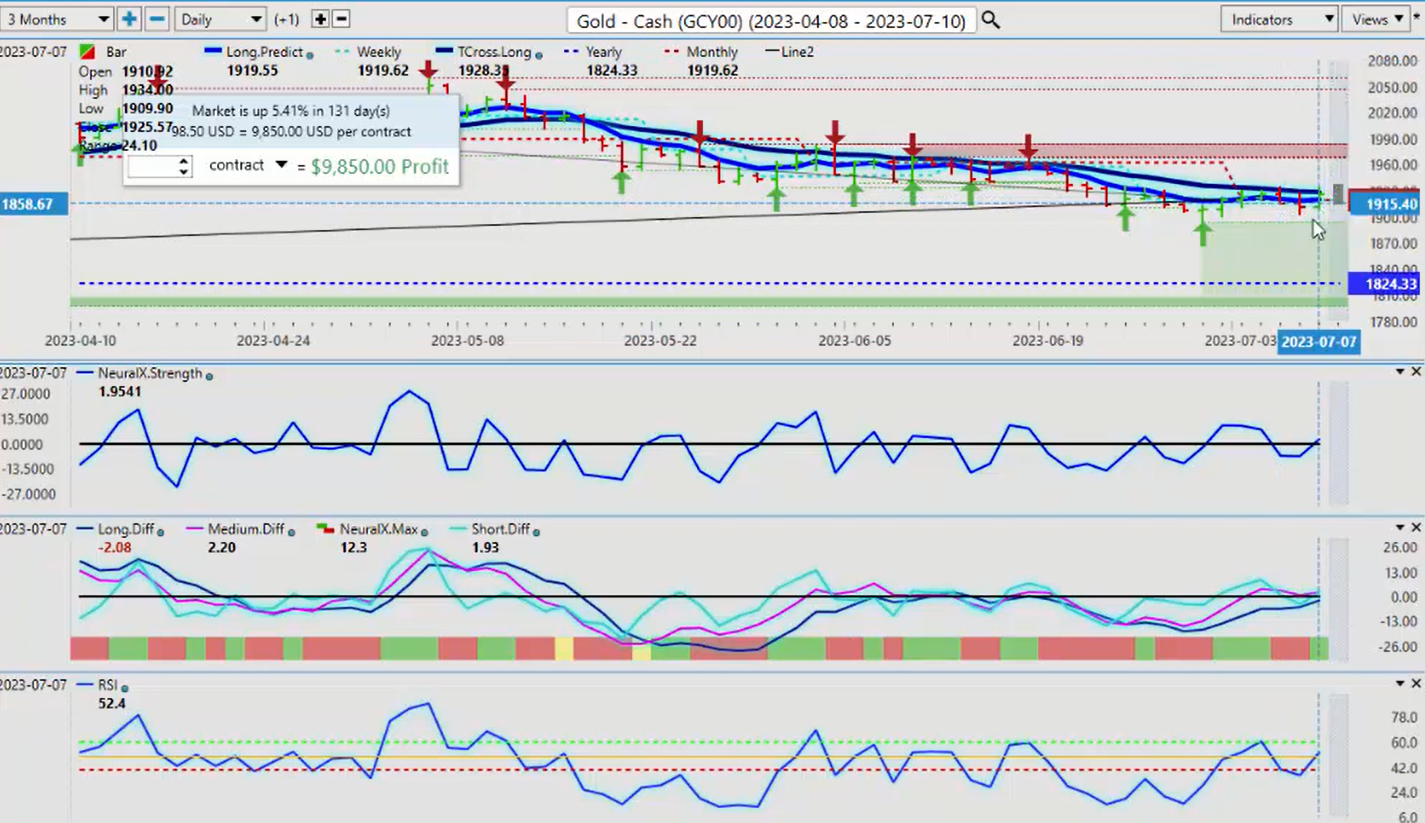
Now, gold recovering after that number again, which makes sense that it would. Gold still firmly positive on the year, up 5.4%. We’re getting some resistance from the VantagePoint T-cross, but that resistance is likely to give way by midweek, I would anticipate. Again, with the probability of a recession lingering, gold usually goes up in a recession, so I would stay with that. The VantagePoint indicators we’ve got, we’ve bounced off the 60 level on the predicted RSI. Breaking above 50, we have momentum building. The Predicted Differences are moving higher, Neural Index and the Neural Index Strength all positive. So again, it’s just a matter of time now. We need to break through that VantagePoint T-cross long, it’s coming in at 1928. But our monthly opening price, again, 1919, all we have to do is continue to hold above that, but we should use that monthly level as a pivot point to accelerate higher, so watch very closely for that.
Light Sweet Crude Oil
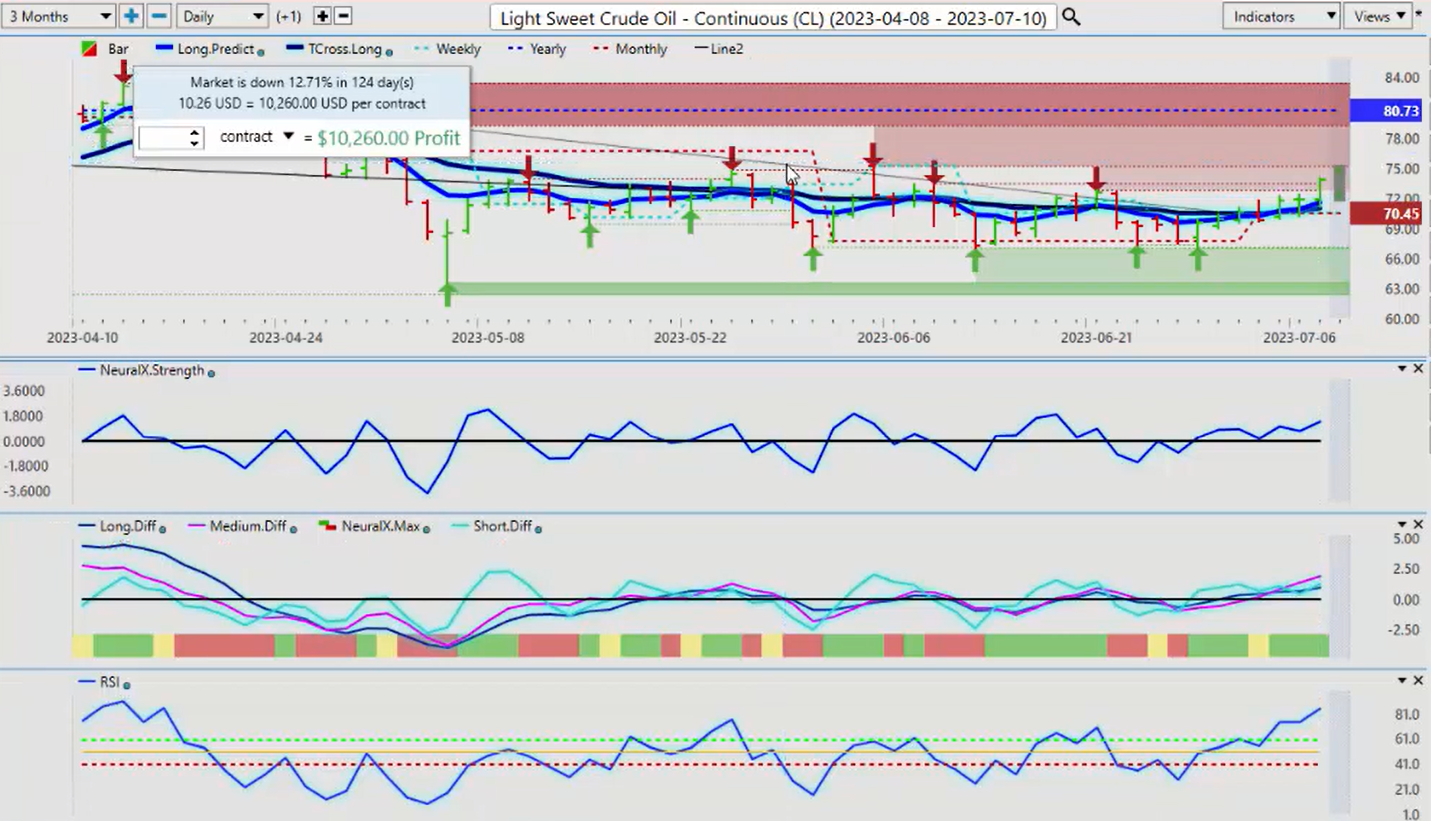
Now, Light Sweet Crude Oil, again, or your oil contracts, not the time of year to be buying oil, in my respectful opinion. This is responding to dollar weakness, but I don’t think there’s a lot of life in here. Again, oil significantly down again on the year, below the yearly, the monthly opening price. So once again, we’re holding above the monthly.
But another way you can play this is to put your sell limit orders below the VantagePoint long predicted or the T-cross long below 70.94. The yearly opening price, we’ve clearly bearish on the year. The monthly at 70.45, we’re holding in there, but I anticipate that could fall shortly. Our predicted RSI, a little bit overextended, but a bit further to the upside, and then, I think, we’re going to move lower. So again, we would go to our verified support and resistance zones.
Very, very important that we’re looking at tools like this that can tell us where that resistance is regardless of indicators, market analysts, all these different things. I think we have to be very cautious with that because again, in most cases, what often happens is that the media tends to spin things in a different way that very often is not completely factual. So the oil is bullish for the time being, but again, we must clear these resistance zones at 75.18, and at this particular time, my optimism on that remains heavily guarded.
Bitcoin
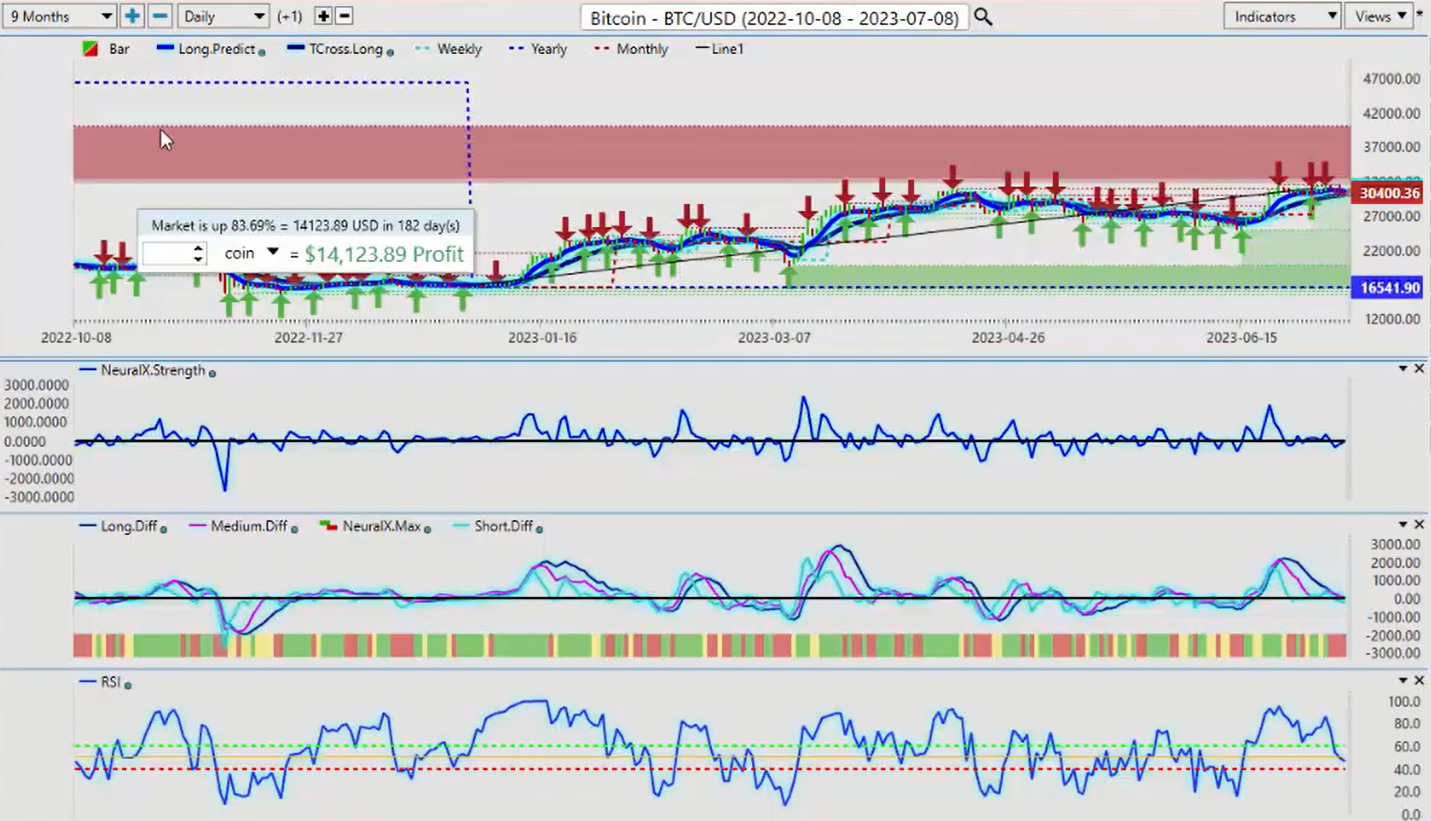
Now, Bitcoin, again, star performer this year. Again, when we look at how the media has spun this, realistically speaking, every time Bitcoin has had a year where it’s been down 50% or more, it’s rallied 50% or more for the next three years. So right now, again, we’ve got some pressure to the downside, perfectly normal, last week with that dollar cycle that I’ve talked about many times on these presentations. But you saw it again firsthand last week where the dollar moved up and it pressured stocks down. So again, accurate performance measurements are important and identifying these monthly cycles is critical.
So Bitcoin right now, we can see that we’re not breaking down, but again, when we look at this closer, you can see that we’re not breaking down below that VantagePoint T-cross long at 29,959. And what I can tell you is that there is usually a strong seasonal pattern that slowly begins usually around mid-July, it’s the strongest from September to the end of October, but I believe that they’re likely going to ramp up and start buying further Bitcoin, but we need to hold above that T-cross long. Bitcoin firmly positive on the year up over 83%.
Do we remember back in March or in January and February when the media said, “Oh, Bitcoin’s a scam, we told you that”? There was nothing factual in what they had stated, guys. The charts, we really do want to trade what we see, not what we hear is what I would argue. The indicators from VantagePoint are slowly turning back to the upside. So again, if you’re a crypto trader next week, watch your 29,959 very closely.
Euro versus U.S. Dollar
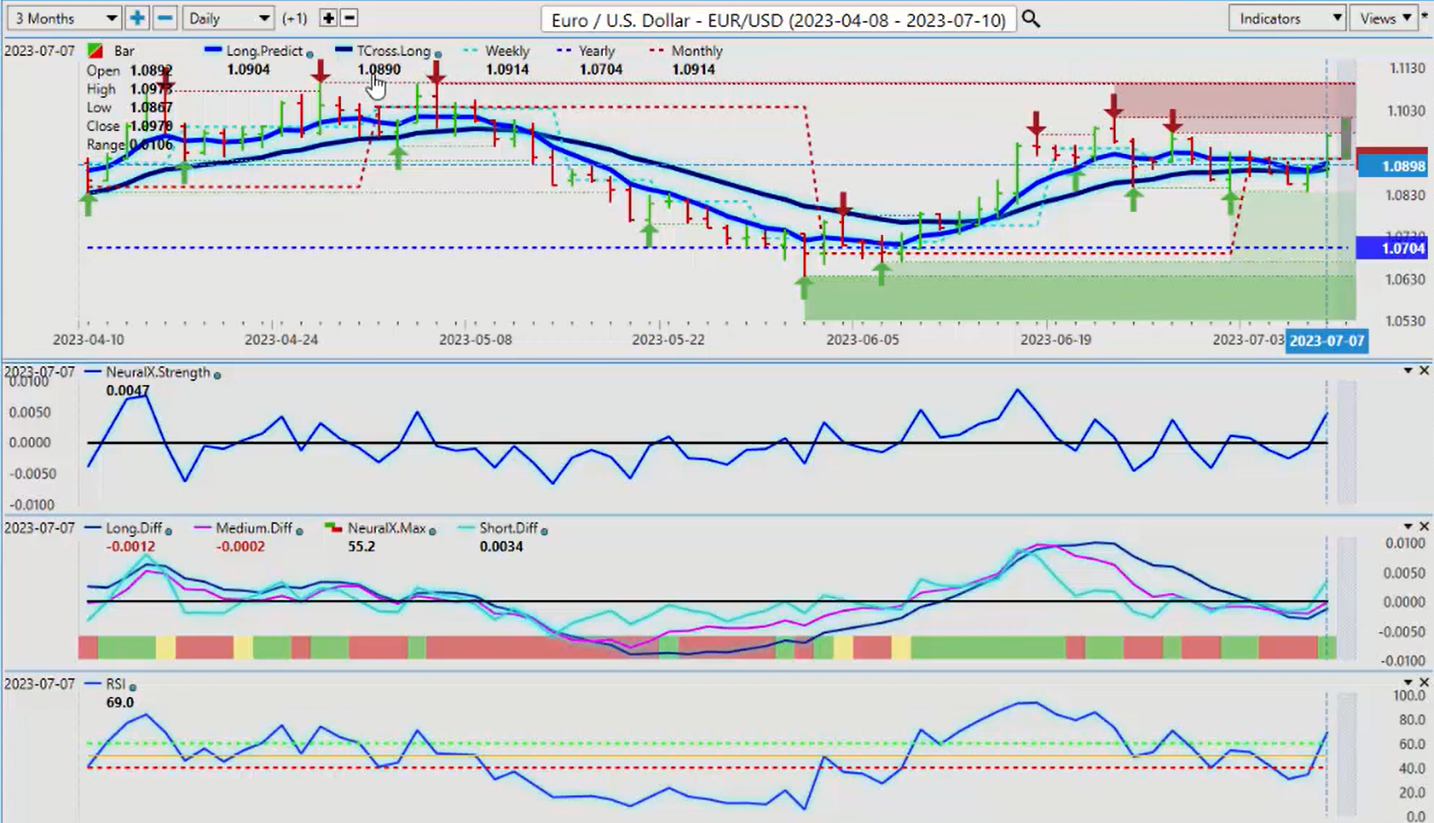
Now, as we come into some of our main Forex pairs, the euro is likely to benefit next week, you can see that that’s already started after the nonfarm payroll number. But again, in my respectful opinion, the payroll number, it’s a lagging indicator, it’s lagging news. Regardless whether that number was good or bad, the dollar would’ve likely have sold off this coming week anyway because that’s what I’ve seen nine of the 12 months every calendar year. So right now, we can see that the euro has pushed back up above the monthly opening price, that level’s coming in at 1.0914, our T-cross long, 1.0890, that’s your buy area, guys, for next week. We look for the dollar to build on these losses and the euro to benefit from that. So again, we’ll watch those levels right now, but the indicators from VantagePoint are firmly in support of the euro moving higher.
U.S. Dollar versus Swiss Franc
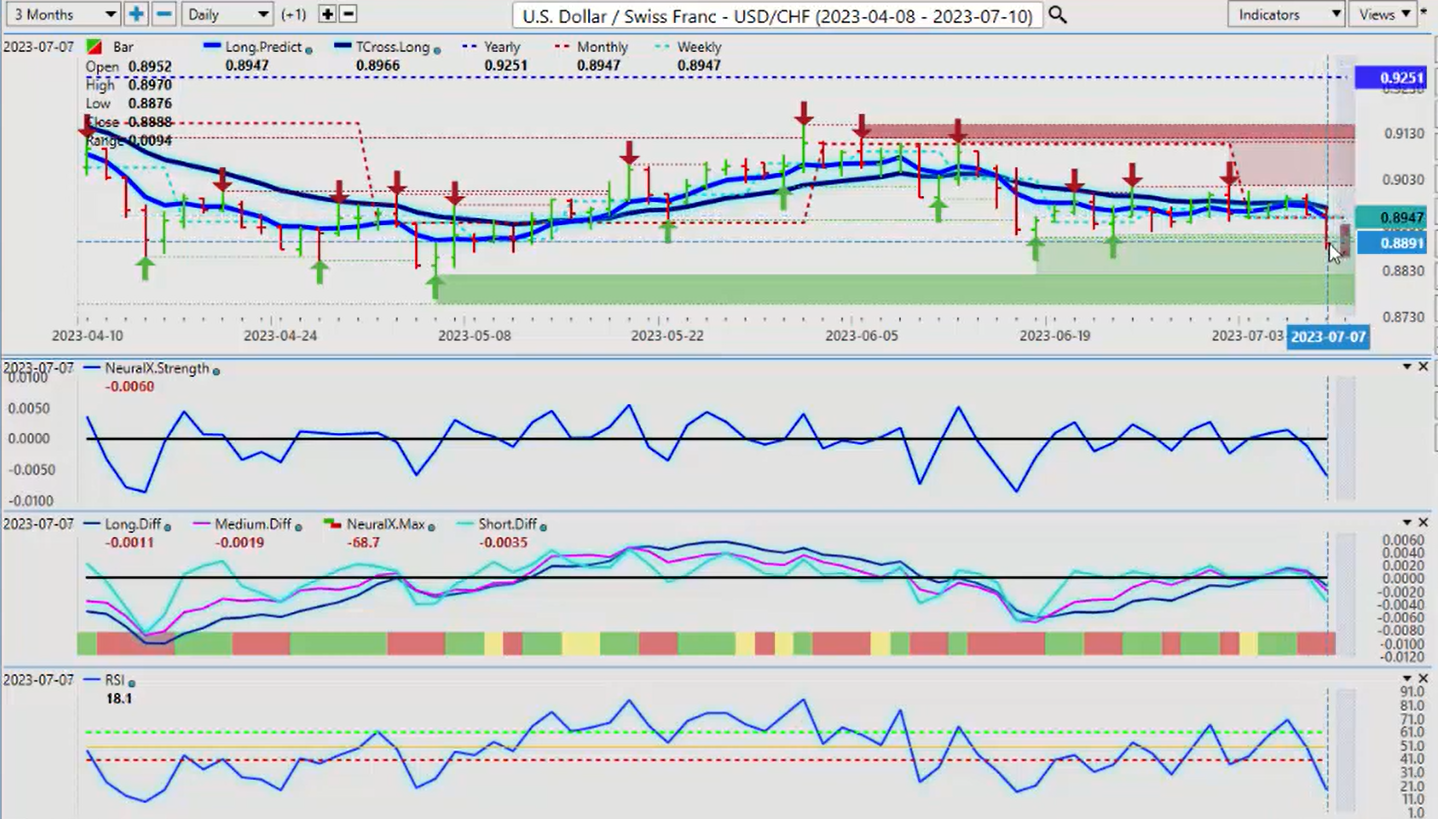
Now, the US/Swiss Franc, again, for next week, it never really got going here at all, and now, we’ve broken down below the VantagePoint T-cross long below the monthly opening price. But I will point out, we have never been positive on the year.
So once again, guys, to hammer home that point of using proper anchor points, not rolling, lagging performance, it can really throw you off your game. These are very easy numbers to use on a weekly and a monthly and a yearly basis. We don’t want to, again, drag something from 2022 into 2023, that’s not a good play here, guys. So the Predicted Differences, they’re pointing down, our Neural Index Strength is pointing down, the slope of it is pointing down, everything points to further losses. I would anticipate, at the very least, a test of the 0.8820 area based around the VantagePoint indicators.
British Pound versus U.S. Dollar
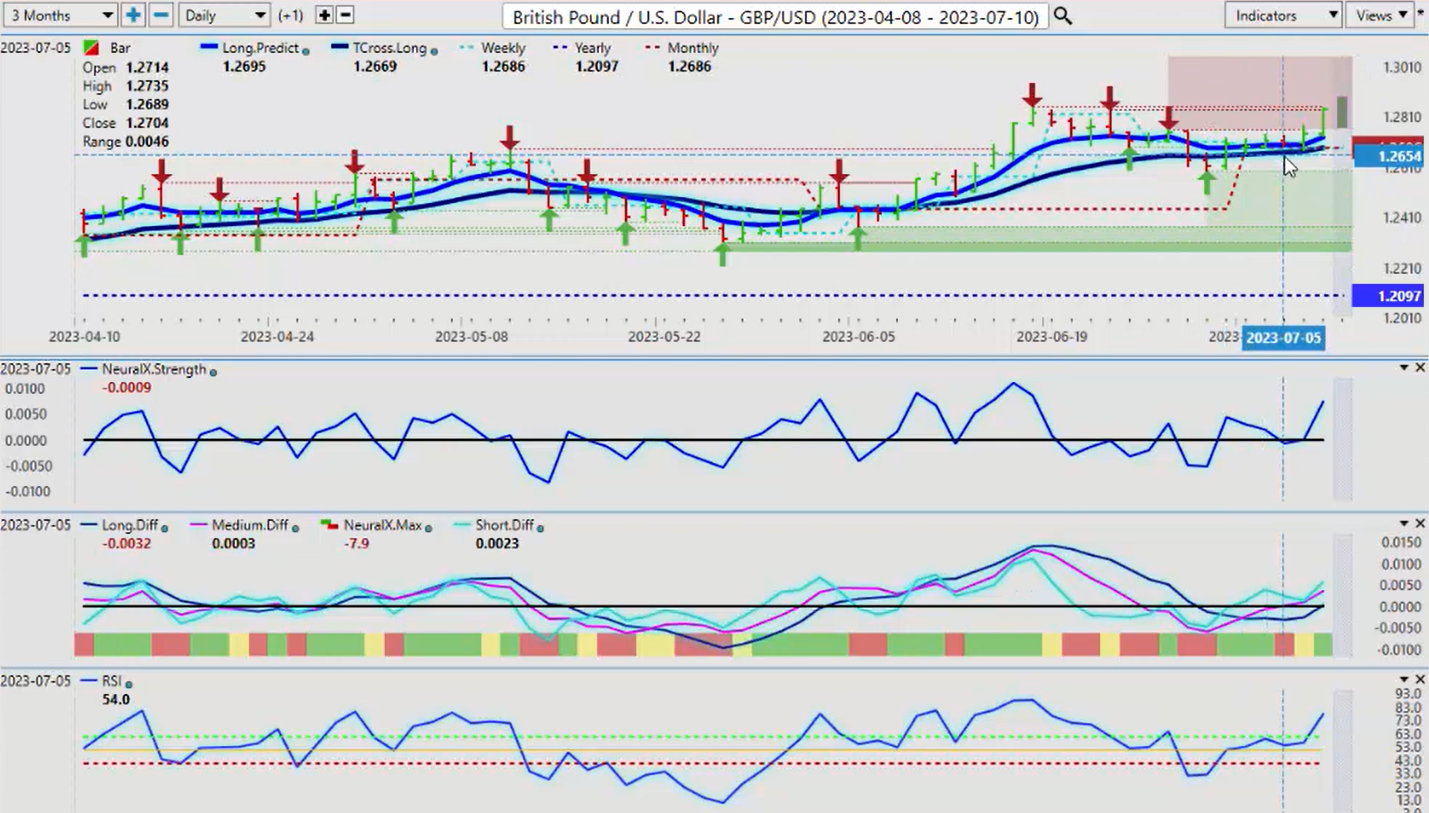
Now, the British pound, again, it’s a pretty solid week for the pound, I must say. You can see it holding every one of these days, guys. And another way to use your VantagePoint software is using the T-cross long as a pivot level or an area to buy from, and you can see that every single day using that VantagePoint T-cross long with the monthly opening price produced a winning trade. I anticipate we will see more of the same next week. I would look at the long predicted, however, 1.2727, that’s one of your more critical levels here for next week because it’s more of an exponential moving average in this particular case. The T-cross long, 1.2687, if we do test that, it will be very early in the week.
But again, another way you could play this is playing a breakout above the verified high, which is 1.2848, but I’m not usually a big fan of the breakout play, it does work, but you have to be very, very cautious. I prefer to buy in a retracement with that long predicted 1.2727, our VantagePoint predicted low was 1.2770 for Monday, so that’s the area that I would tend to focus on.
U.S. Dollar versus Japanese Yen
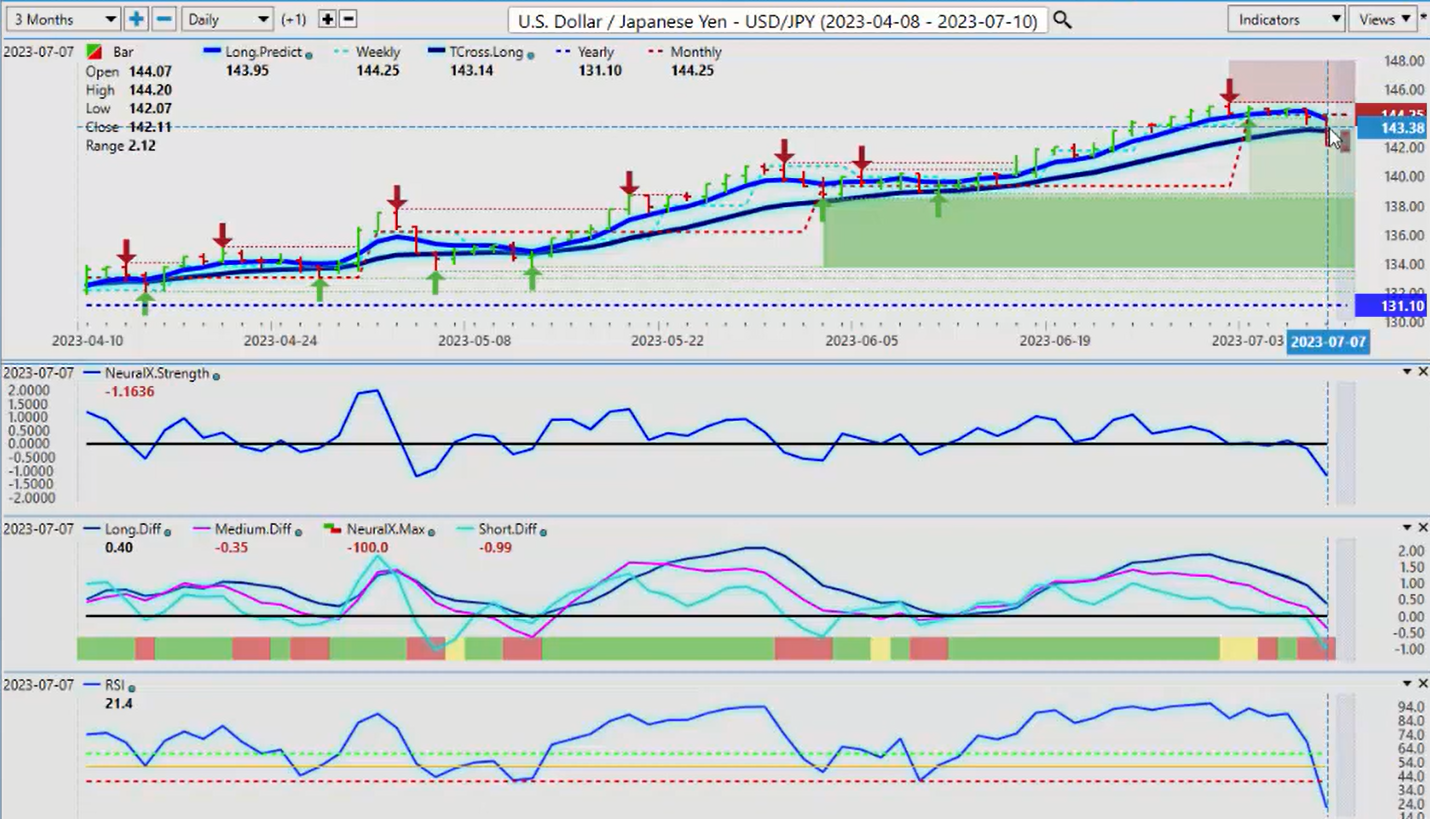
Now the dollar is still making gains against the yen, but it gave them all back pretty much on Friday. The carry trade is still in play. While this may look like a good short, my advice would be to be very, very cautious with this because again, that carry trade is still quite powerful. The interest rate differential between the FOMC and the Bank of Japan is huge, the biggest in the market. So right now, if we can stay below the monthly opening price at 144.25 and the T-cross long at 143.14, there may be a short there, but be very, very cautious with this particular pair.
U.S. Dollar versus Canadian Dollar
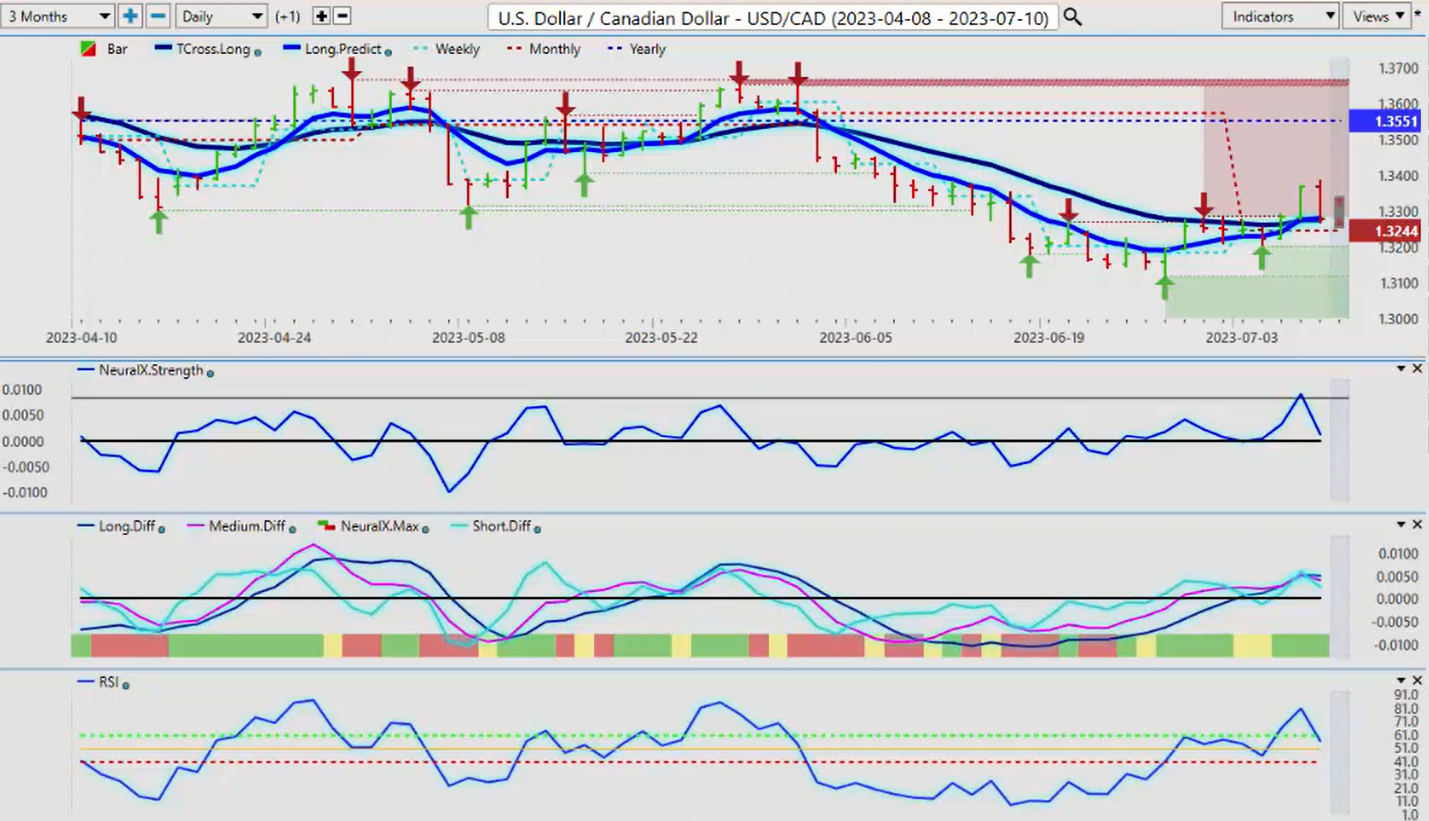
Now, for next week, when we go into next week’s trading, we are, of course, going to have the Bank of Canada. This will be a very, very interesting meeting from the Bank of Canada. They did a surprise hike, the data that’s come out afterwards did not support the hike. The CPI, the unemployment numbers, they were a little bit better on Friday out of Canada, but still nothing to write home about, nothing that justifies these kind of rate hikes. But again, watch out for that volatility. But either way, there’s a strong correlation to oil here, and that could hurt the Canadian dollar if oil turns lower.
The monthly opening price here coming at 1.3244, our T-cross long, 1.3266, so all of our resistance is up around that T-cross long level. But again, if we break down below the monthly opening price, then there could be a very quick drop to the downside. But I suspect the Bank of Canada will err on the side of caution. They will probably hike because they’ve been trying to justify it, but every time they try and justify it, something pops up that contradicts their move. This is something we’ve seen with central bankers from day one, guys, so be careful of that for next week.
Australian Dollar versus U.S. Dollar
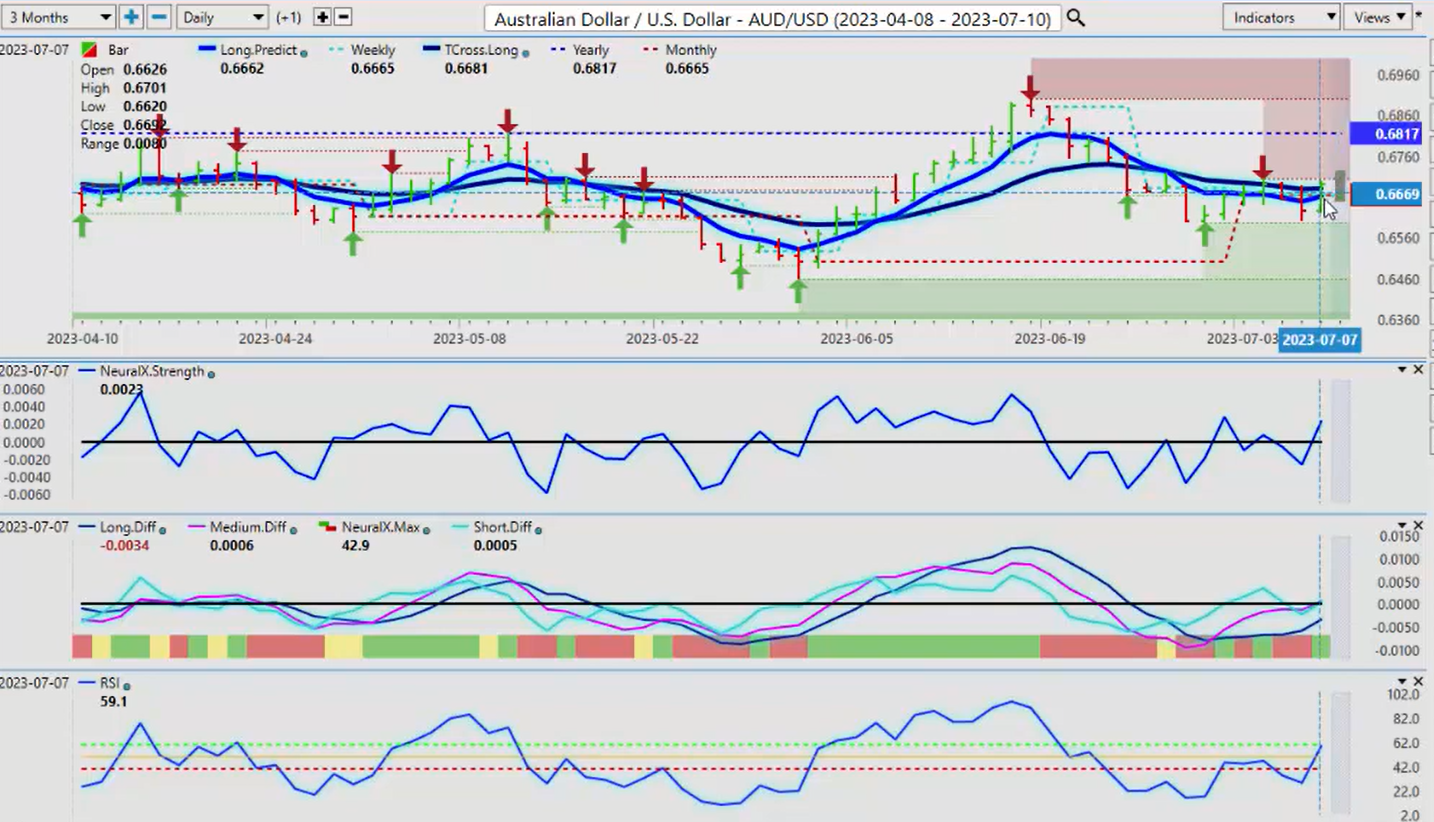
Now, with the Aussie and the Kiwi next week, both of them will benefit with a weaker dollar, but they need stronger equities. So right now could be a very, very good long trade right out of the gate on Sunday night. Here again, this presentation’s being done on Saturday while the market is closed, because again, this is an outlook, not a recap of something that’s already happened several weeks ago or several months ago. So when I look at this right now, we’ve cleared the T-cross long 66.81. I have seen this in the weeks past where the Aussie has just taken off after the nonfarm payroll number, even though the Fed was hiking.
But if stocks can recover their losses from this week and extend higher, then the Aussie will likely follow.
New Zealand Dollar versus U.S. Dollar
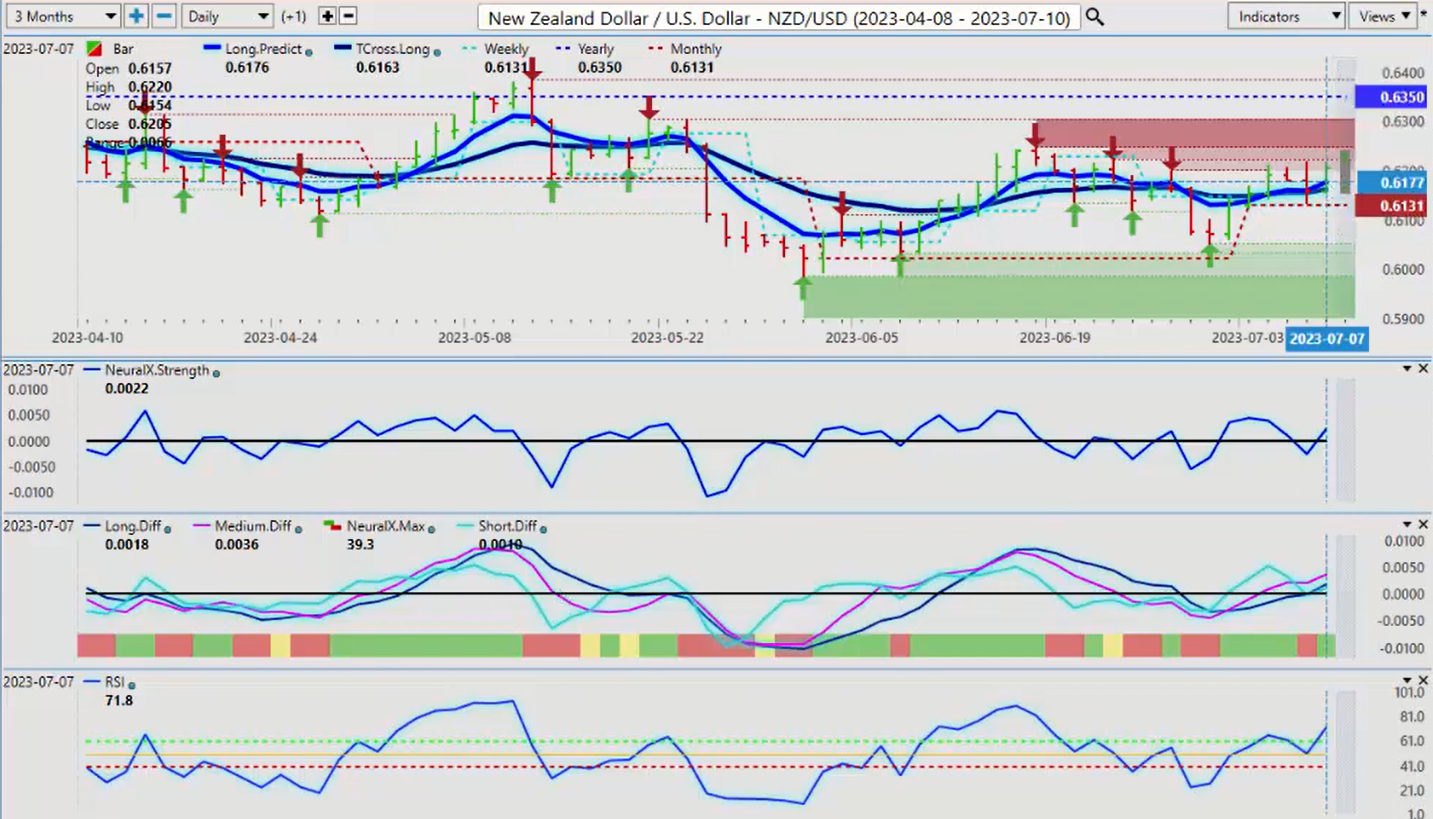
I would respectfully submit that the Kiwi is already moved higher, so the Aussie is lagging behind it a bit. So we would look for a retracement potentially on this pair and maybe a breakout to the upside on the Aussie, but there’s still a lot going on in there and a lot of unanswered questions from numerous central banks.
So with that said, this is the VantagePoint AI Market Outlook for the week of July the 10th, 2023.