-
View Larger Image
Welcome to the Artificial Intelligence Outlook for Forex trading.
VIDEO TRANSCRIPT
Hello, everyone and welcome back. My name is Greg Firman, and this is the VantagePoint AI Market Outlook for the week of July the 24th, 2023.
SPDR SPY ETF ($SPY)
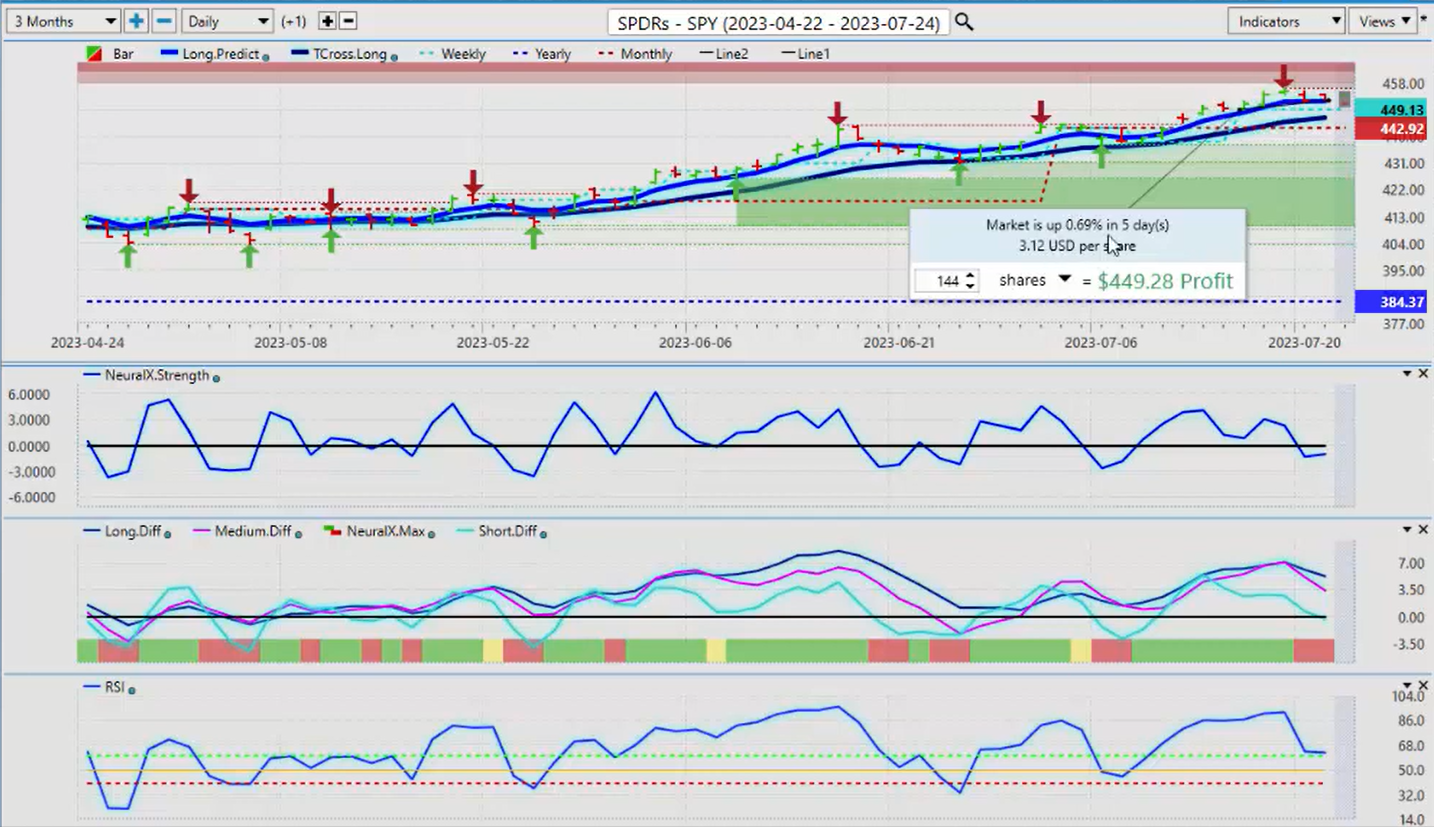
Now, before we get started here, let’s do a quick, accurate performance check on the equity markets using the SPYs, the S&P 500. We can see this past week, we finished the week up 0.69%. Now, this is based on the open on Monday and the close on Friday. We always want to measure our performance points without lagging performance models. Again, we want to look at the opening of the year, the opening price of the month, and the opening price of the week. This gives us a very good area to buy and sell from. We can see that the SPYs started the week right on the weekly opening price and continue to advance the entire week. Then on Wednesday, we started to turn back down a little bit, but we’re holding above the VantagePoint long predicted at 451.92 and still firmly above the T cross long at 446.
Now, the indicators are very mixed, but you can see that the MA diff cross is pointing down. The neural index strength, very interesting indicator here, which I’ll talk more about in a minute. Running a little bit sideways here as is the predicted RSI, the neural index is down, so warning of some potential weakness, but again, going into the end of the month, I think it’s safe to say that the equity market should be relatively safe in the month of July.
U.S. Dollar Index ($DXY)
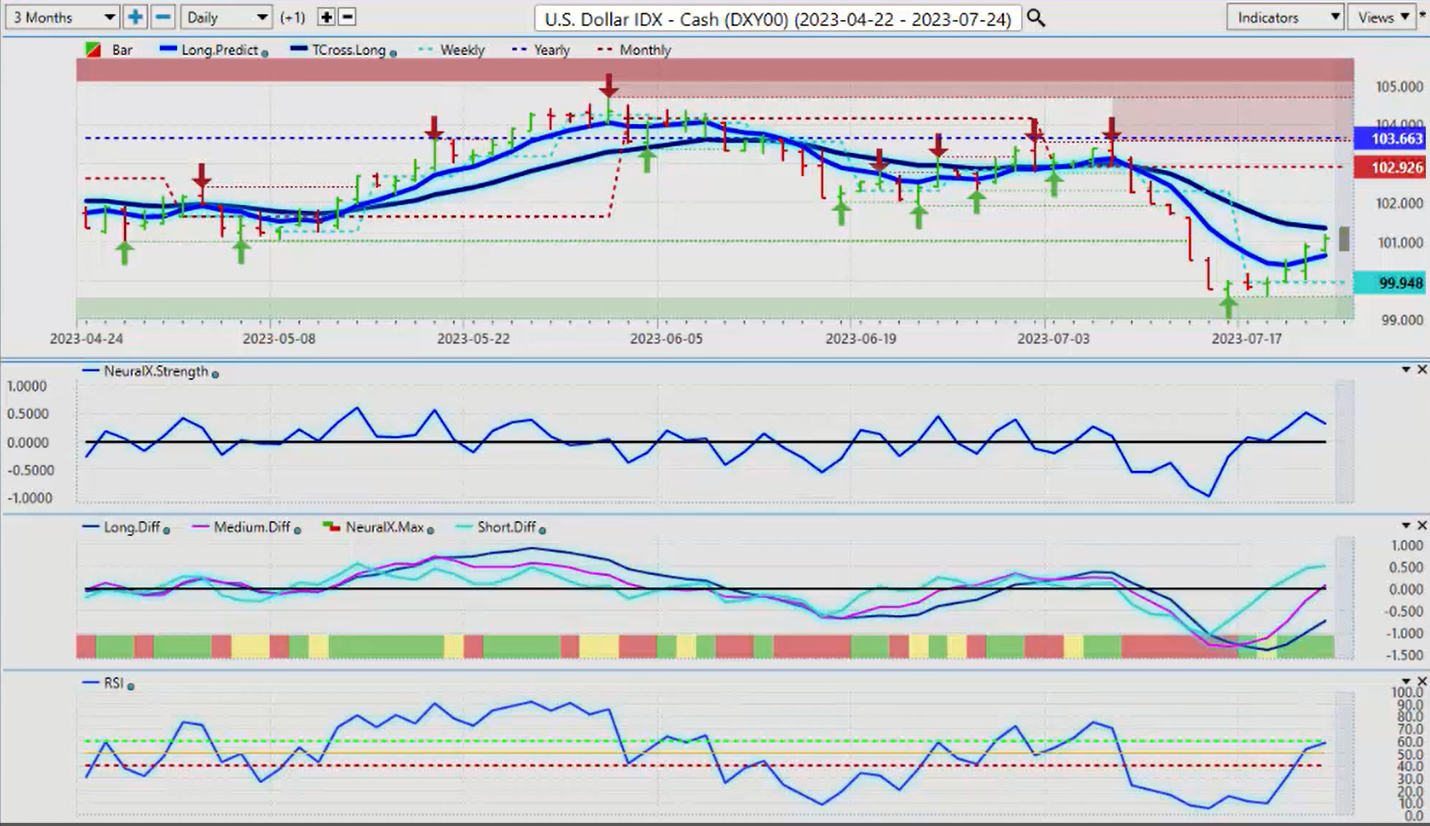
Now, when we look at the US dollar index as discussed in last week’s weekly outlook, because again, this is an outlook guys, not a recap of something that’s already happened. So we look to get ahead of these markets while the market’s closed. You can see that this video is being made on Saturday at 11:40. The markets are closed. So again, when we look from last week, we can see that we had a fractal low that came in at or about 99,57.
I would argue we came down a little bit lower than that. But either way we can see that the tools that told me last week that were going to reverse. Number one, the MA diff cross. Number two, the neural index strength is pointing higher while the neural index itself is actually red. We can see the RSI starting to rise here. But again, the main thing we want to look at guys is again, the inner market correlation between the S&P, gold, oil, all of these different things. And last week was a very odd week because we actually saw most of the markets all moving up at the same time, and then at the end of the week, it was the dollar that prevailed. Now next week will be a trickier week. We are moving into summer trade the closer we get to August 1st.
So the move in the dollar at the current time is corrective in nature. This is the way we would look at it with the VP software. We’ve got our T cross long at 101.35. We must clear that next week. I personally don’t believe, we’ll get above that and get a firm buy signal until we get into September. The dollar will see some buying at the beginning of the month, but it’s usually not heavy. If we look at the slope of the neural index strength, the very same thing that told us the dollar index was going higher this past week is also now warning us we could have a problem. So again, this is a corrective move on the dollar until such time as we clear the T cross long at 101.35 we’re negative on the month and we’re negative on the year. So again, we must look at these somewhat non indicators to get a price-based analysis. Then we move in with our intermarket analysis correlations.
We look at our core indicators, but it is always good to understand that this may not be a new trend and is very likely corrective, but again, I’m a happy buyer of dollars once we clear 101.35.
Gold
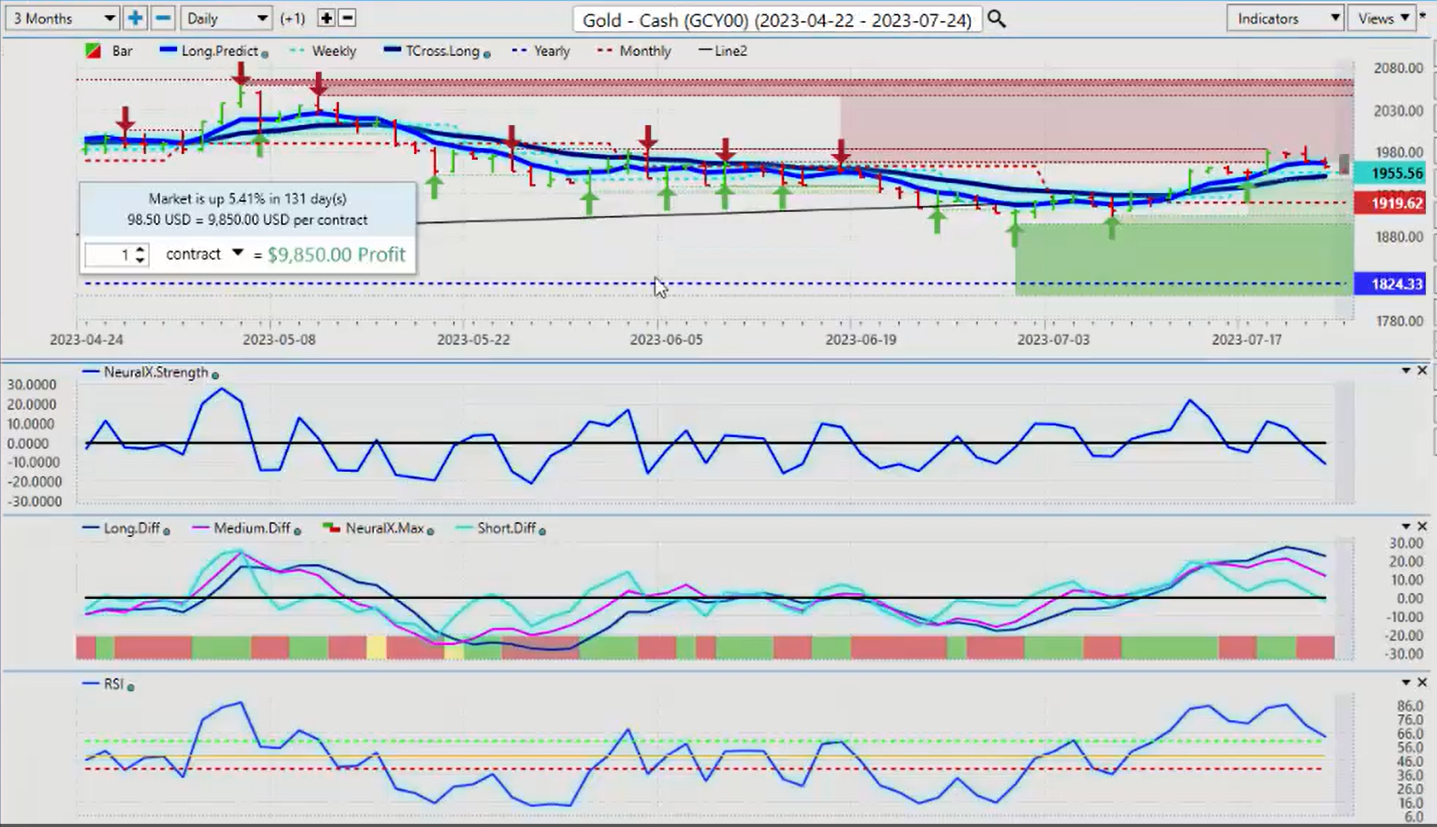
Now, when we look at gold prices from this past week, you can see what that dollar strength, as soon as the dollar started to accelerate on Wednesday, gold started to turn down. But again, still firmly above our T cross long at 91.51, we remain long while above that price, but again, we’ve got to be cautious as we’re coming into a period of known dollar strength at the end of the month into that first week of the new month. The indicators here are saying further downside. Our neural index strength is pointing down and it’s below the zero line. The neural index itself is red, falling RSI, and again, most of the indicators here point to a corrective move, not a new downtrend. The S&P again will follow the SPYs. You can see that again, we had a nice big rally up here, but again, we weren’t able to hold it based around that dollar strength.
So once again, when we look closer at this and we come back five days, and I can do it quickly here for you guys, so you can see true performance on the week. We measure the opening price on Monday to the closing price on Friday to get an accurate view of what the actual performance for the week was, and it’s the same as the SPYs guys, 0.61%. So again, up until the midweek, when that dollar, when the indicators from VantagePoint warned us that the dollar was going higher, the equities immediately stopped. So for next week, our high 4578, we need to get above this quickly and we need to stay above this. But my optimism is somewhat guarded because again, we’ve got the MA diff cross, the neural index is down, but we’re flat lining here on the neural index strength. So again, it’s warning that there isn’t necessarily a lot of downside momentum.
Crude Oil
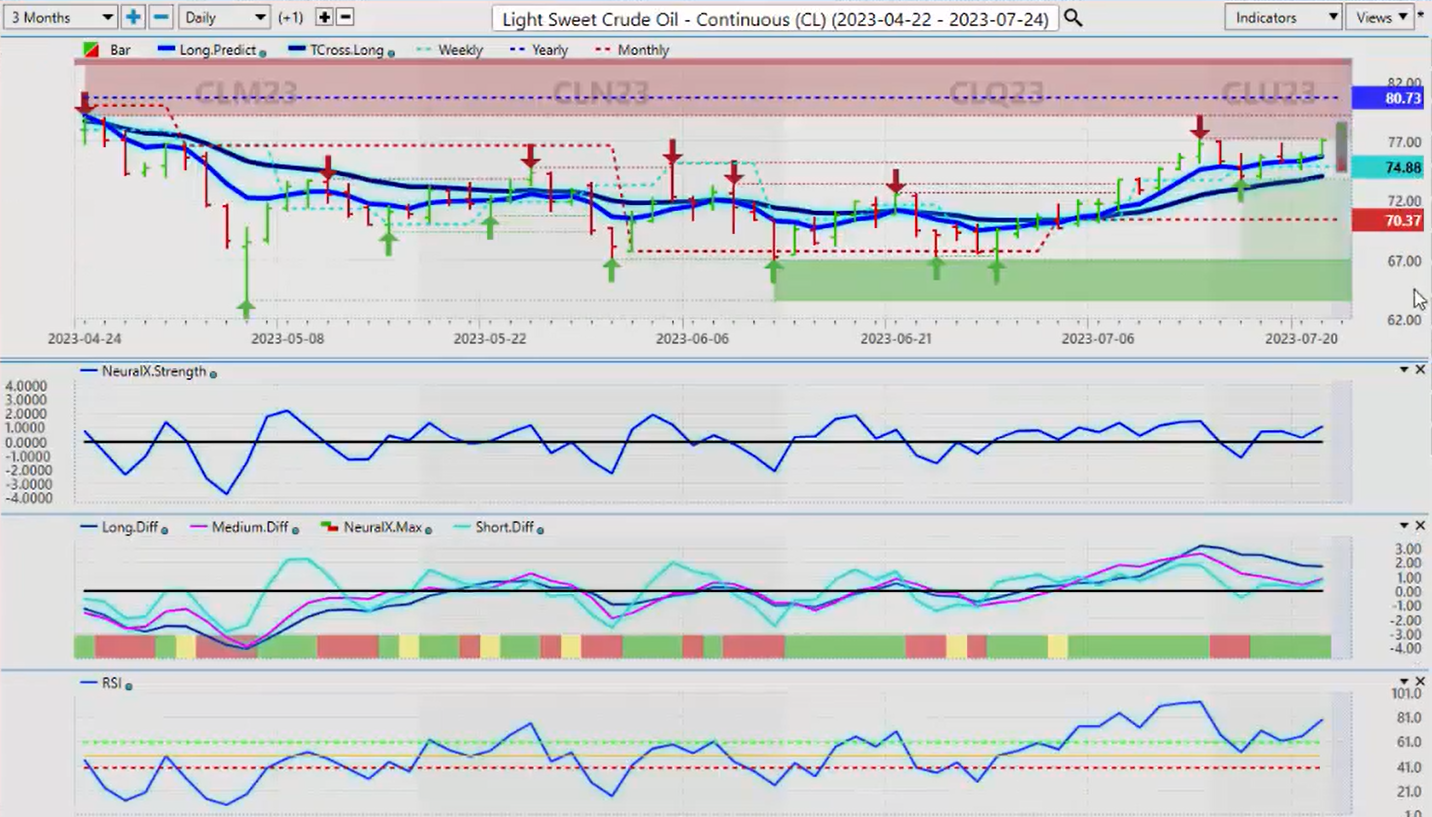
Now, this past week we did see some rise in oil prices, but again, it’s very unlikely that oil would remain high up here.
We’ve got a newly formed verified resistance high 77.20. The seasonality in oil is basically at the very end of that strong seasonal pattern that started back here in, I would argue end of May, early June, a very well known seasonality that came to fruition again, but that seasonality usually ends as we start to get into August. So I think that it’s reasonable for shorts. We just need to get these indicators on board. The neural index strength is not on board. The predicted differences are starting to turn back up, but wait and watch very carefully because indisputably oil is bearish on the year guys. We opened at 80.73 and we’ve essentially, we’ve been below this level the entire year. When we look at it over a nine month period, you can see that when we opened, we came back, we went all the way down to $61 a barrel, but we came right back up to the yearly opening price, became all tangled up in it and down again.
So again, unless we can get above 80.73, shorts still are reasonable on those oil contracts because again, we’re also nearing the end of summer driving season.
Bitcoin
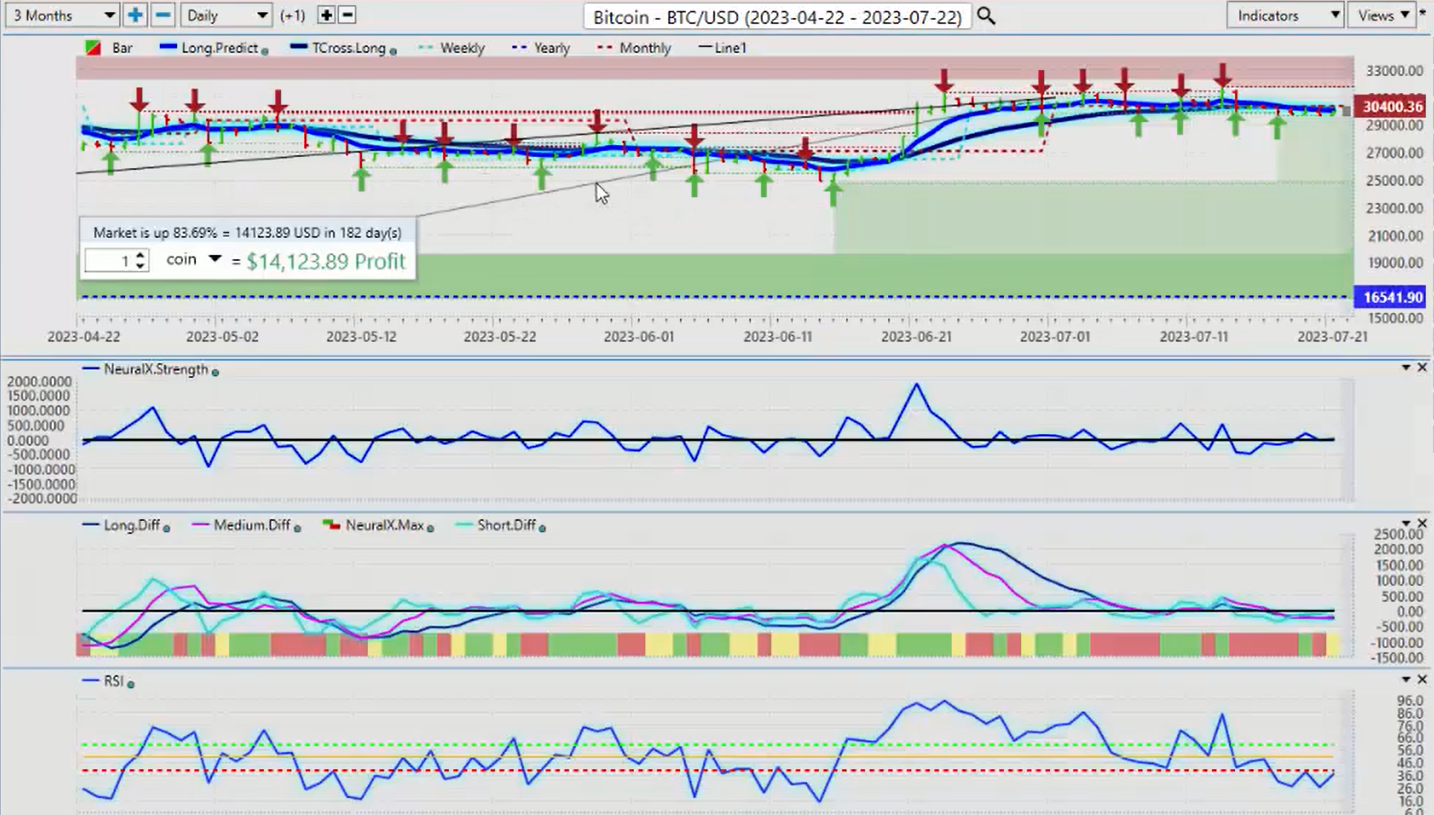
Now, when we look at Bitcoin, Bitcoin basically running flat on the week, but again, a strong seasonal pattern appears in mid-September, but there’s also a seasonal pattern that where all of this starts, which is usually in late July. So I think that Bitcoin should hold its ground, but basically flat lining for now with a slight upward bias, but the indicators are pretty much dead flat at the current time.
Euro versus U.S. Dollar
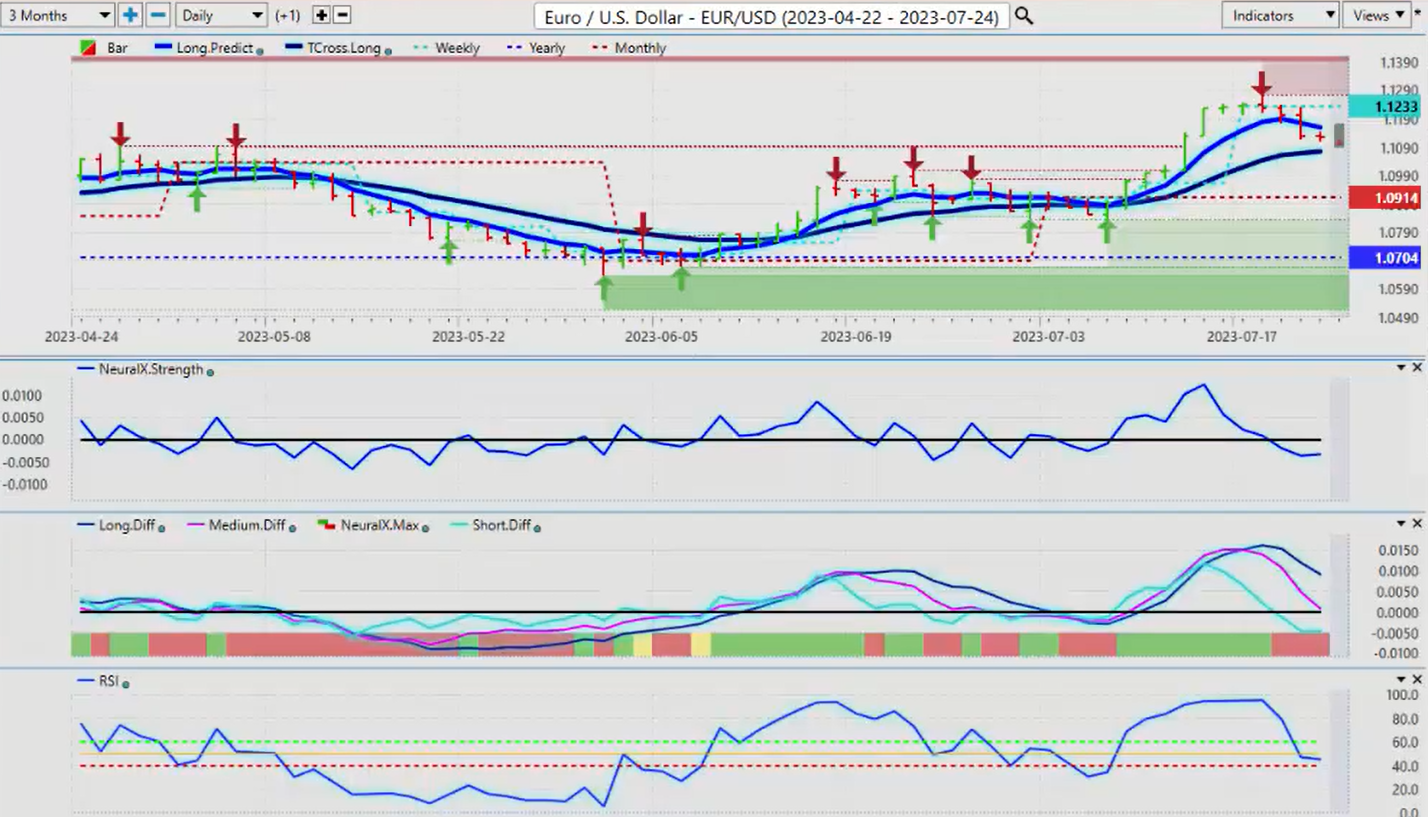
Now, when we look at some of our main forex pairs for next week, the Euro US pair, again, guys always remember, and we worked on this in the VantagePoint live training room also, that if Euro US is to extend higher like they were telling us last week, then we must have a breakdown in the dollar index.
The inverse correlation is 99.999%, meaning if the dollar index is going up, the euro is only going down, and that’s what’s happened. As you can see, once again, leveraging the weekly opening price in your trading, that you’ve got a Monday Tuesday reversal, which I’ve discussed. Then by late day Tuesday, we start to see the real price, and you can see that on Wednesday we opened and then just went straight down. We came back up on Thursday. Yet another excellent entry point using that weekly opening price, sending us lower because the indicators were telling us it was going lower, it was simply validated using that, leveraging that weekly opening price. Again, right up here, you can see it 1.1233 with my own direct clients. We were selling anywhere above, anywhere slightly above this level, and again, you can see that fake price on Monday and Tuesday and only to turn around.
So now we need this momentum to keep going. We don’t have a lot of momentum currently in to the downside, but I believe that could change. We do have the Fed next week. This all could be a buy the rumor, sell the fact, I certainly would not disagree with that statement, but we have to see what the fed’s plan is next week. So be very cautious around that is what I would say.
U.S. Dollar versus Swiss Franc
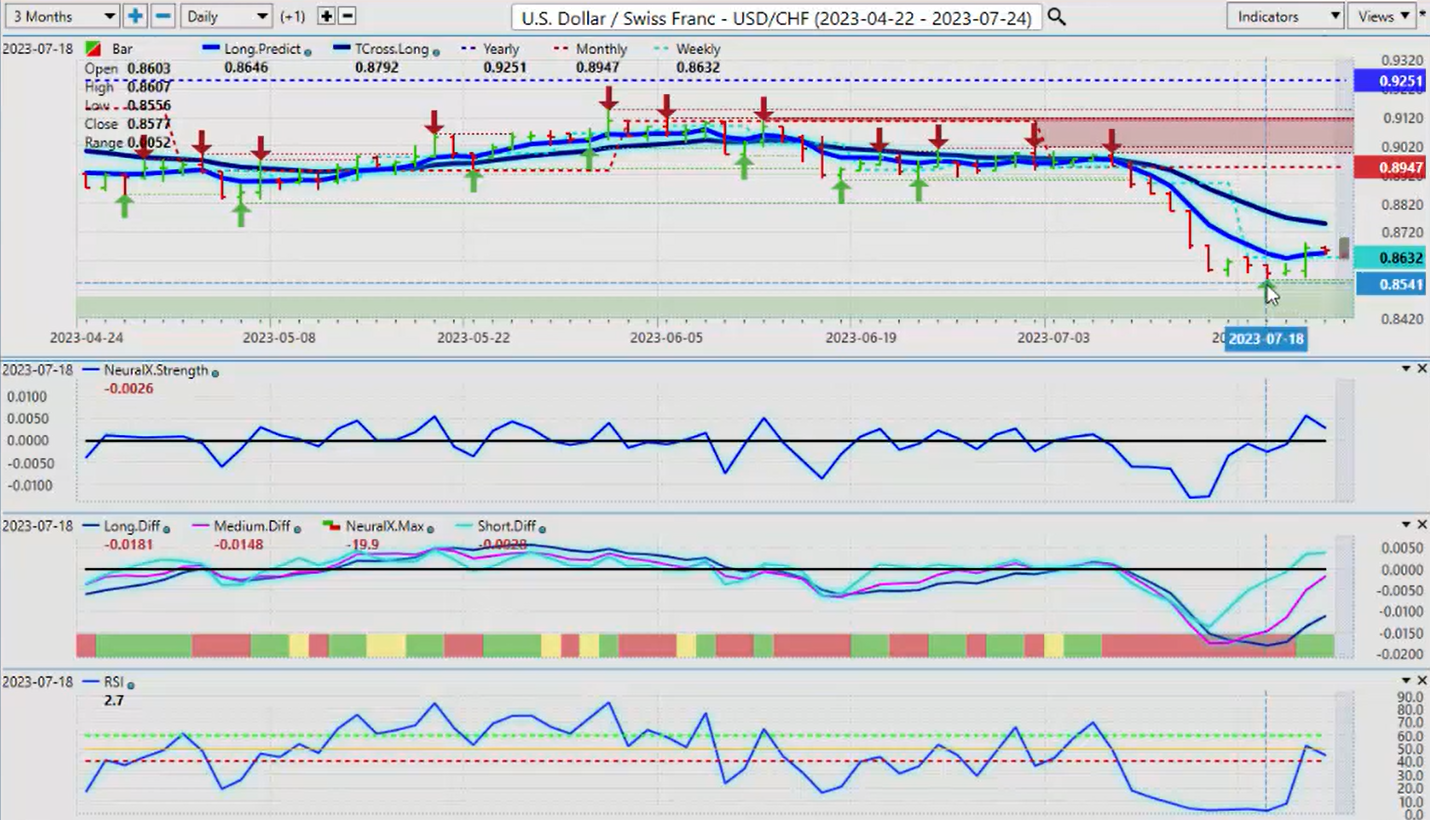
Now with the US Swiss Franc, again, this is a place of value to buy dollars. Last week, as I had mentioned, we had a newly formed verified support low coming in at that 9556 level. Once we failed at that level, the very next day you can see that the market starts to turn. And again, we look for that to continue to advance, but in my respectful opinion only, it’s still just a corrective move higher.
This is clearly bearish on the year, but very good buying opportunity multiple days in a row off this 8550 area. So for next week, I believe we will advance to the T cross long at 87.50, but be very cautious with loans unless we get a hawkish fed. And even if we do, I still don’t know if it’s enough because you can see the neural index strength and the predicted RSI are both picking up on the same thing, a lack of momentum.
British Pound versus U.S. Dollar
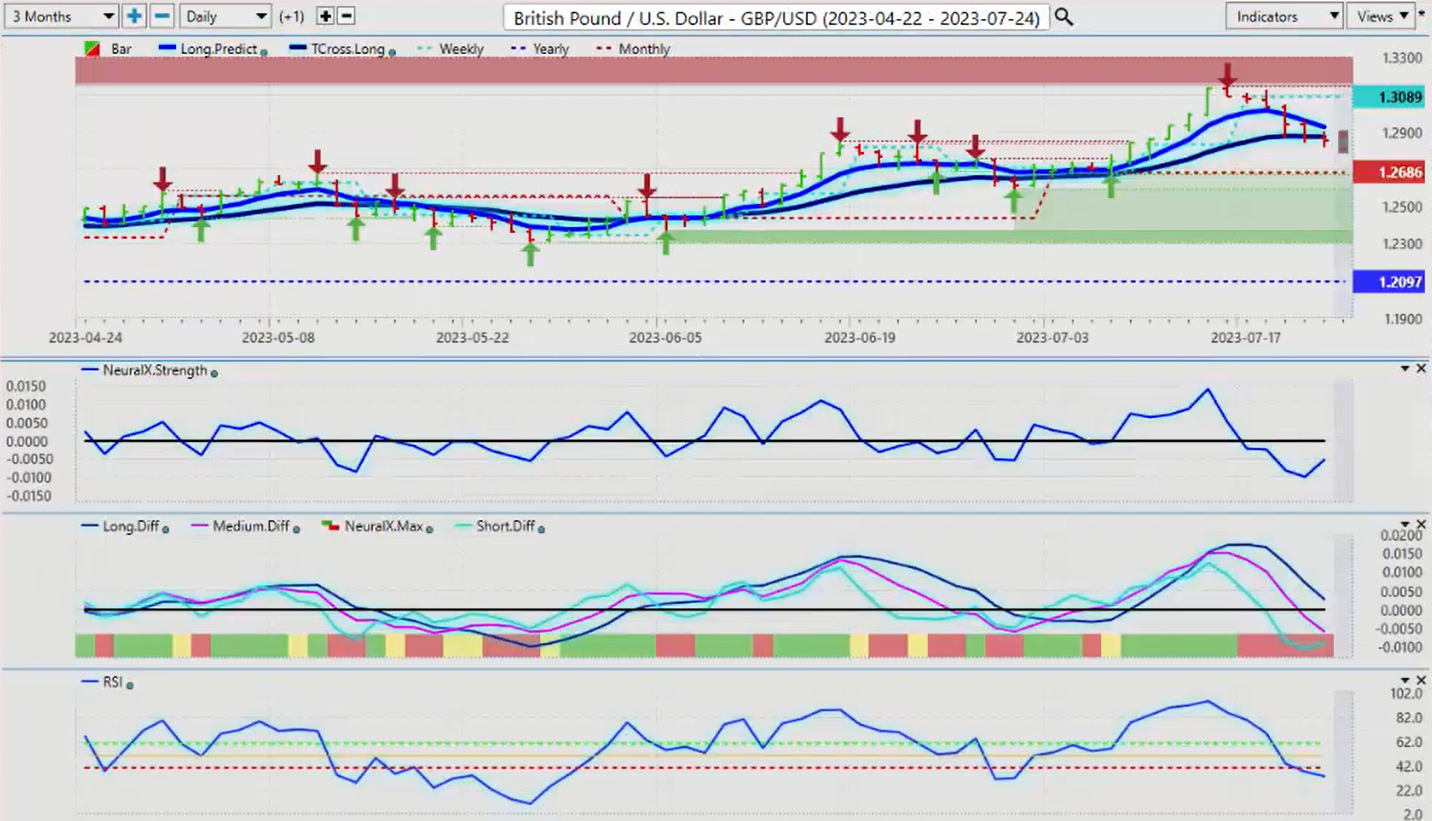
Now, the British pound, as I had discussed in last week’s weekly outlook, I did not believe that this would go higher despite those rate hikes. I believe the rate hikes from the Bank of England were a huge mistake, and now they’re kind of admitting it this week by saying, well, we’re now going forward. We’re only going to probably raise 25 basis points.
So I would respectfully submit they’re going to be looking at probably cutting by the end of the year because their economy is not going to survive these rate hikes. But either way, again, we can see that the VantagePoint indicators, the neural index strength is pointing down. I measure that against my weekly opening price to determine who is in charge, the bulls or the bears. It’s an excellent tool to use to validate your trade and to validate these indicators, which it did. So once I could see we were not getting above the weekly opening price, we immediately start selling. And again, we worked on this in under live trading conditions in the VantagePoint training room because I had stressed that, look, I think that rate hike is not the play that they should have done, but either way, when we look at this, we are still bullish on the year.
1.2097 is the low 1.2886, we’re still positive on the month, but I could definitely see the pound coming down and at the very least, testing one, the monthly opening price at 1.2686. But once again, guys, it’s very, very important that you’re using accurate 30 day points. It must be at the beginning of the month, the end of the month, the beginning of the week, the end of the week, the beginning of the year, the end of the year. We don’t want to get into this rolling performance where we’re trying to measure performance using random dates. Again, this is the start of the week, and I want to know, can the bulls push through this because the entire markets are based on an argument between the bulls and the bears. We could argue and debate this. My indicator’s better than your indicator, my system’s better than your system.
It’s irrelevant guys. What is the market doing? I don’t want to beat the market guys. We want to join them. That is the key methodology here. So I don’t want fight this. They’re not buying this period. So I’m going to join the market and I’m going to sell it. So now we’re tangled up in the T cross long 1.2874. This is a make or break point for the pound next week, it’s either going to hold or it’s going to turn. Now the neural index strength, again, as I discussed last week, it’s a powerful indicator because the neural index is down, but the neural index strength is actually pointing up. So is that the key we’re looking for reversal? The answer is, guys, use your weekly opening price and your T cross long for next week. If we’re holding above both of those, then fire at will for longs.
U.S. Dollar versus Japanese Yen
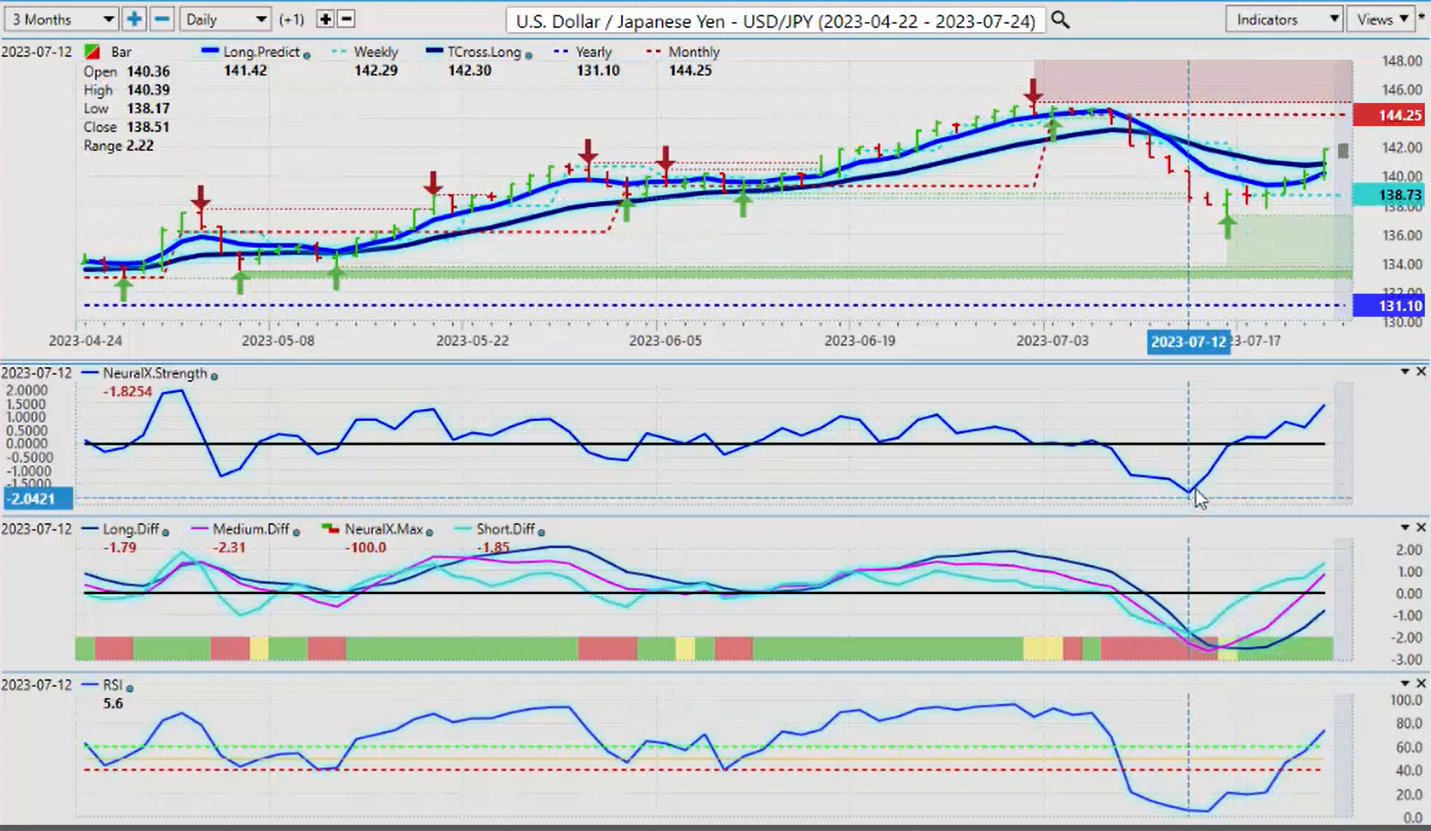
Now with the dollar yen, we can see that dollar strength really showing itself here. And once again, when we look at the indicators from VantagePoint, the neural index strength was already moving higher, but it took a few days for the neural index itself to get on board with this trade. But the verified zone formed, and again, the MA diff cross, the reversal to the upside on the dollar yen was a leading indicator, and I will highlight this so you can see this. The pink line is the medium term crossover. The blue line is the long-term crossover. So the medium term trend to the downside is weakening against the longer term trend. Then we form a newly formed verified support low. Then on Tuesday and Wednesday, we start to cross over the weekly opening price. That led to a significant push in the market from the weekly open at 1.3873 to where we’ve ended up finishing the week above the T cross long, and that’s coming in at 41.96.
So when you put the pieces of the puzzle together, you can see that some of these leading indicators gave us a very early warning sign, but it still came down to the dollar index. Is the dollar index going to rise? If it does, these will follow, which they did. So again, carry trade appears to be back on guys for next week, the T cross long 140.88, that is your support level and leverage your weekly opening price. This is in a clear uptrend. I don’t know how much further up upside we’ve got here, guys, but I think we’re likely to head towards 144.25 to finish the month.
U.S. Dollar versus Canadian Dollar
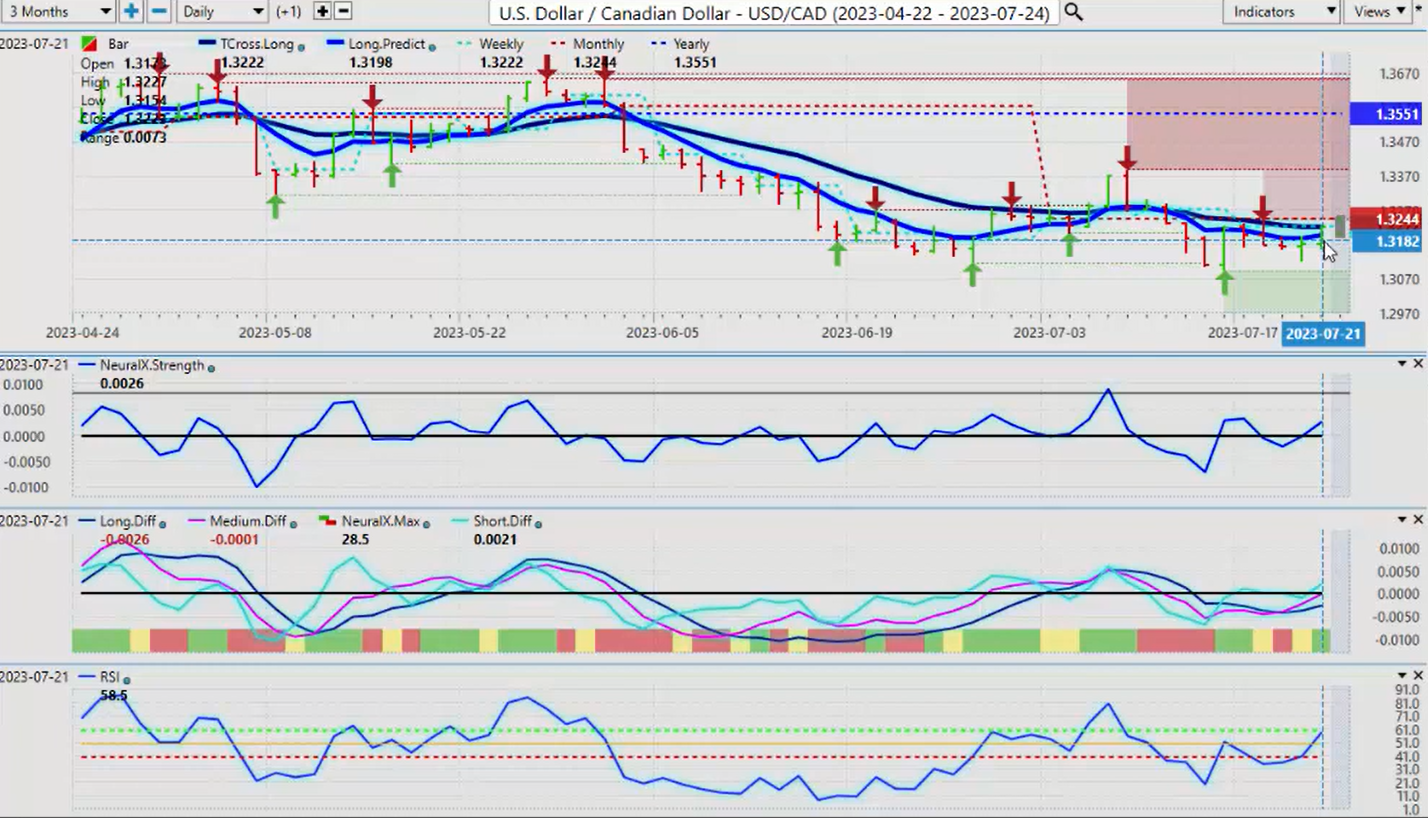
Now with the US Canada pair, let’s just go back up here and get it. Some of our equity base, despite the rally in the equity markets this week, the Canadian dollar couldn’t push lower. My view is the word on the street here in Canada, as I’m domiciled in Canada, is more pain with no gain.
The Bank of Canada, in my respectful opinion, huge mistake continuing to hike here. And again, the media, the economists in Canada are getting on board with this also saying, why do you continue to hike here? There’s no reason to, but that’s a separate argument. Right now, we have held below the weekly opening price and the monthly opening price, but this is clearly turning bullish here. If this seasonality in oil is coming to an end, then Canadian dollar strength is likely coming to an end. So the neural index strength next week is up. We’ve got a rising RSI. When it breaks above the 60 level, that’s looking even better. But that MA diff cross is again, warning us, if nothing else, don’t sell down here despite the Bank of Canada, because I don’t know if you guys have noticed, but after they do hike whatever currency it is, the currency sells off shortly thereafter.
The initial response is positive for the currency, but then it goes the other way. So for next week, we’re looking for this pair to break above the T cross long 1.3223. So if we have a sell off, for example, on Monday, then on Tuesday, that’s where you would look for your long trade because you’ve got a Monday, Tuesday reversal on this pair that occurs 90% of the time, regardless of the trend, et cetera. So keep that in mind. The Aussie, again, I’ve highlighted this level, this verified zone from the exact same day, June the 16th. Guys, this is where seasonal patterns, monthly seasonal patterns, weekly and daily seasonal patterns come into play here because this is incredibly repetitive. So again, is this warning us that the stock market is topping out here? Yes, that is possible, but we cannot dispute the fact that we’re failing at this verified zone at virtually the exact same date and time.
So right now, we’ve closed Friday below the T cross long 6746, but more importantly, we are unable again to hold above that yearly opening price at 6817. That is a problem for this pair.
Australian Dollar versus U.S. Dollar
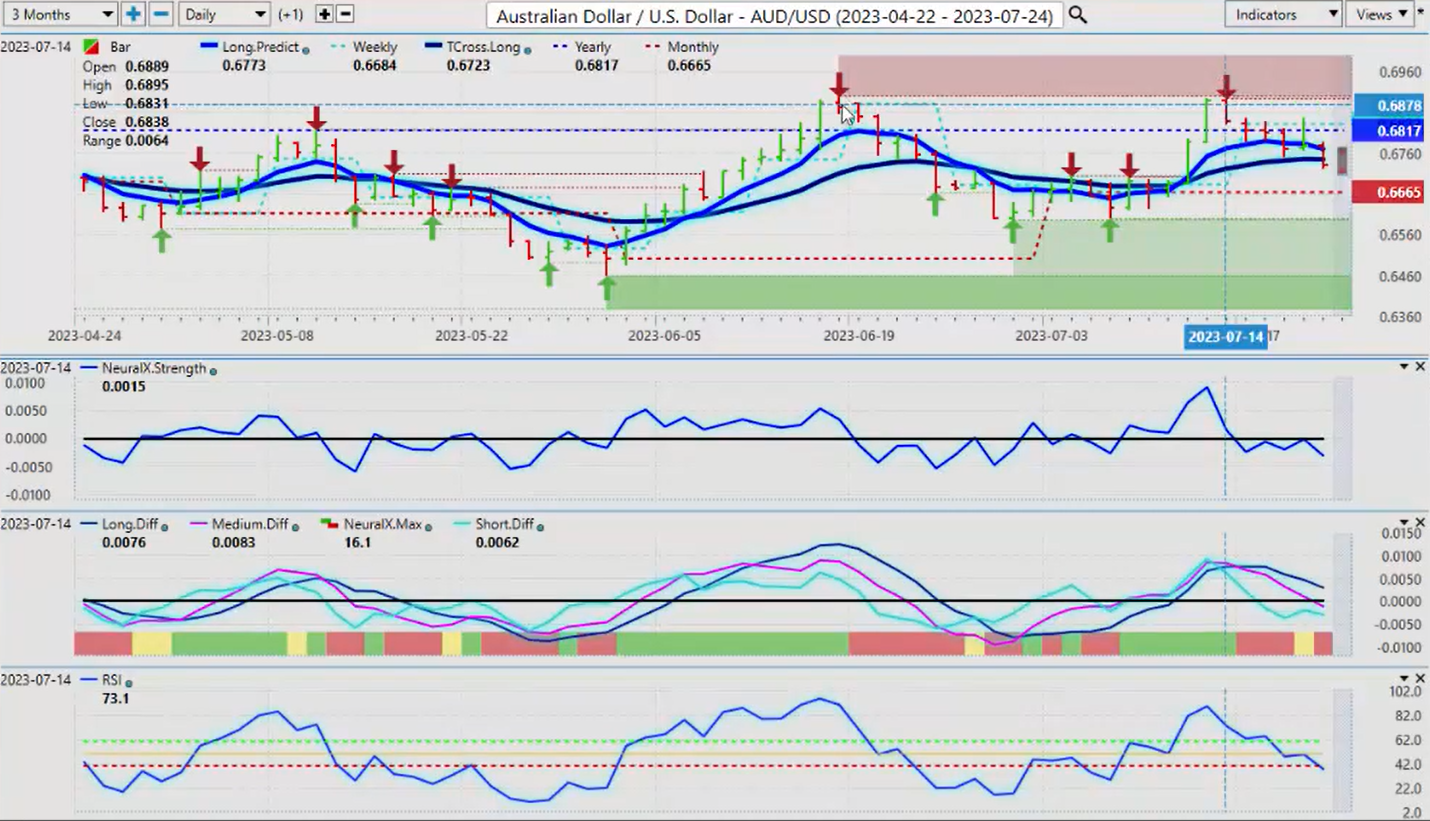
So again, the Aussie, the Kiwi have some of the highest interest rates out there. Is that helping their currency? No, it’s not because the R word comes into play, recession. So for now, we’ll continue to monitor this, but once again, when we look at the MA diff cross with the neural index strength, a falling predicted RSI, the neural index comes on board, and then we break below the yearly opening price. Guys, I’ve got, I had limit orders tagged all along here just underneath the yearly opening price. The second it goes below it, I want to be short. So again, we’ll monitor this next week, but the same thing is in reverse. The yearly opening price 6817, we need to stay below that level by Tuesday, Wednesday. If we do, then the Aussie is likely moving to 6665.
New Zealand Dollar versus U.S. Dollar
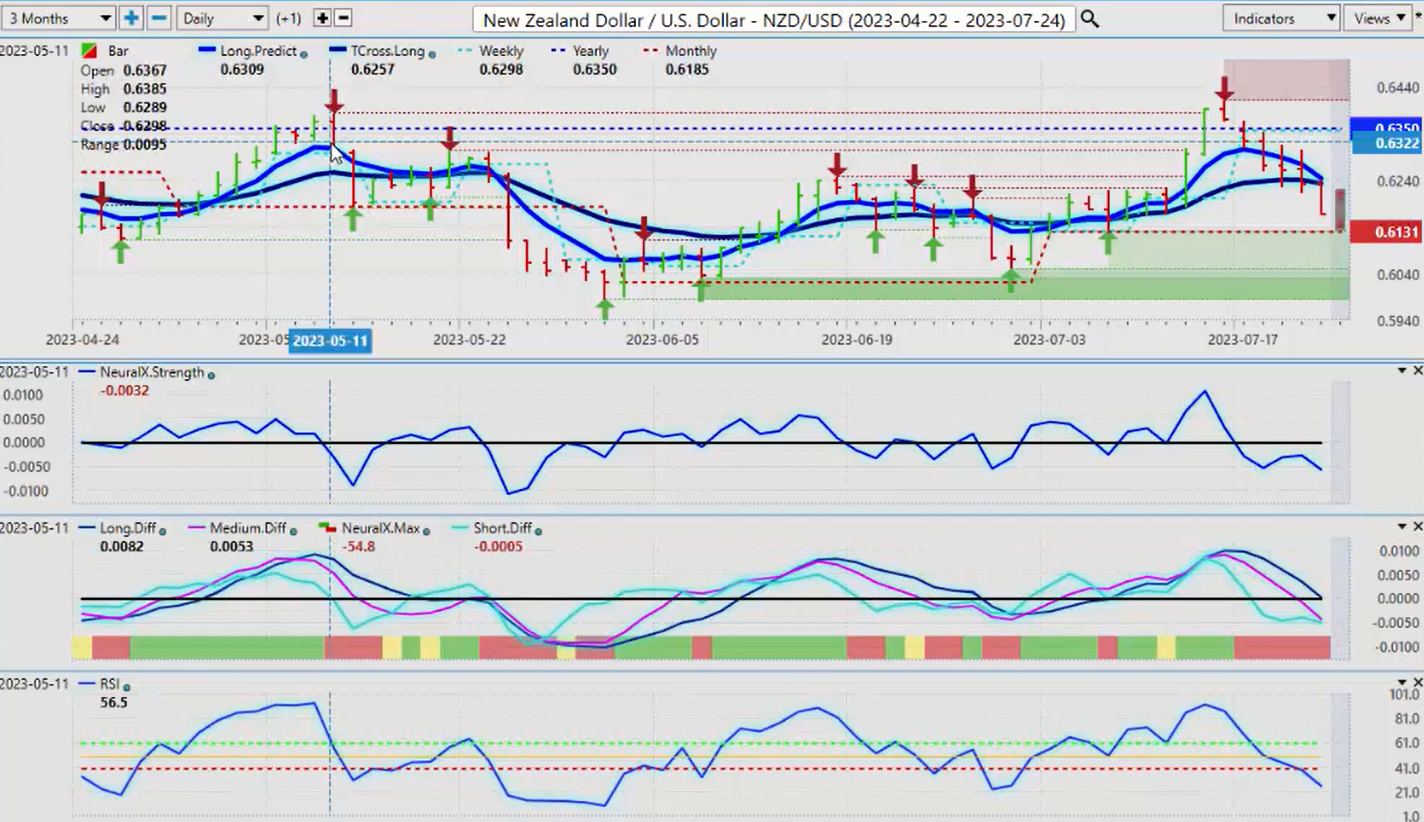
The Kiwi will follow the New Zealand guys. You can see it clear as day. This verified resistance high was back a little bit further in May, but basically at about the same time, there’s the 16th of June and down it goes, VantagePoints forecasting the same thing again. So again, these leading indicators, the MA diff cross, the neural index strength, have fallen, losing momentum, using the predicted RSI as it should be used, not for overbought and oversold guys here, but to gauge momentum in the market. Do we have momentum to keep buying this thing above the yearly opening price? The answer is no. So when it goes above it, you can say, okay, well, I’m going to put limit orders just below here. And then last week, once again, we leveraged that weekly opening price to validate these additional VantagePoint indicators with that particular setup. Again, validation is incredibly important, as is inner market correlations. So with that said, this is the VantagePoint AI Market Outlook for the week of July, the 24th, 2023