-
View Larger Image
Welcome to the Artificial Intelligence Outlook for Forex trading.
VIDEO TRANSCRIPT
Hello, everyone and welcome back. My name is Greg Firman, and this is the VantagePoint AI Market Outlook for the week of August the 14th, 2023.
SPDR SPY ETF ($SPY)
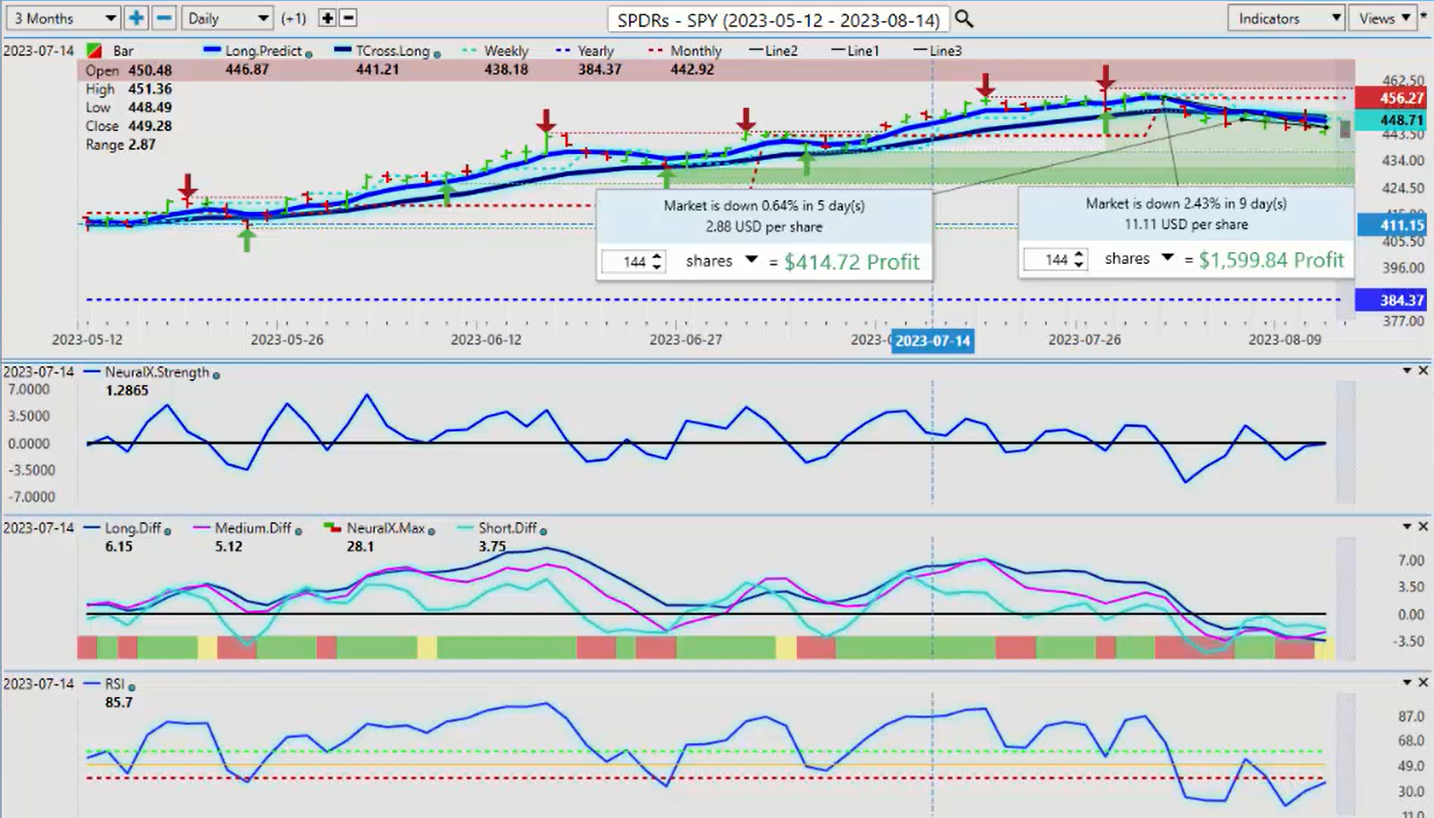
Now to get started this week, we’ll again do an accurate review of what the performance level of the SPYs are. Again, we want to avoid the rolling performance model here and make sure we’re staying current with our pricing because again, very important to help us point us towards those reversal points.
So if we look at the SPYs here, the last week here, not a good week at all. Down 0.64%. But again, we’re not up 0.78% here over the last month. We’re actually down 2.34%. So that’s a fairly large move for the beginning of the month. And again, when you’re using proper anchor points and an accurate way of determining what the performance actually is on the week, the month, and the year, then you have a much better idea of where things are sitting. So down 2.34%. When we look at the VP software here, we can see that we’ve got a medium term crossing our long-term predicted difference. We have a neural index strength that isn’t above the zero line, but it’s pointing to it.
Now, in my respectful opinion, only August is a very, very slow illiquid month. So I’m not looking for any huge moves here, but predominantly, the stock market I would argue doesn’t do the best in the month of September. And this could be an early start to this, but right now the indicators are pointing towards some type of reversal higher here. Now, the inflation data coming out on Friday, a little bit hotter there. That’s helped the dollar along, put a little bit more pressure on the equity markets. But again, in my respectful opinion only, I think it will be very difficult for any global central bank to continue to hike here.
So again, when we’re looking at those accurate performance at the beginning of the month, the beginning of the week, we get a much better idea of where any particular asset class is in the month, the week, and the year. So a firm uptrend on the SPYs and the S&P 500 that is indisputable in 2023. But you’ll remember back in March when they used that same rolling performance going back a random five days, random 30 days, random 365 days. And then they tried to convince us in March that we were in a bear market when in actual fact we were above the yearly and the monthly opening price and we were in a period of a seasonal pattern of known dollar strength. So again, we’ve got to be very, very cautious how we’re measuring the performance of any market.
S&P 500 Index
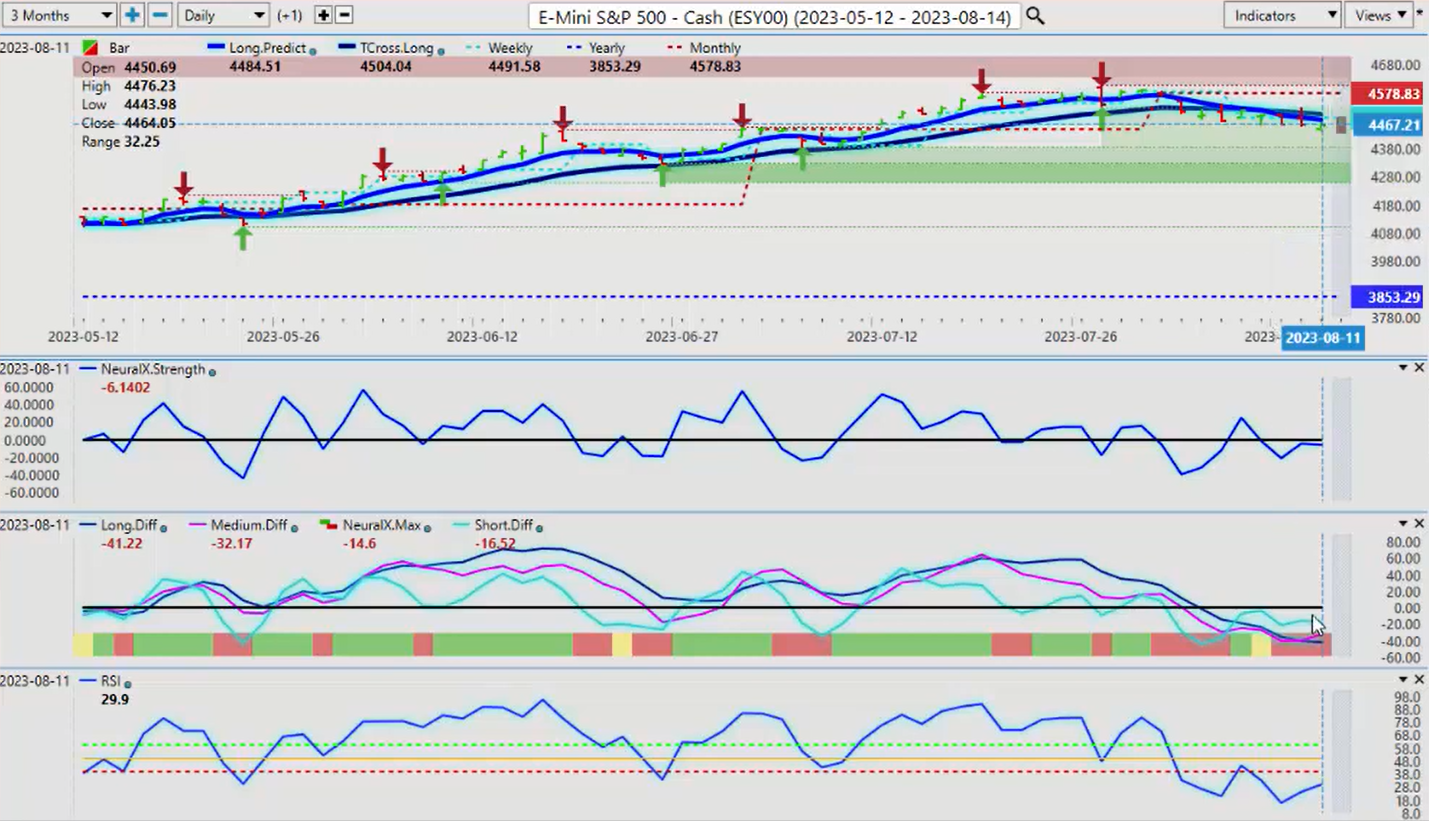
So when we look at the S&P 500, which basically is the SPYs, this is the future side of it with the S&P, so when we look at this right now, we can assess we have the same reversal signal forming. So in this particular case, I would look for the neural index strength to break the zero line, point higher, the neural index to turn, and then I want the market moving higher. Now our key main pivot areas are the T… I’ve included two this week so you can see them both. This is not a blue line and a black line. This is the long-term crossover. And again, I’ll show it. I’ve got a few emails from last week that I can go over this. This is the long-term crossover without the black line. Then I will take the triple MA cross and remove the shorter term predicted moving averages. So I’m using two of the core VantagePoint predicted moving averages. One for shorter term trading, which would be the long predicted. And one for longer term trading, which is the T-cross long. The theory is while below, we sell. While above, we go long.
So again, in my respectful opinion, for longs to be attractive for me in this month, I would like to see the market get back up above and the monthly opening price. And I don’t think that’s going to be an easy task with the inflation data, et cetera. But there is a warning sign that that is possible because again, we look at this when the markets are closed because this is an outlook guys, not a recap of something that’s happened last week or two weeks ago or a month ago. Each week we get set up for the next trading week based around the predictive indicators.
So right now the predictive indicators are warning that we’re running out of steam. When we again properly measure the performance at the beginning of the month, we can assess this and say, “Well, that’s a rather large move on the S&P 500 to begin the month to the downside at 2.69%.” Yes, I think it’s very reasonable that we could see some type of retracement back towards that monthly opening price and the indicators in VantagePoint are supporting that. Just be careful. Again, your Monday Tuesday trading, what we work on in the VantagePoint live training rooms is that Monday, Tuesday reversal don’t fall for whatever the price is on Monday because it very often reverses on Tuesday.
U.S. Dollar Index
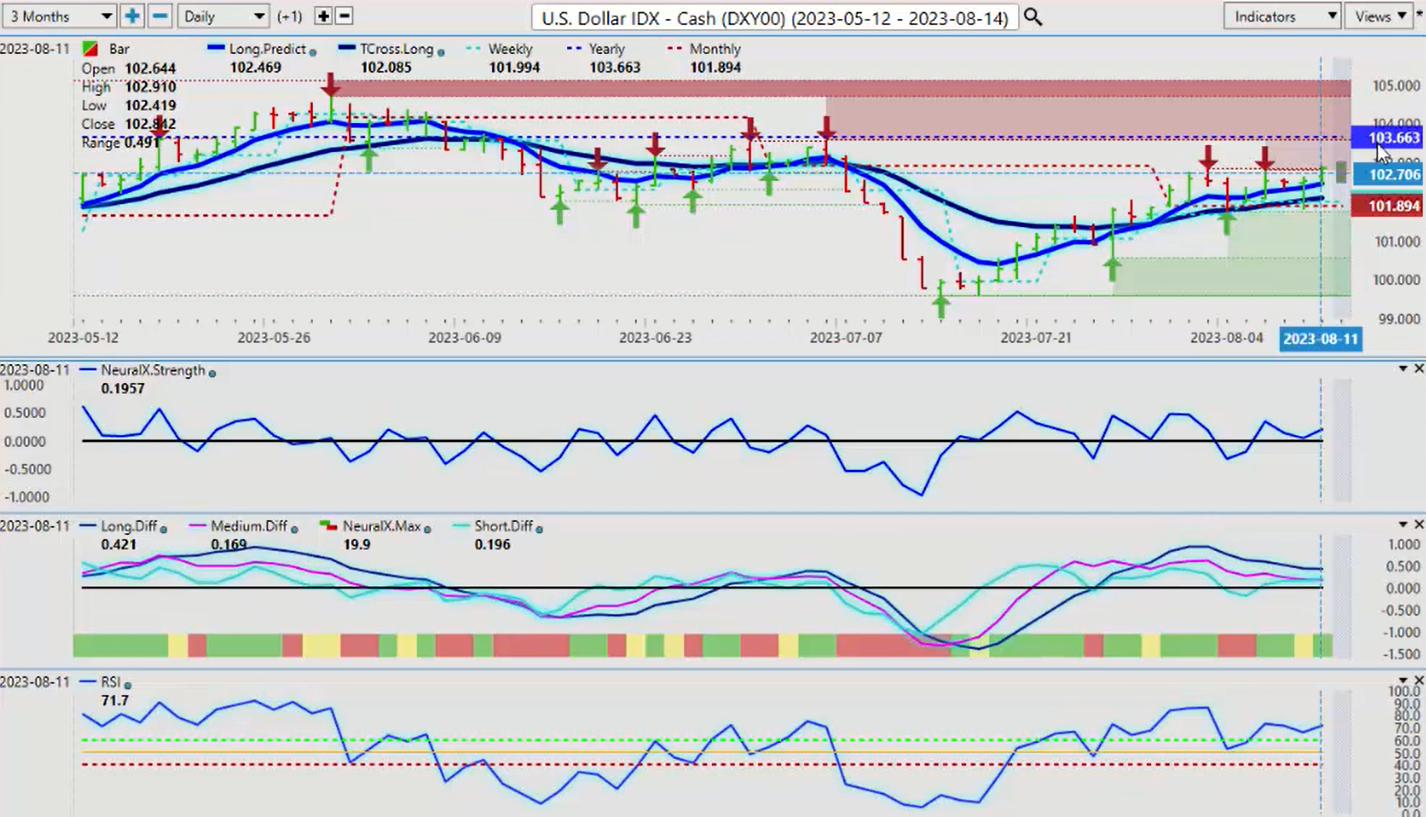
Now when we look at the market that really is driving everything, the dollar index, gold prices, equity prices, numerous commodities, the dollar got a lift, but you’ll notice on Thursday we came down and kissed the VantagePoint T-cross long to the number at 102 and we bounced off of that and we’ve started to move higher. Now the dollar, you can see the factual performance guys, the year to date performance. I don’t care what happened 365 days ago from today. It’s not relevant, guys. What’s relevant is where we are in the calendar year and 103.66 is the yearly opening price. I believe the dollar could challenge this next month, but not this month.
Barring some sort of comment from the FOMC, I have no control over that, but right now I believe you will see sellers coming out of the woodwork here if we approach this level. So our key supports levels now this week, the long predicted, which you can see is highlighted by the AI symbol 102.46. And on the T-cross long, we’ve got 102.0 8. And then we in turn have closed at about 102.84. So a very bullish close. But be careful, we’re coming up against this T-cross long .and again, this is the exact same level that we saw where the dollar was trying to break down back in March, but that didn’t come to fruition. The dollar reversed and went lower as the stock markets took hold.
So the indicators, very mixed here. Our neural index strength is pointing up, I like that. But our predicted differences are very mixed. And the neural index itself is mixed with a yellow sign here. But again, we’ve had a retracement to the 50 level on the predicted RSI and we’re rebounding higher. So the dollar in most cases does not fare well the week after the non-farm payroll number. But the PPI has given it a bit of a boost. We’ll see if it can carry those gains into next week, but I think it’s a rather tall order at this particular time based on a very mixed bag here of indicators.
Light Sweet Crude Oil
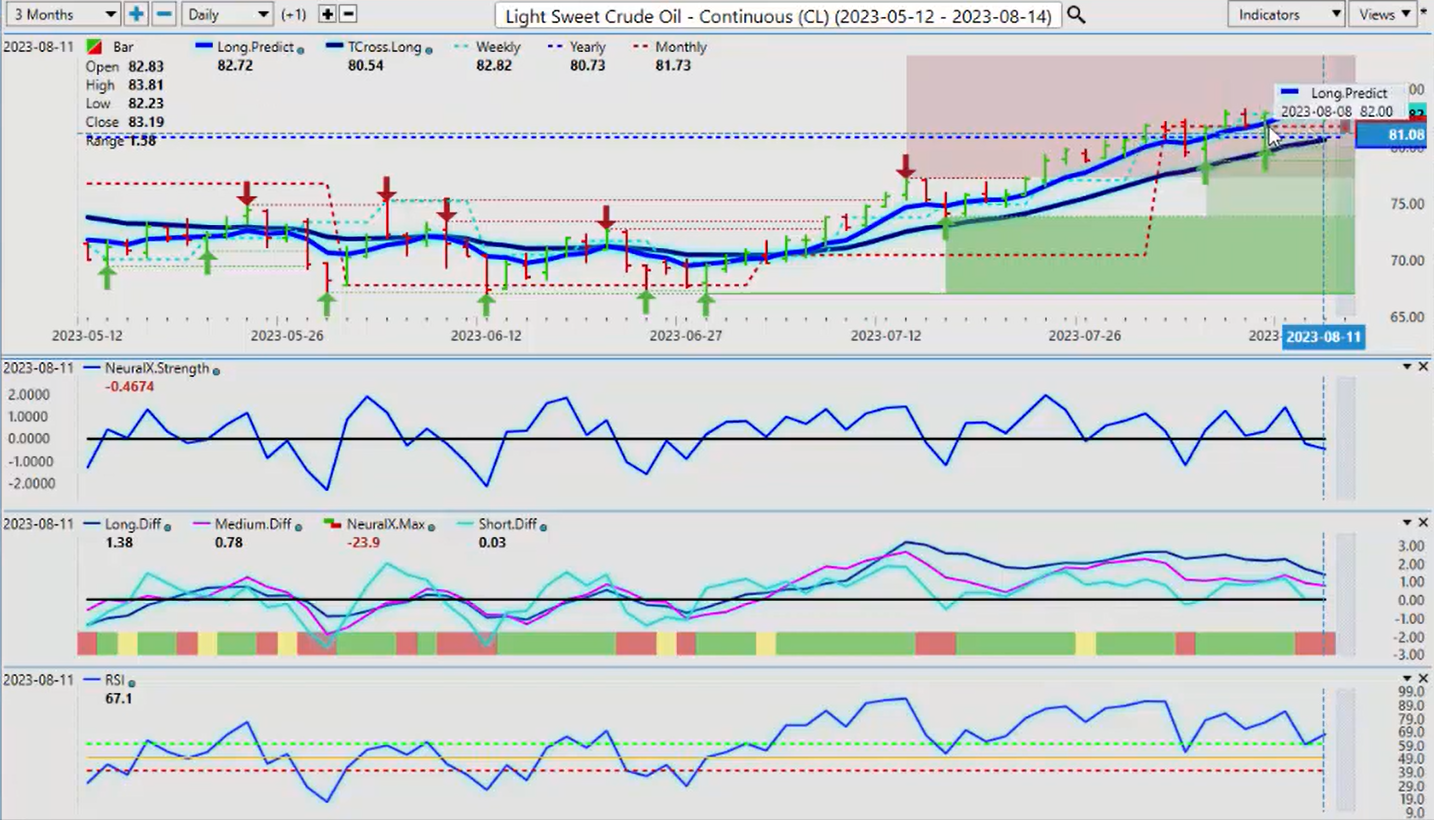
Now, Light-Sweet-Crude-oil, when we look at crude oil going into the week here, once again that’s VP plus. Let me just go back to our daily timeframe here. So on our daily timeframe with oil, once again, oil has turned positive on the year. But as you can see, we’ve been up here before this year guys, and it’s struggled at this level. It’s failed. So once again, I’m not in the camp of a soft landing. I believe if they keep these rates this high, it’s going to be a hard landing and a recession. Yes, I absolutely could be wrong, but I’ve seen this movie before guys, and it’s concerning. Even leaving the rates up at these levels is going to be problematic for a number of companies and the general public alike. So right now oil is banking on that, that there will be a soft landing and it will be business as usual, but I would be very cautious.
The VP indicators here, and again the neural index strength, I’ve talked with this with a number of you guys, it’s a fantastic indicator. The worst thing you can say about this indicator is it’s always early guys where a lot of other indicators are not. So right now, at the very least I anticipate we will retest that T-cross long. But a point of interest here again guys, the yearly opening price, the current correct yearly opening price is intersecting with the VantagePoint T-cross long at 80.54. If you believe as I do there’s something a little off here, then you would’ve sell limit orders set up just below the T-cross long because if and when it breaks down below that, you will see likely a very violent move to the downside. Is it possible that’s going to be next week? I think it’s unlikely, but I think we will see it that a bigger move down in mid-September and mid-October.
Gold
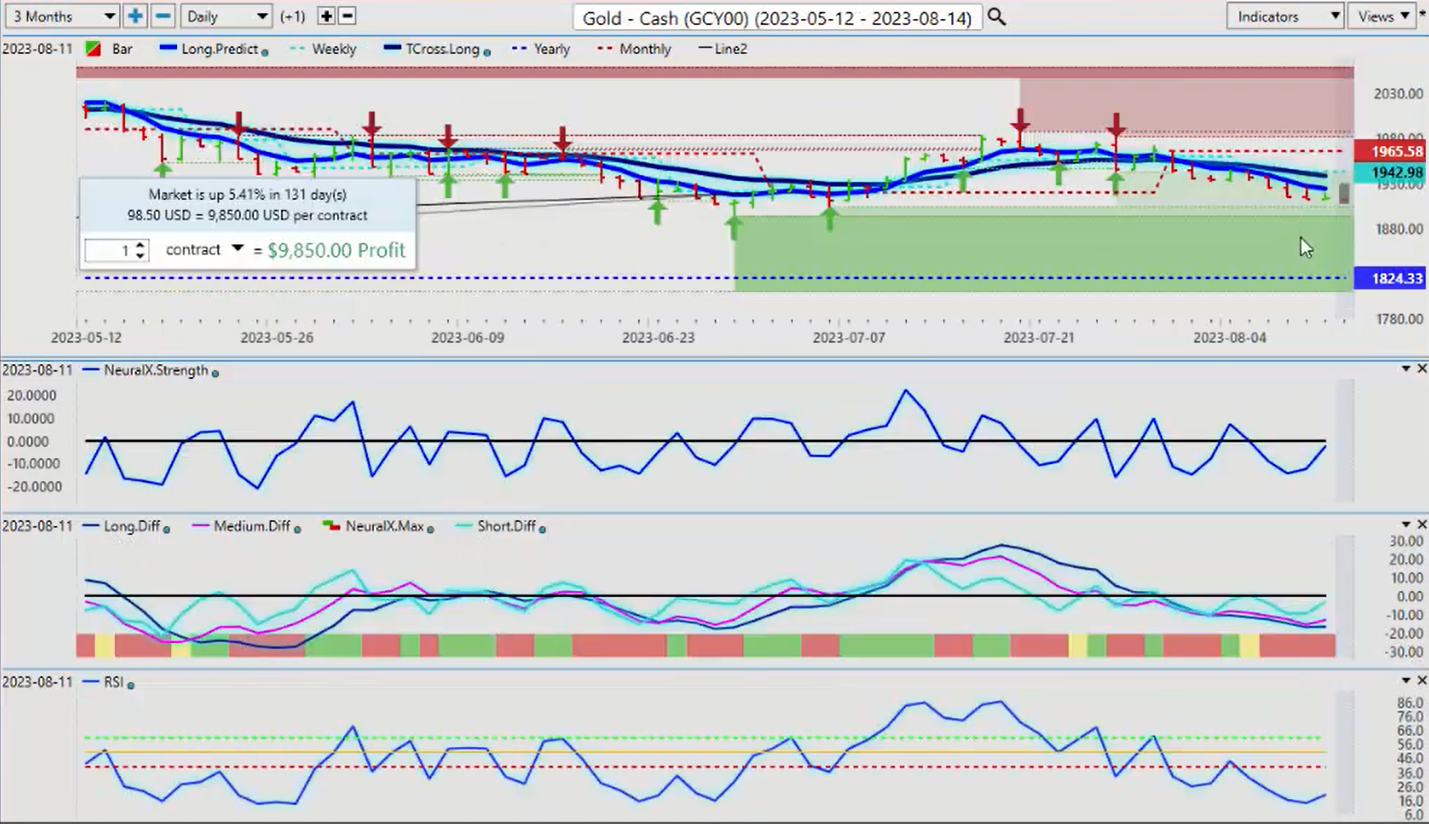
Now, when we look at gold prices here again, gold remains in a firm uptrend on the year guys. The yearly opening price is 1,824. Until such time as it breaks down below that yearly opening price, gold longs are still viable. Again, if a recession does, it’s not a soft landing, then you will see gold prices spike. Gold down a little bit again on some of that inflation data. But right now, again, that neural index strength, you can see the actual neural index is red, but the neural index strength is showing a completely different signal here. So having the ability to see inside that neural index is extremely powerful in my respectful opinion. So right now it’s warning that potentially gold’s moving higher. So that would tell us that likely the dollar would struggle next week. These indicators, the predicted differences, the predicted RSI, all starting to show signs of a turnaround is imminent.
Bitcoin
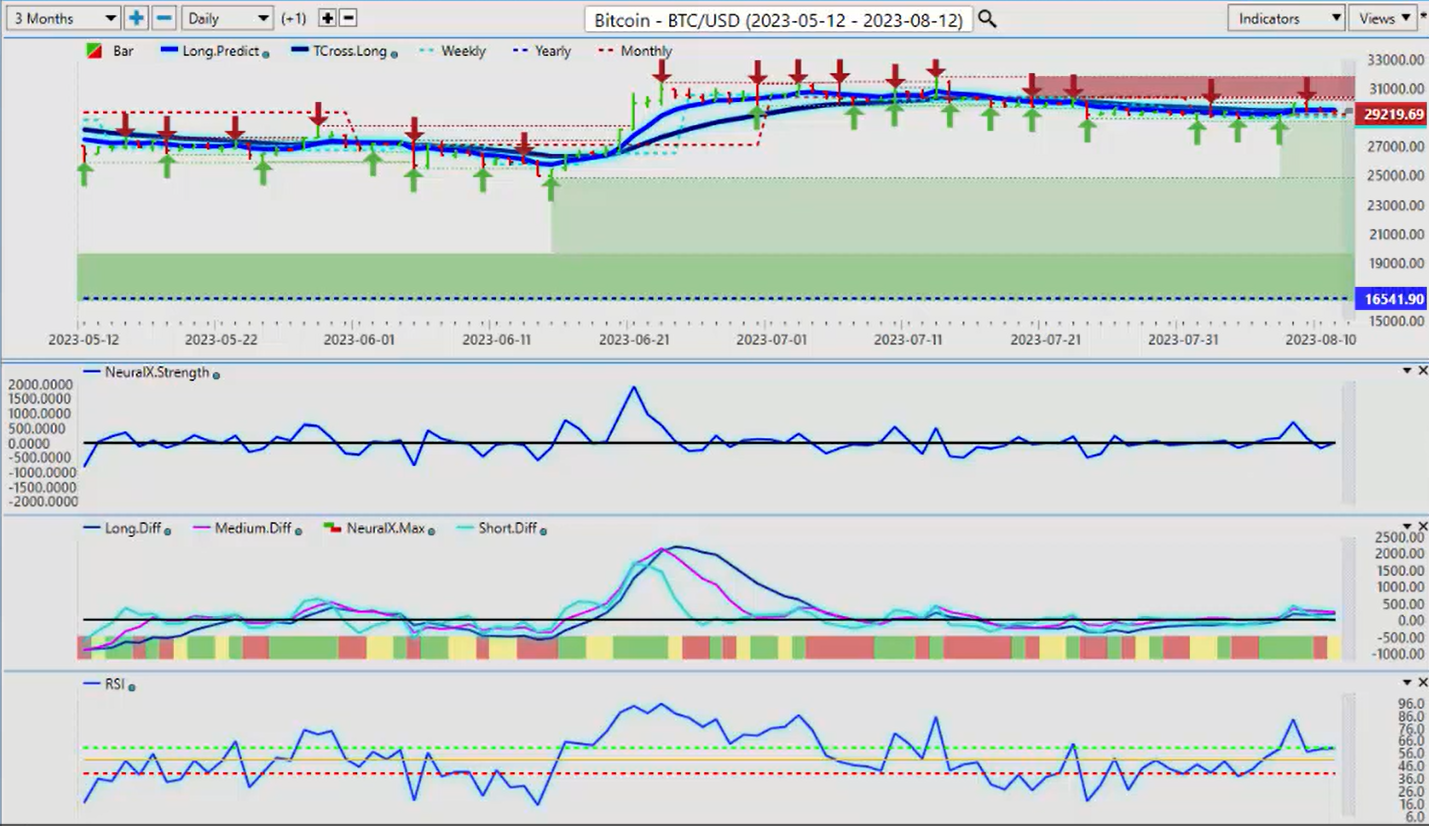
When we look at Bitcoin, once again here guys, I think we’re still about a month away from a very strong seasonal pattern in Bitcoin. So a move lower would certainly not surprise me. But either way, mid-September to mid-October, early November at the latest has proven to be a very good buying period for Bitcoin versus the US dollar. So that means Bitcoin related stocks like Hut 8 Mining, maybe Hive, a number of different traits can spin off Bitcoin going higher. So again, right now we’re just basically running sideways on the main contracts here. The neural index strength pointing up again, yet another indicator of potential dollar weakness is coming. And the predicted RSI is sitting at the 60 level, the breakout point.
Again with the predicted RSI or any RSI, I do not look at overbought and oversold. I’m looking for momentum in the market. A break of 60, a sustained break of 60 tells me I have upward momentum. A sustained break of the 40 level down here would tell me I have downside momentum. So you can see that while Bitcoin comes along and tests this level, it has a great deal of difficulty staying above it, but it’s also struggling staying above the 62. But again, there is a seasonal and it’s not that far away. Maybe a month.
Euro versus U.S. Dollar
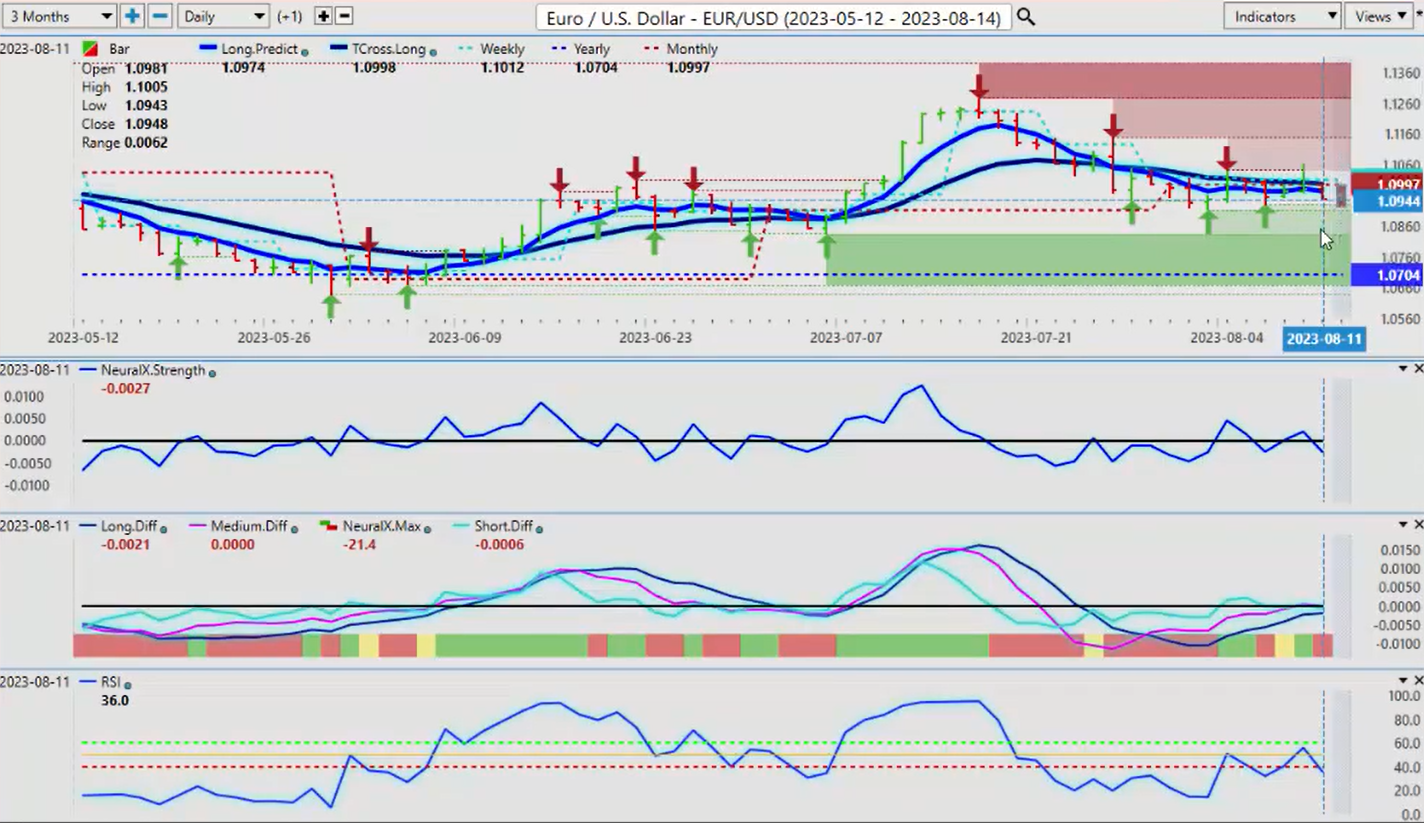
Now when we look at some of our main Forex pairs, again the euro under pretty good two-way action this past week. But once again here guys, as you can see that an accurate way of measuring performance of something with the monthly and the yearly and the weekly opening price, you can see how the monthly opening prices provided an excellent opportunity to short this for the last several weeks. Now the beauty of the monthly opening price in this case is that we have the T-cross long for additional resistance.
So once again, if we think that the dollar’s going higher next week, because again, this is an outlook guys, not a recap of something that’s already happened, if we look and we see a break of that T-cross long and the monthly opening price, we have the monthly at 1.0997 and the T-cross long at 1.0998. So I would look to see by midweek, by Tuesday, Wednesday if we can stay above these two levels. If we do, then we know we’ve got a long trade. The predicted differences are pointing higher. There’s actually a crossover there on the medium term, but the neural index is still down. The RSI is problematic, so I don’t think we’re going to see that breakout to the upside. There’s a 80% chance we won’t see it on Monday, but Tuesday and Wednesday is when real trading kicks in.
And again, watch these two levels. And if we break that level… Or the other thing you can do is simply tag limit, buy orders above the monthly open in the T-cross long around 1.1010, something along that area. And if it breaks above that, then basically again, that’s the benefit of having the predicted moving averages. So we know where these levels are and we can trade off them and we can essentially let the market come to us.
U.S. Dollar versus Swiss Franc
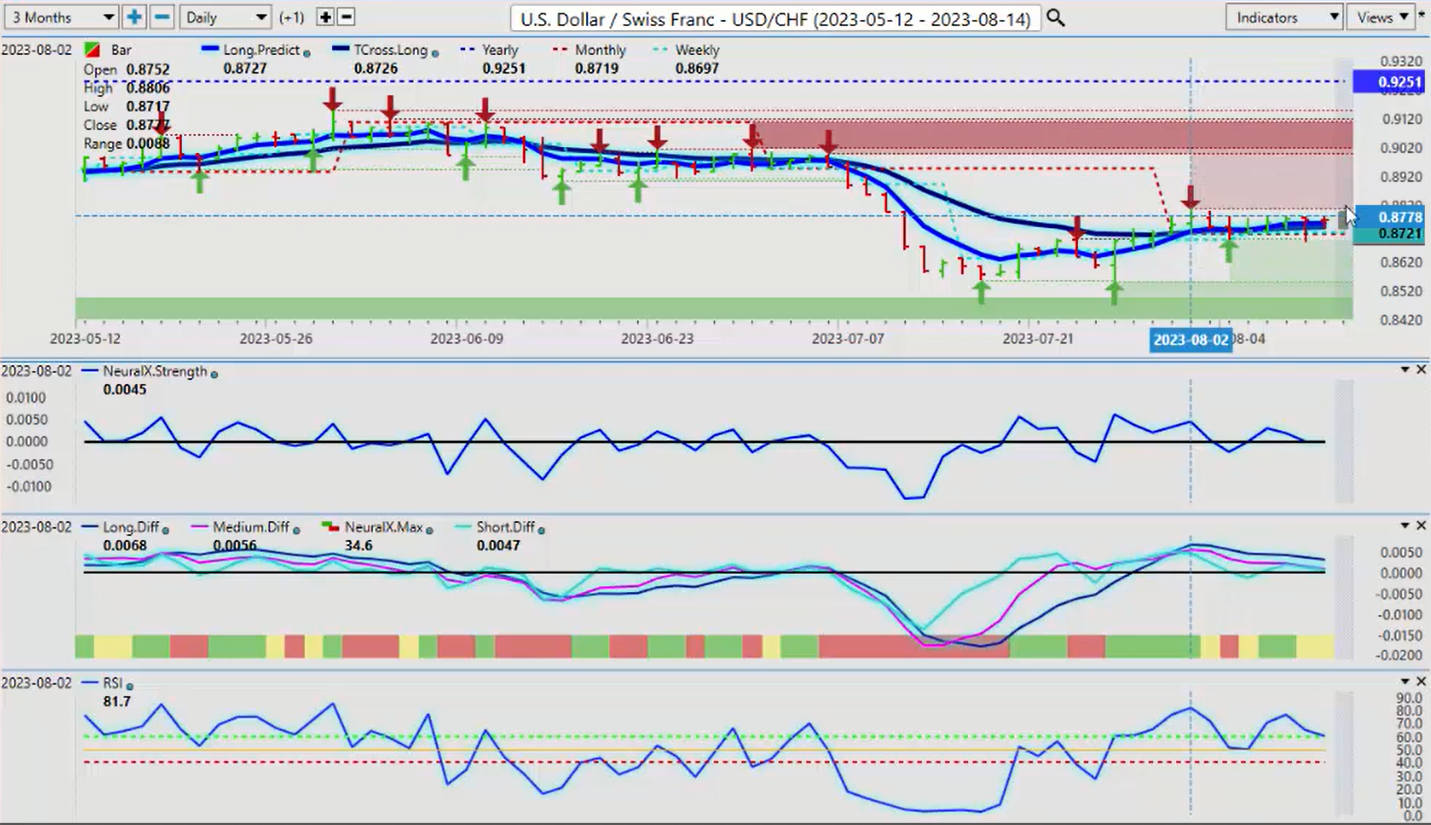
Now if the dollar tanks next week, or not tanks but sells off somewhat, we see some profit taking, some questions on rate hikes, then US Swiss franc, the dollar has really been beaten up by the Swiss franc over the last four or five years. So I’m not expecting any big move to the upside here yet. Potentially in mid-September is when I would look for it. So for now our verified resistance high, 0.8806, we would need to break free and clear of this level. Now, right now you can see again the 0.8719 area, the monthly and the weekly opening price. But the monthly opening price is really the big one here. And you can see using that monthly opening price, an accurate 30 days.
I don’t want to go 30 days from the middle of August to the middle of July. That would be redundant guys. It would be lagging huge. This current monthly opening price is the only thing that’s keeping this thing up. So the second, again, another way of playing this is tagging sell limit orders below the monthly opening price at 0.8719. If we break down below that, then we know we’ve broken down below the T-cross long at 0.8742. Then that would open the door back up for likely a retest of the lower 0.8553.
Now, the other flip side of that coin to give something to the bulls and the bears, the other way we can play this is put buy limit orders above the verified resistance high at 0.8806. If we clear this, then we could have a long. So again, when you identify both sides of something, I’ll leave it to you guys which side do you want to take. I’m slightly negative on this pair because of the trend over the last several years and the trend this year using an accurate yearly opening price, 0.9251. It’s very bearish. So again, the trader can make the decision, but it’s important to have all the information in front of you.
British Pound versus U.S. Dollar
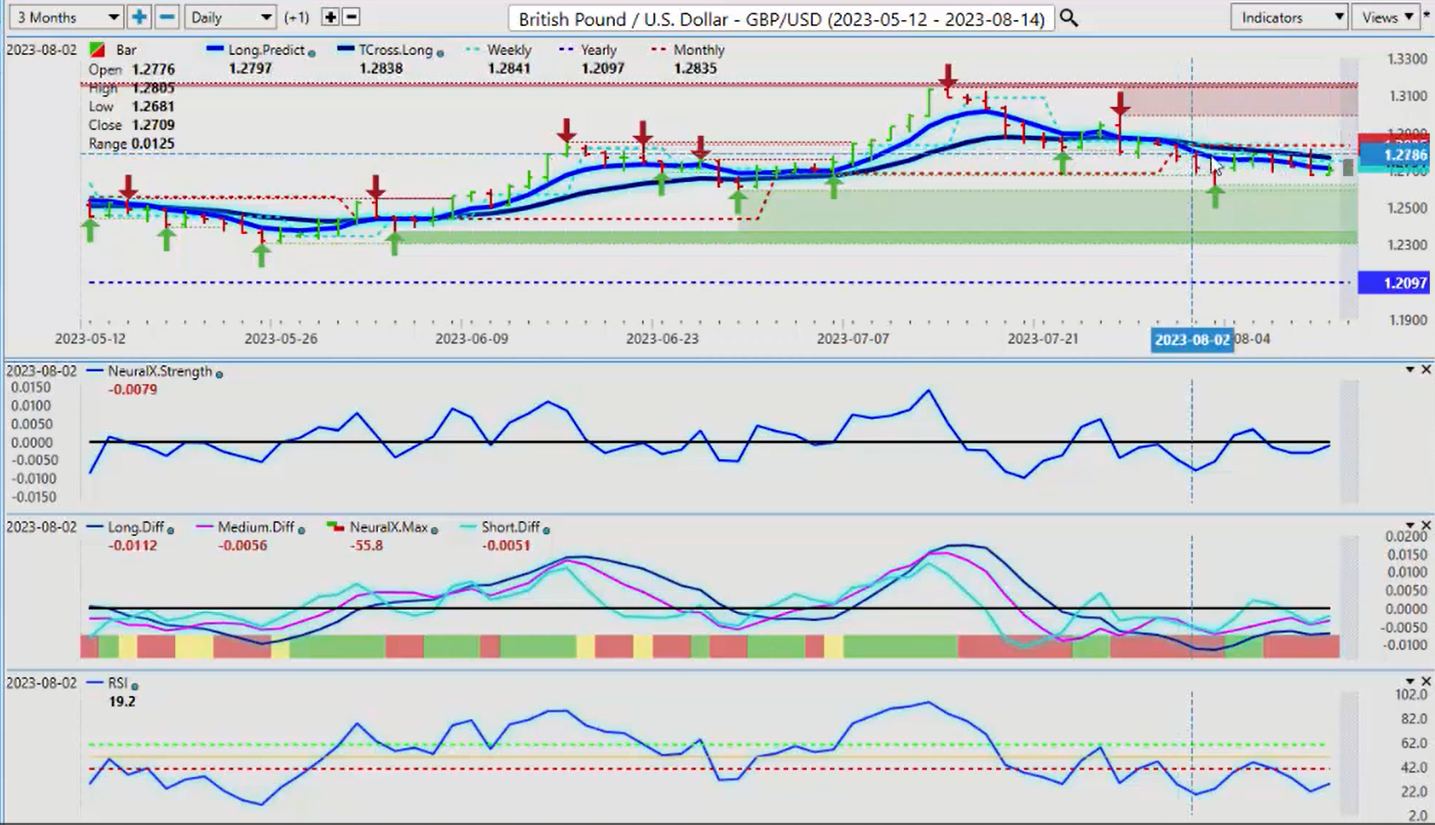
Now, the Pound-Dollar, once again, the Bank of England totally backpedaling on those rate hikes. So that’s hitting the pound, which I suspected it would. And once again, when you’re using that accurate monthly opening price, you can see that it very often rewards you on a daily basis. I have no bias whether something goes up or down. I trade what I see guys, not what I hear, right? But if you’ve got a lagging rolling performance model in place, that could be problematic because you wouldn’t even see these particular levels. So again, you’ve got essentially six days in a row of shorting into the monthly opening and the T-cross long.
I will also respectfully submit when I’ve seen the T-cross long break down below the monthly opening price, it’s very often quite bearish of a signal. So again, giving something to both sides. The other way we can play this is stay with the primary trend on the year, which is up 1.2097. You can put your buy limit orders above the monthly opening price at 1.2835. Easy-peasy guys, right? So again, when we cross-reference that to the indicators, their neural index strength is starting to rise. The predicted differences are starting to rise, as is the predicted RSI. So there is still hope that this payer can go higher, but my optimism on that remains guarded at this particular time.
U.S. Dollar versus Japanese Yen
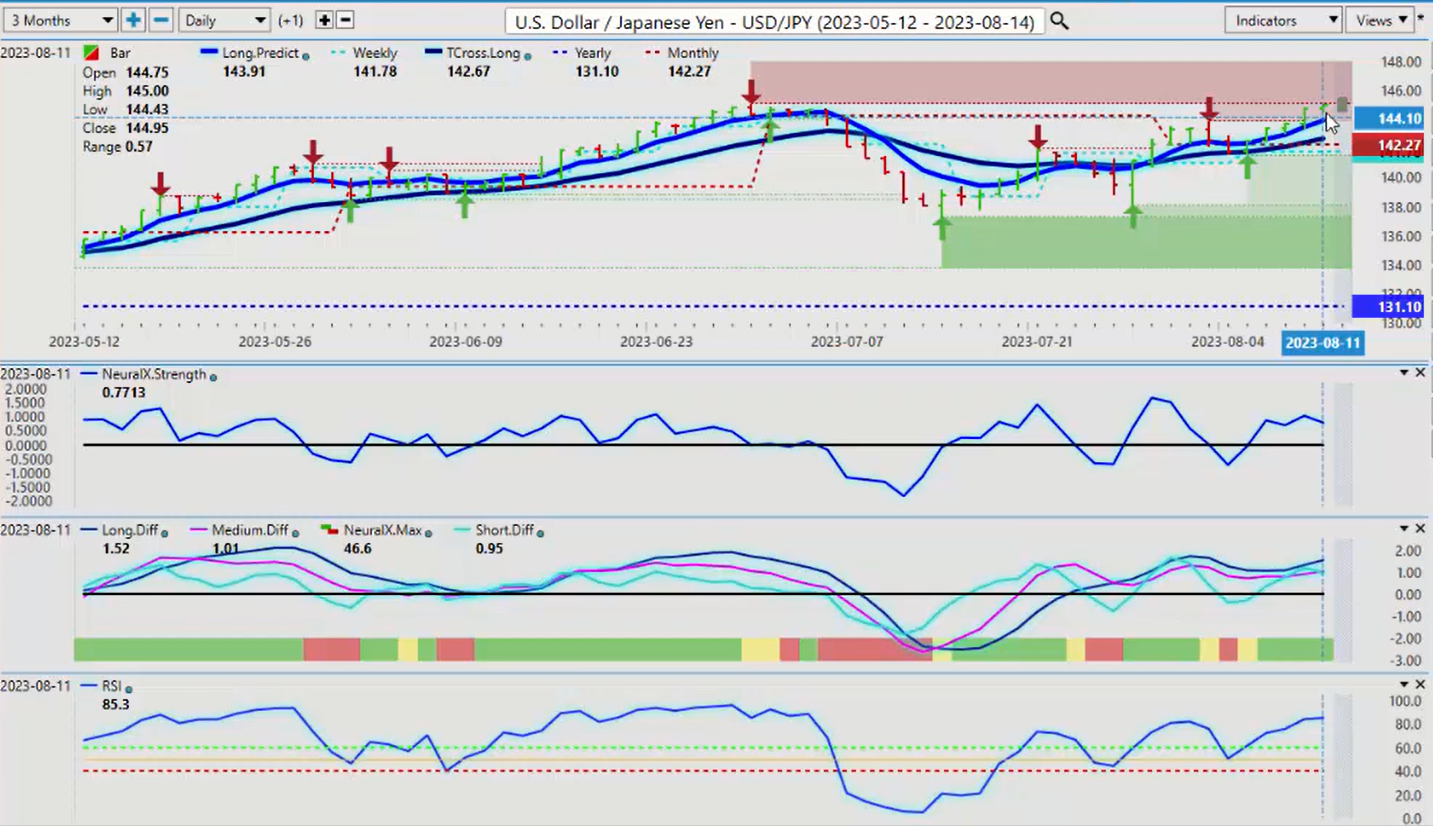
Now, the Dollar-Yen this past week, the very hint of higher inflation, potential rate hikes expands that potential interest rate differential between the bank of Japan and the Fed. So with that carry trade still on, we would need some type of risk off condition to strengthen the yen. And as of right now, we don’t have it. So the best I can offer up for the coming week is the verified resistance high at 145.07. You can see that the market came up to that on Thursday, backed away from it, but then came right back up to it on Friday.
So again, a high risk long area up here, but the current interest rate situation supports longs, even though I can’t believe we’re at 145 on this pair when just a year and a half ago the Bank of Japan was concerned about it breaking below the 100 level where they actually intervened in the markets, where another example of central banks causing these kinds of problems, where they should have just said nothing, and instead they intervened and then the COVID lockdowns and it just blew up, right? Next thing you know, the Dollar-Yen’s at 150. So it’s been many, many years since I’ve seen it anywhere near this area. But for now, we’ll watch that area. The indicators are very much neutral here, that verified resistance high. We need a sustained break of that level in order to stay long.
U.S. Dollar versus Canadian Dollar
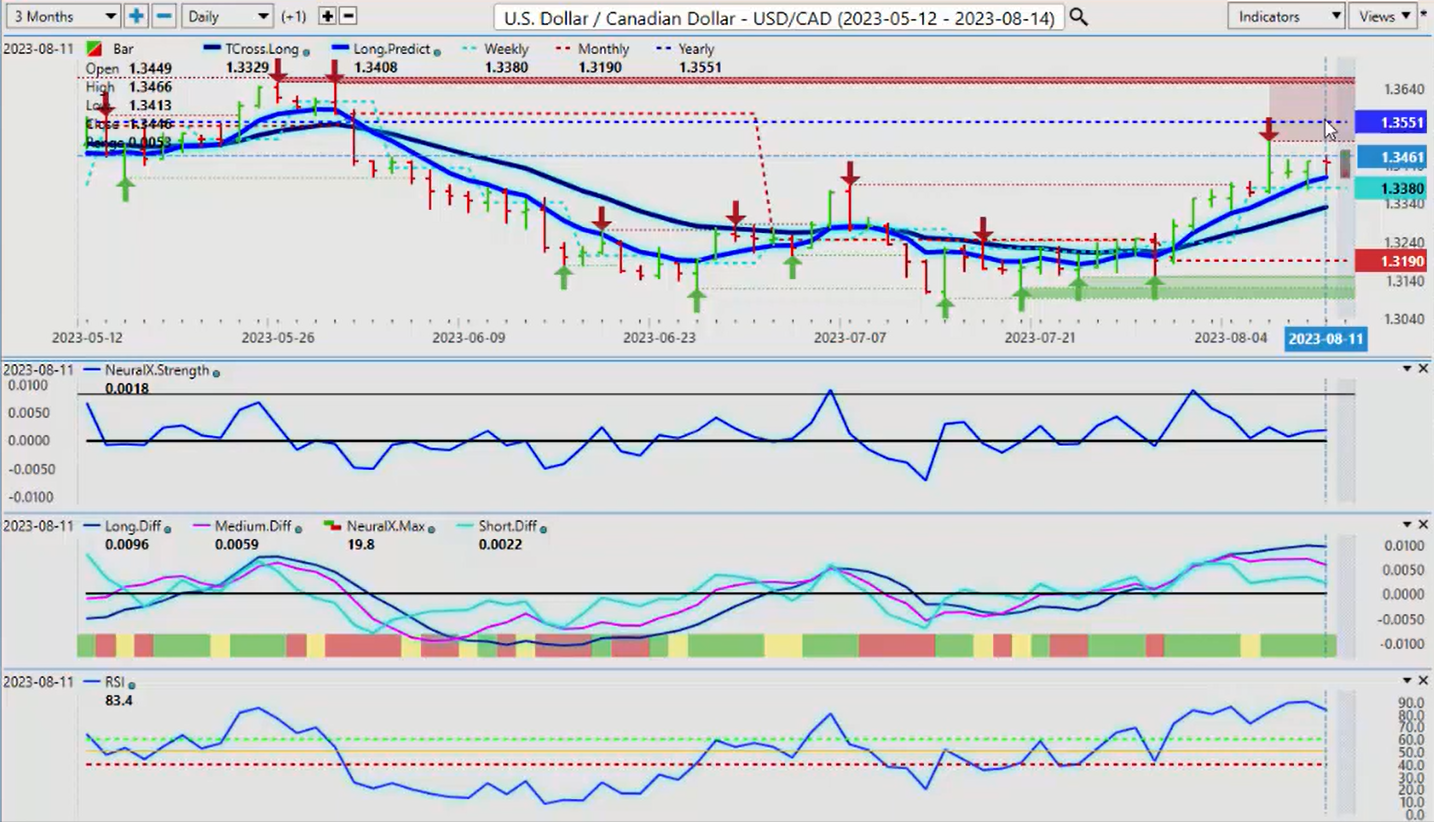
Now with the US-Canadian pair, once again, there was a holiday in Canada last Monday and a lot of people didn’t know that and they were jumping in on the market on the short side based on a number of bank reports saying that there’s no way that US-Canada is not going to blow through 1.35, 1.36. The second I saw that bank report guys, I immediately took the short side of that because I can’t remember a single date and time when a central bank has done anything to help anybody, except themselves of course. So again, when we look at this, we have to say, “Okay, we did come up, but using that accurate yearly opening price at 1.3551, the bank or the reports probably were again using that lagging rolling performance, a random 365 days, a random 30 days, a random five days.”
No guys, we need anchor points. The beginning of the year, the beginning of the month, the beginning of the week. I know I sound repetitive when I say this, but I’m trying to reinforce that point with very strong examples of why it’s done that way. Because again, we need to stay current. So right now I can see exactly where that is. And the second it started getting close to being positive on the year, somebody came in and shorted this thing pretty very strongly, I might add, while at the same time the Canadian dollar was losing ground against the Euro, the Euro-CAD cross pair. S.
O again guys, we’ve got to trade what we see here, not what we hear. What I’m seeing here is no buyers near the 1.3550. So the indicators are mixed, but the neural index strength running sideways are predicted difference. We do have a cross to the downside and that is concerning. But if oil prices remain higher and the S&P turns around, because again, the accurate pricing of being down 2.69% on the month, then a retracement, that would be enough to push US Canada back down to the T-cross long at or about the 1.3329 area. Now, that same bank report said that under no circumstances will the US-Canadian payer go above 1.33. Again, Bank of Nova Scotia in that report, within minutes, hours it blew through 1.33 like it wasn’t even there, guys.
O again, when we look at these indicators, in my respectful opinion, VantagePoint nailed this one. And looking at the VP software, looking at the accurate monthly opening price, my view at that time as we did in the live training room is that this will easily blow through 1.33, which it did, but it will not easily blow through 1.3550 or 1.36 as they are now suggesting. So keep an eye on your stocks, keep an eye on your equity or your equity markets and your oil futures, your RBOB. If they’re healthy and they’re doing good, then that will strengthen the Canadian dollar guys.
Australian Dollar versus U.S. Dollar
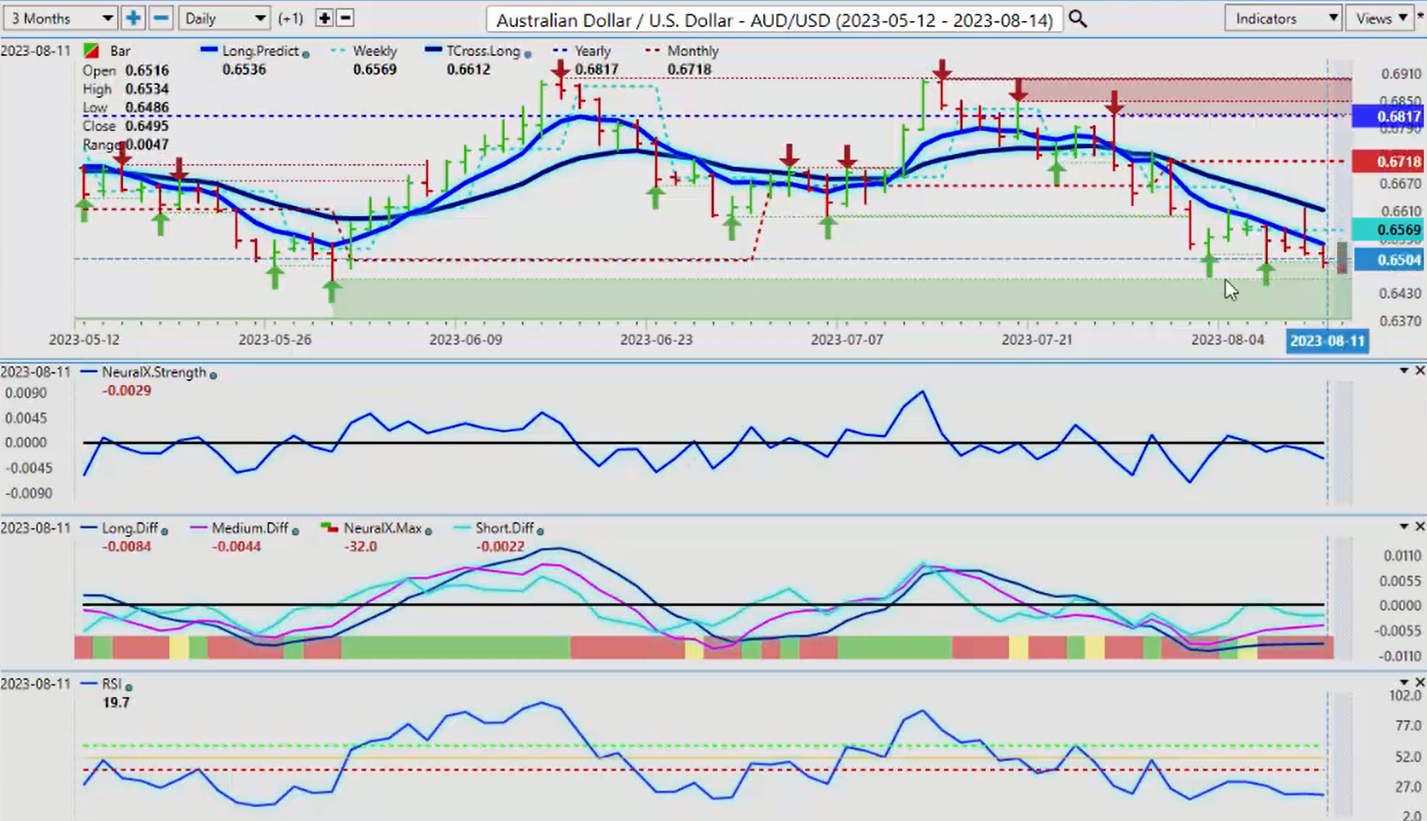
Now, the Aussie and the New Zealand, again, very similar trade, which I think a lot of people think they’re different. But again, right now it’s got some problems here. The Aussie’s and the Kiwi both have some problems. But we’re coming into the verified support low going back to May the 31st of this year. So we will see if this level will hold. I believe it should, but it needs help from commodity prices and the equity markets, more specifically the S&P 500. If they rebound, maybe we can get some life back into this. But this is, again, only in my respectful opinion, guys. This currency is undervalued.
So I’m not saying it’s an easy long, there is nothing in easy in trading, but I am watching these VantagePoint indicators very closely for a potential long trade here. But right now, that’s the level you need to keep your eye on next week. That low is 0.6459. We’re going to see if that can hold. But be very, very cautious of a bear trap down here. I can’t even tell you how many bull and bear traps. Not to mention the one we did. Remember this one we did just last month guys, when this was extremely bullish. The signal was bullish, but it’s got to clear the other verified zone and it didn’t and it’s falling. It’s basically the pattern of the market repeating itself, very much like the dollar cycle I talk on here at the beginning of the month. So I’m expecting some dollar weakness here.
I got a little bit last week, but I’m looking for more. So if I do get that, we could see this pair could be a good place to buy. The Aussie, very similar situation, but the indicators are just not there yet.
New Zealand Dollar versus U.S. Dollar
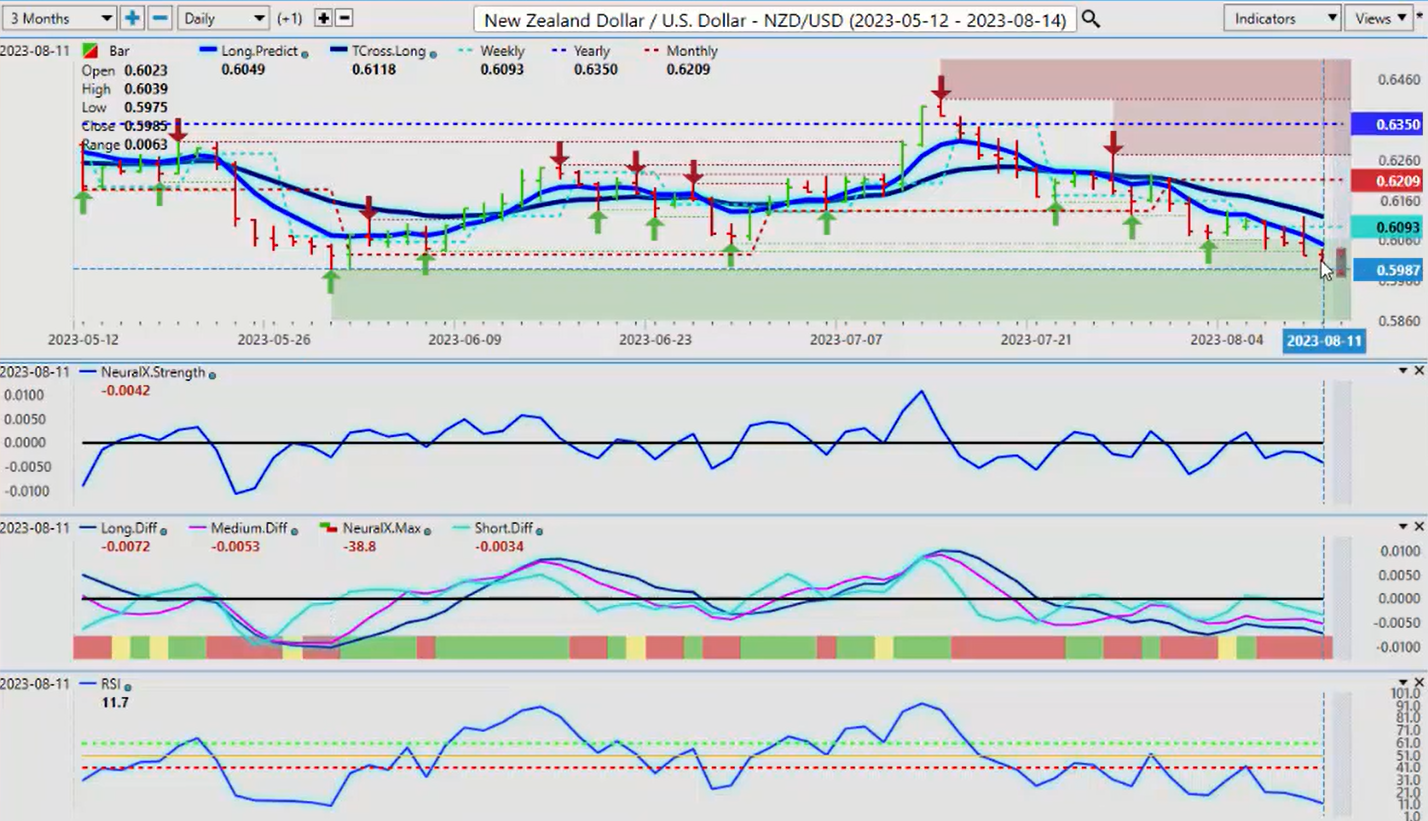
The Kiwi is on its verified zone, low. That verified low 0.5985. So again, we’re closing rate on that number. So this one, again, be very cautious of a bear trap down here. We get a big push down on Monday. Then Tuesday, Wednesday, Thursday, it violently reverses higher. Be mindful of that. That’s my tip to you for the week. Be careful of these bull and bear traps in the month of August in low liquidity.
So with that said, this is the VantagePoint AI Market Outlook for the week of August the 14th, 2023.