-
View Larger Image
Welcome to the Artificial Intelligence Outlook for Forex trading.
VIDEO TRANSCRIPT
Hello, everyone and welcome back. My name is Greg Firman, and this is the VantagePoint AI Market Outlook for the week of August the 28th, 2023.
S &P 500 Index
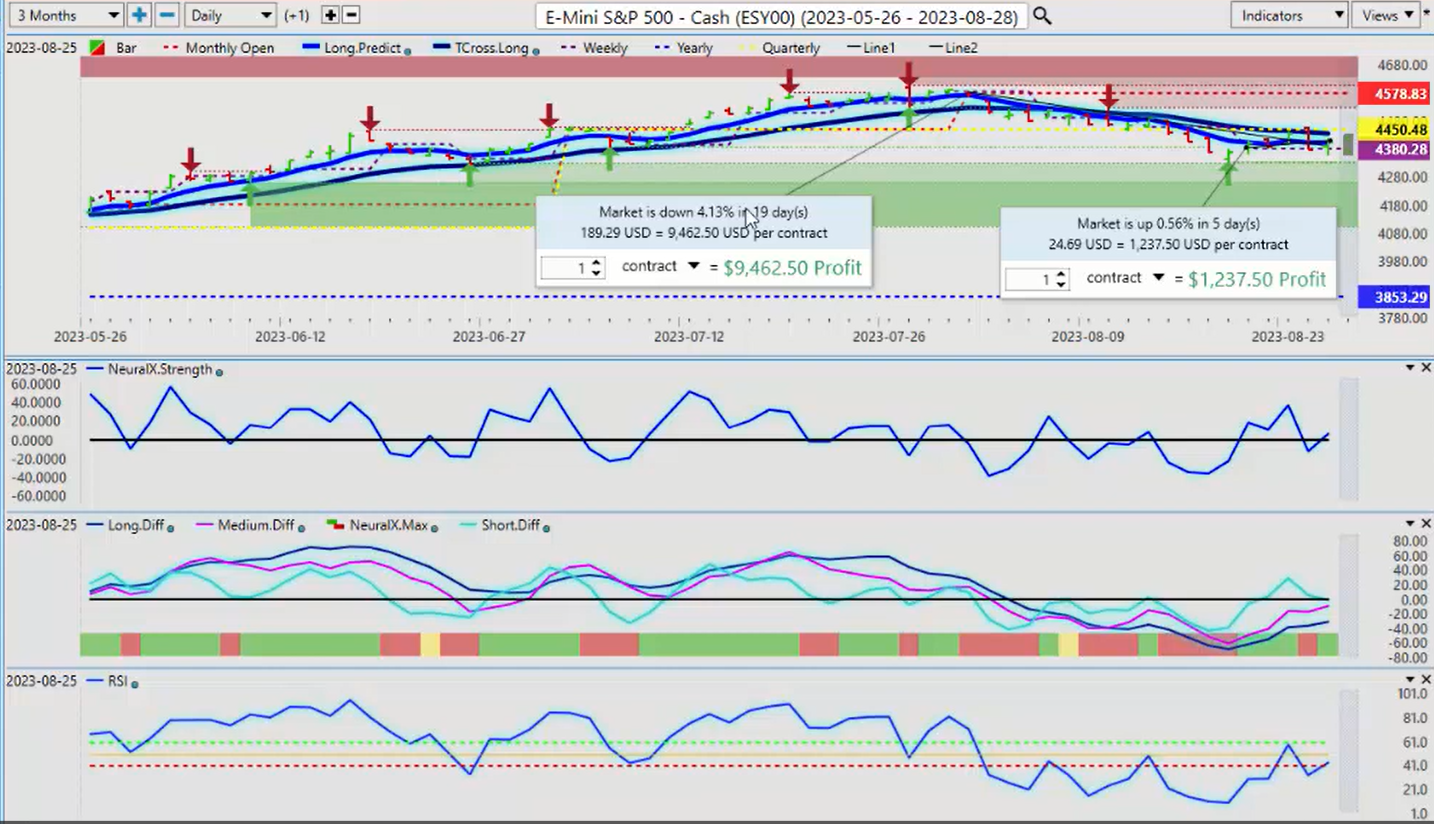
Now to get started this week, we’ll look at an accurate measurement of the performance of the S&P 500 and the SPYs. We can see that the market is up a mere 0.56% for the week. For the month of August, very important that we’re using proper anchor points to measure performance, so we’re not in a lagging performance model. What the market did five days ago, three months ago, six months ago, is not really relevant to what we’re looking at in current pricing. We don’t want to create lag in our trading. So for the month, we can see that the S&P 500, and basically the SPY is also down about 4.13%. Now, the point of interest that we would look at here is that we’re below the quarterly opening price.
Now again, measuring the quarterly from January through December 31st is very, very important. Because as we can assess here, as we crossed over the quarterly opening price, that led to a steeper decline in the global stock markets. Now, of course, the Fed is assisting this, but for now the quarterly opening price is intersecting with the VantagePoint T-cross long at 4435. So for next week, that’s where the bulk of our resistance is going to be, because again, this is an outlook, not a recap of something that’s already happened. We want to make sure that going into the trading week, we identify these levels so we can trade them. Now, we are in a very strong period of dollar strength. That seasonal pattern up until approximately early October is one of the strongest periods for the calendar year for the US dollar. Now, in my respectful opinion, I would directly link that to the US government fiscal year end on October 1st.
U.S. Dollar Index
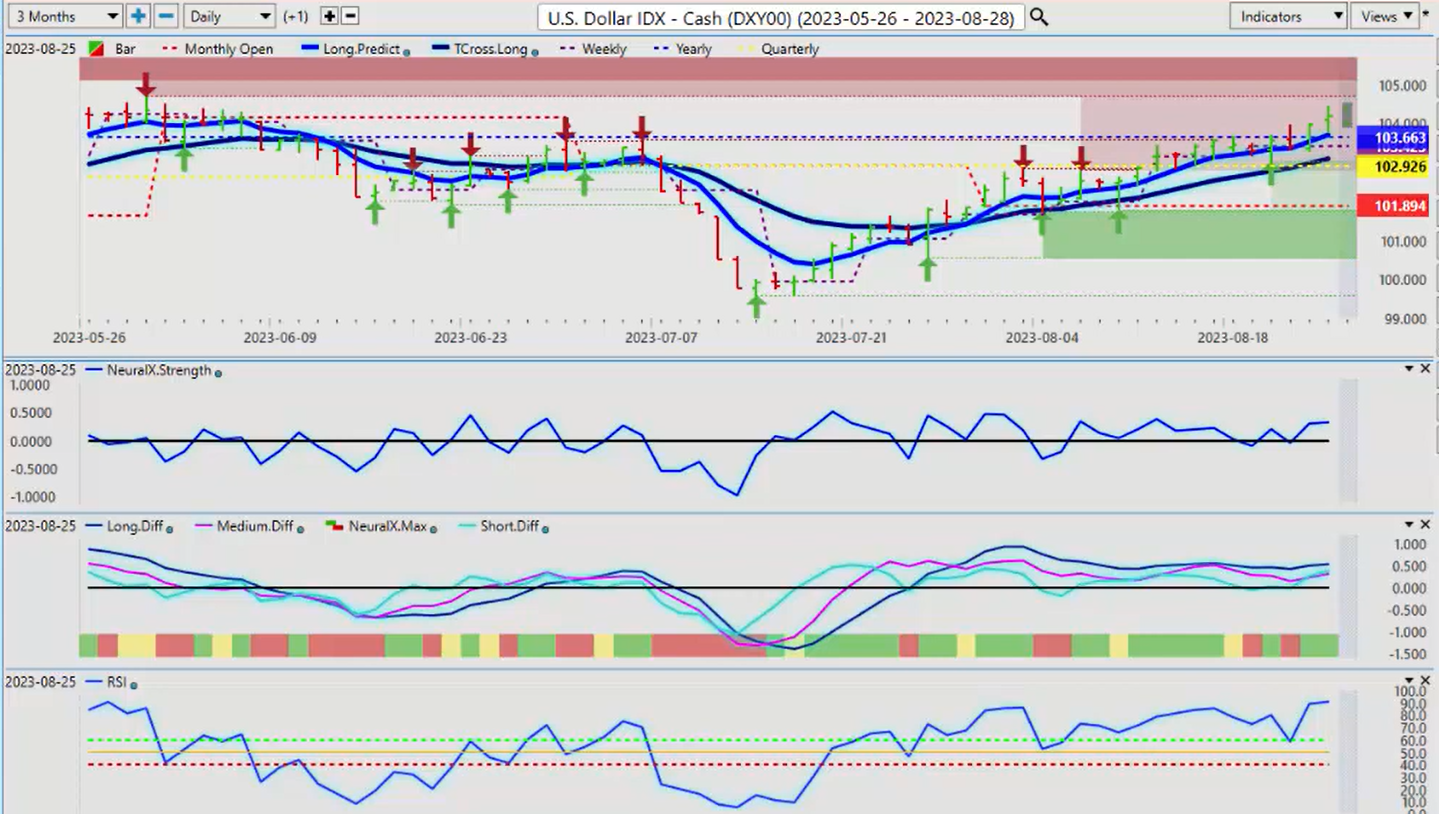
So we will be watching that very closely. But as we can see, again using the current yearly opening price, we don’t want to go back 365 days from today or three months from today, or even six months from today. It’s not relevant, guys. We’re looking at the quarterly opening price, the monthly opening price, and even the weekly opening price. But right now, the yearly opening price is intersecting with the VantagePoint long predicted 103.71. When we broke above the yearly opening price, the dollar gains accelerated. Now, this also comes at a time when the fed remains hawkish on rate hikes. I’m still a little unclear why with this imaginary inflation, because again, that 2% inflation target is likely unreachable, and it’s a made up number anyway, guys. Originally a point of interest, it was back in the 90s, mid-90s, where the New Zealand finance ministers said, “I think we should go with a 2% inflation target.” The Bank of New Zealand picked up on that. Then the Bank of England and the Bank of Canada followed with that. But it was not based on any economic study, which I find very interesting.
I don’t see any reason why the Fed can’t move his inflation target up, but that’s a separate argument. For now, the dollar is benefiting from that. But the dollar, again, in my respectful opinion, would’ve strengthened in the month of September Anyway, as we’ve seen over the last five, 10 years, that strong seasonal pattern going into about the middle of October, early October. So for next week, our quarterly opening price 102.92. Our T-cross long is at 1030.09. We’re long the dollar while above this level, and it should put additional pressure on the equity markets based around this inverse correlation.
Gold
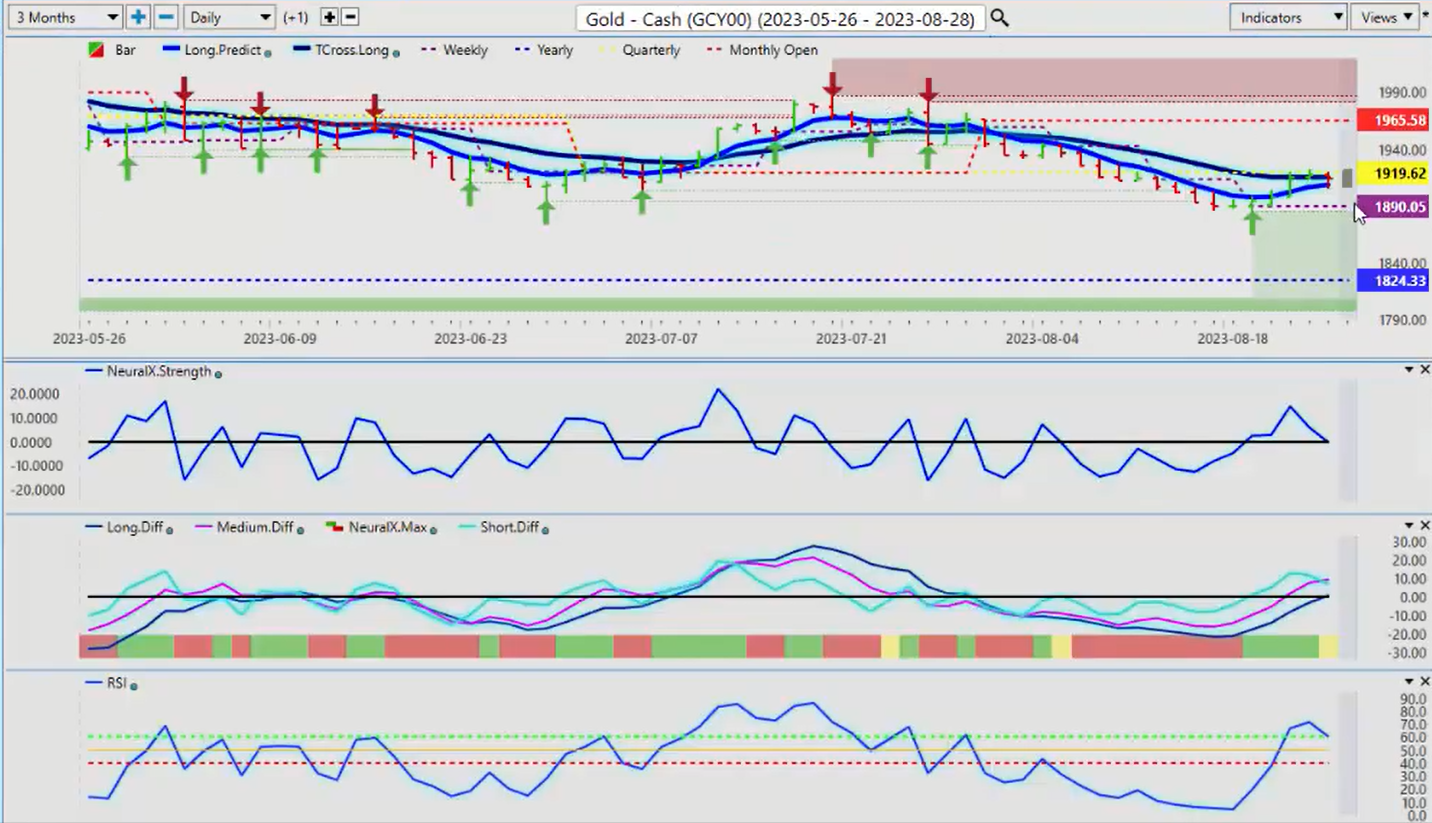
Now, another point of interest here is that gold remains firm. We’re above our yearly opening price. Now, again, guys, when we’re identifying a trend, we can’t say gold isn’t a downtrend if we’re positive on the calendar year. So when we go back and look at this from an accurate standpoint, then we can see that, again, these levels are incredibly important. Because if not, then we end up with a potentially trading off a false price level. So if we come back here into the early part, right around the beginning of the year here, we can see right around January the third, if we accurately measure the performance on gold as to where it is right now, we can assess that gold is actually doing quite well, up 4.3% on the year, not a huge gain, but we’ve obviously been higher than that throughout the calendar year.
But we do remain positive is the main thing. So again, when we look at this right now, gold will likely struggle in the month of September, but we also have another strong gold seasonal pattern coming up usually around November, mid-October, November. The US dollar sells off. Gold goes higher. One of the top buying months for gold is, of course, late November, early December, but it usually starts sooner than that. So for now, we’re, again, failing three days in a row at the VantagePoint T-cross long, and the accurate quarterly opening price at 1919. So again, all of our resistance on gold is sitting between 1914 and 1919. If we can break above that, we can look to target back towards that monthly opening price, but that barring some major risk off environment, possibly additional conflicts between Russia and China and the US, that would trigger more gold buying.
But either way, gold is likely to remain above its yearly opening price. Now, again, if we can push through 1919, then gold still would likely… We’re still likely going to see some gold buyers towards the end of September.
Crude Oil
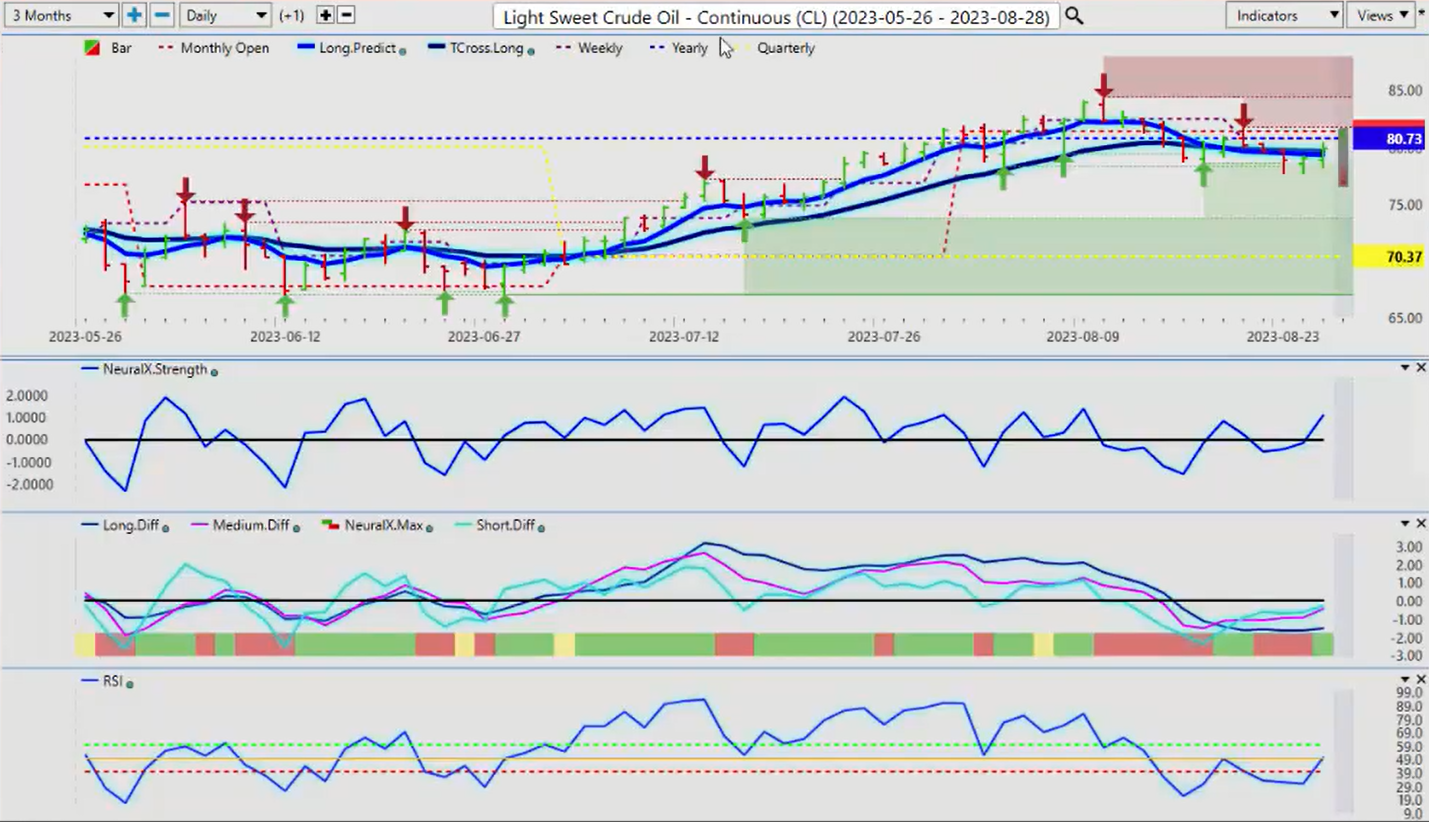
Now, when we look at light suite, crude going to this week, didn’t really stand much of a chance there with the Fed. But once again, we’re holding below our T-cross long at 79 point 63, but we’ve also slipped back below that yearly opening price. And as you can see, if you’re using an accurate performance number like the yearly opening price, the second it closes below it, there’s an additional short opportunity. We’ve come back up to the yearly opening price multiple times, failing each time. So again, when we get into October, November, not overly strong months to begin with oil. But if the Fed remains on this rate hike path, that’s unlikely to benefit oil.
So again, we will monitor that yearly opening price that’s coming in at or about 80.73. The VantagePoint indicators are warning that there is some at least corrective move. A corrective move higher in oil is extremely likely here based around these indicators. But again, unless we can make a sustained break of that yearly opening price, then we’re still bearish on oil. When we go back and look at this throughout the calendar year, you can see that oil has never really remained positive. Despite the fact we’ve had some good rallies in oil, it has largely been negative. So if you bought or sold oil on January 1st, you’re still losing money on this. So again, it’s important to check these levels is all I can say, to make sure you’re not trading off a level that would create lag, like a rolling performance model that I’ve discussed.
So again, if we can break higher, there may be short-term buys on oil, but at this time it’s very, very unlikely.
Bitcoin
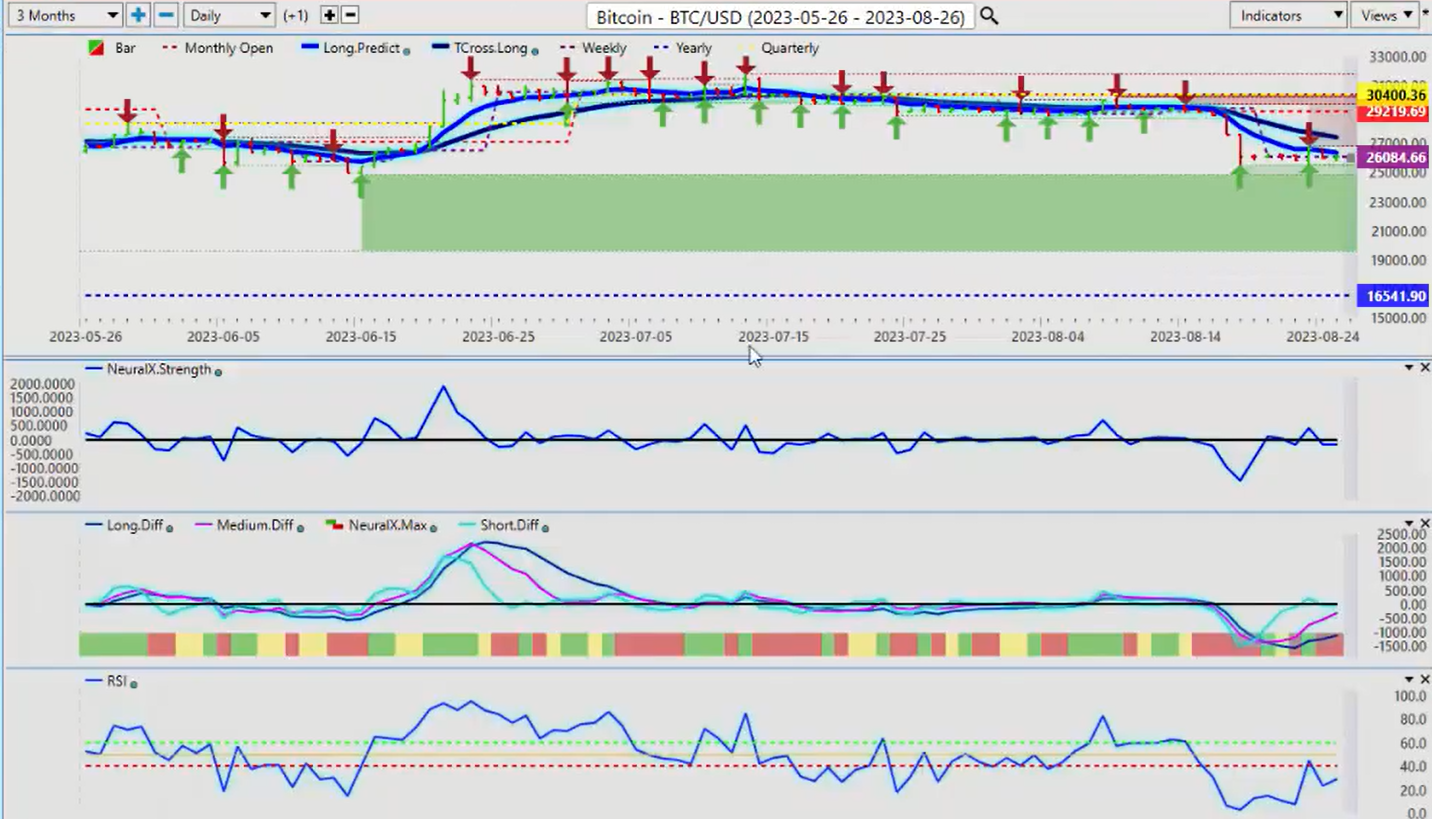
Now with Bitcoin, a Bitcoin, as we can assess here, as I discussed in the previous weekly outlooks, we would need a further breakdown below 25,505, this big move down. This happens almost yearly, guys. There’s a strong seasonal and Bitcoin that will start towards the end of September, and it will run till about November the first. So as you can see, the market is leery to short Bitcoin here. Now, we all remember they told us, “Don’t buy Bitcoin. Bitcoin’s a scam.” In February, January, March of this year, it was a disaster, guys, the Bitcoin moving up almost 83, 84% on the year. The Bitcoin ETFs followed that. So again, we would be looking for longs on Bitcoin, but not for a few more weeks, in my respectful opinion.
But the VP indicators are starting to warm up to that. We’ve got an ma diff cross. So again, we’ve just got to look for the medium term cross over to get above the zero line here to confirm that that seasonal pattern, come mid to the end of September, is still actually in place.
Euro versus U.S. Dollar
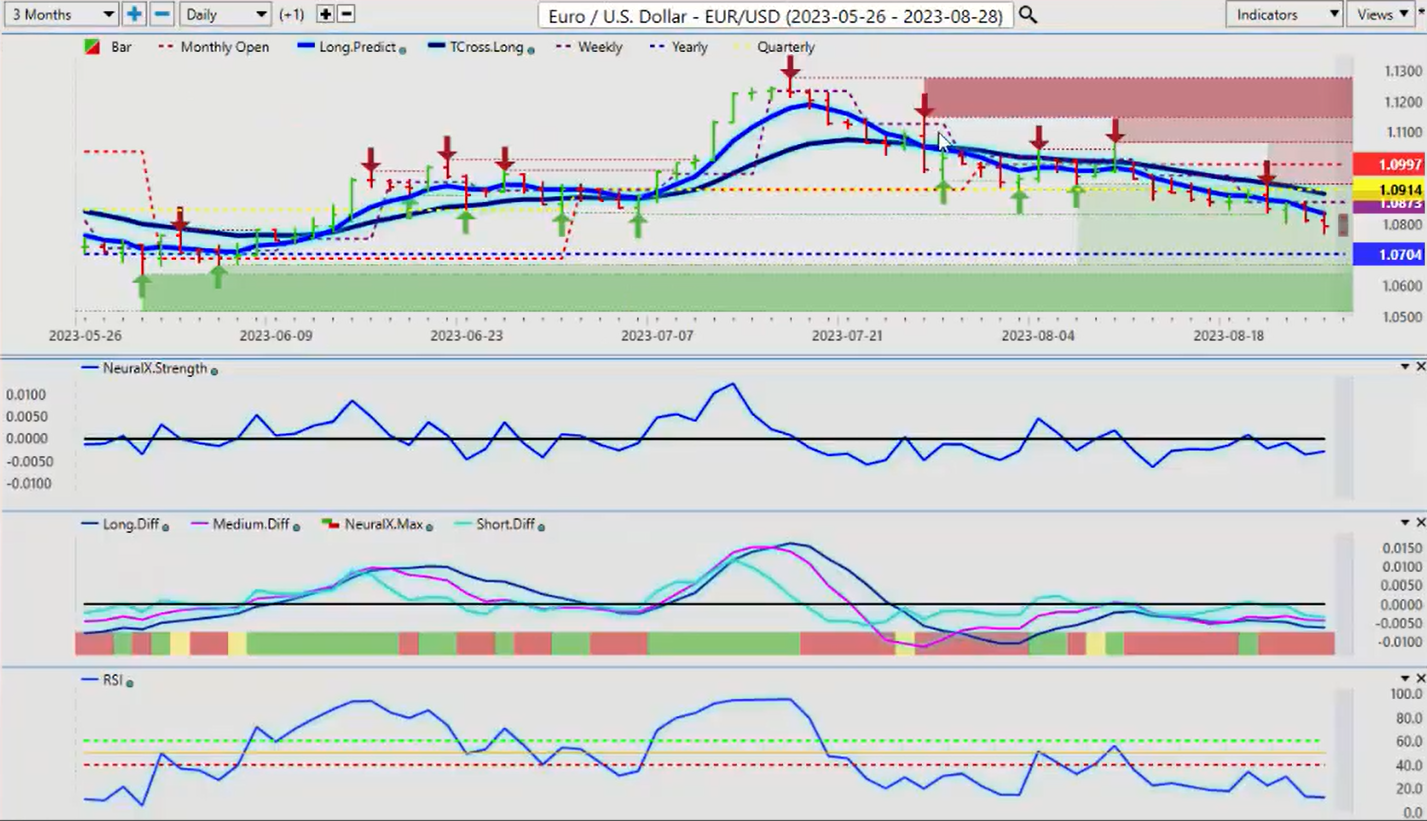
Now when we look at the Euro currency this past week, really struggling here. But once again, guys, using the point in time indicator in VantagePoint, which is geared to the current monthly opening, the current weekly opening, the current yearly and quarterly opening. So each quarter this line moves and tells us where we’re at. So in the US fiscal fourth quarter, the Euro US payer very seldom does well. So once again, we’re still positive on the year at 107.04, but I would anticipate that this level is going to be tested in the coming weeks.
So again, our T-cross long 108.99. That’s our major resistance point. And our quarterly opening at 109.14. So the theory here is that if we stable a 109.14 and the VantagePoint T-cross long at 109, that’s where all of our resistance and our premium short entry points are for next week. But as we can assess from this past week, we’re basically playing off the VantagePoint long predicted. As we come up to this blue line, we hit that blue line. And again, we’re seeing sellers coming out right around that particular level of 108.35. So that’s your level to start the week, followed by the T-cross long, and of course, that very important accurate quarterly opening price.
U.S. Dollar versus Swiss Franc
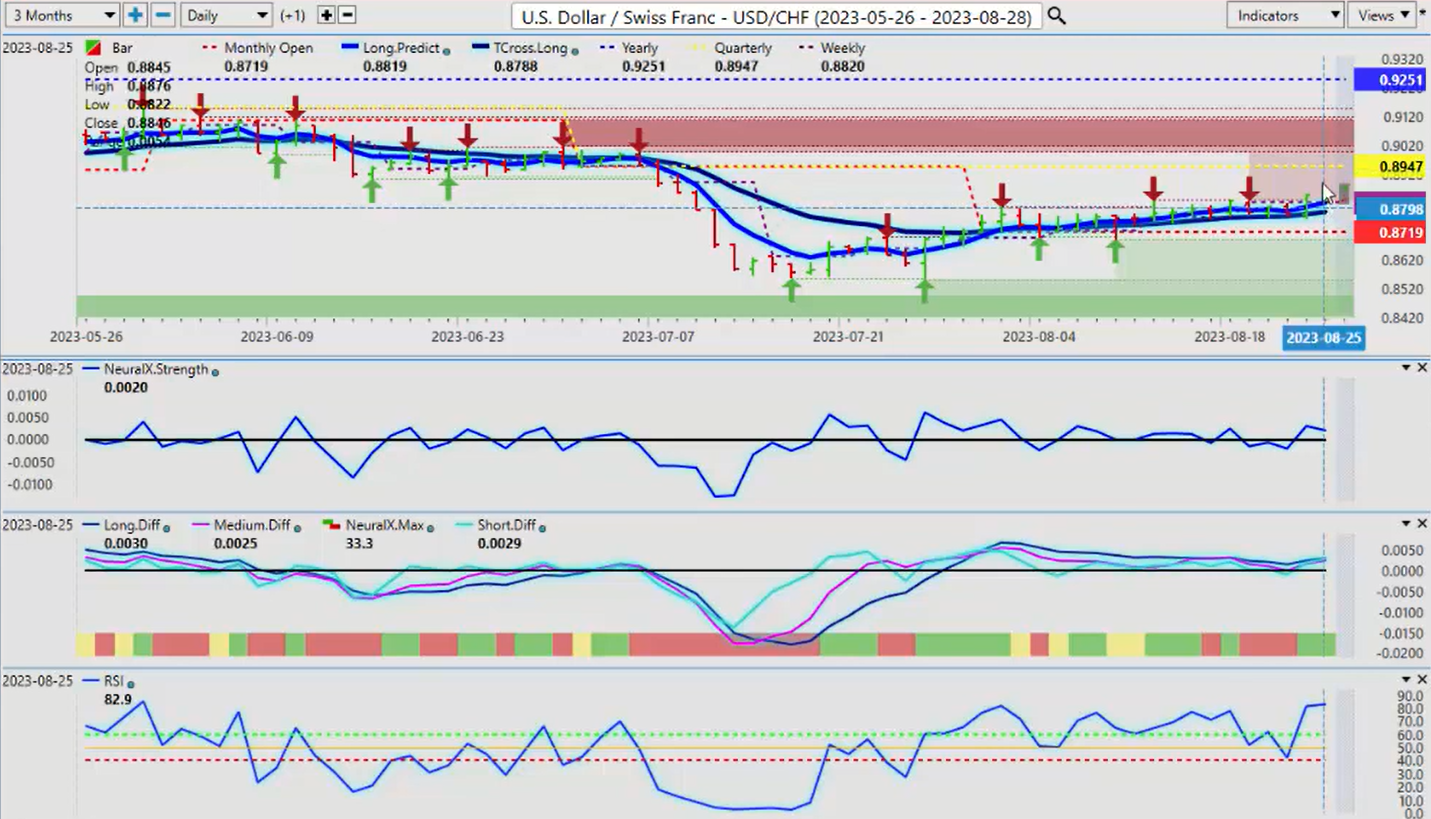
Now, with the US Swiss Franc, once again, this pair will be of interest to us next week, because I believe that there will be additional buying opportunities. Now in this particular scenario, we have an upside target, our quarterly opening, 89.47.
This particular pair is potentially a place of value to buy dollars during a period of known dollar strength in the month of September. Now, that seasonal pattern on the dollar is between 80 and 100% accurate over the last five and 10 years on that seasonal. So again, not necessarily that the US Swiss Franc is going to take out 92.51, but it is likely we’re going to at least test this 89.47 level. So the indicators a little bit mixed here. But again, after a corrective move lower towards our T-cross long at 87, 88, we should be able to move higher.
British Pound versus U.S. Dollar
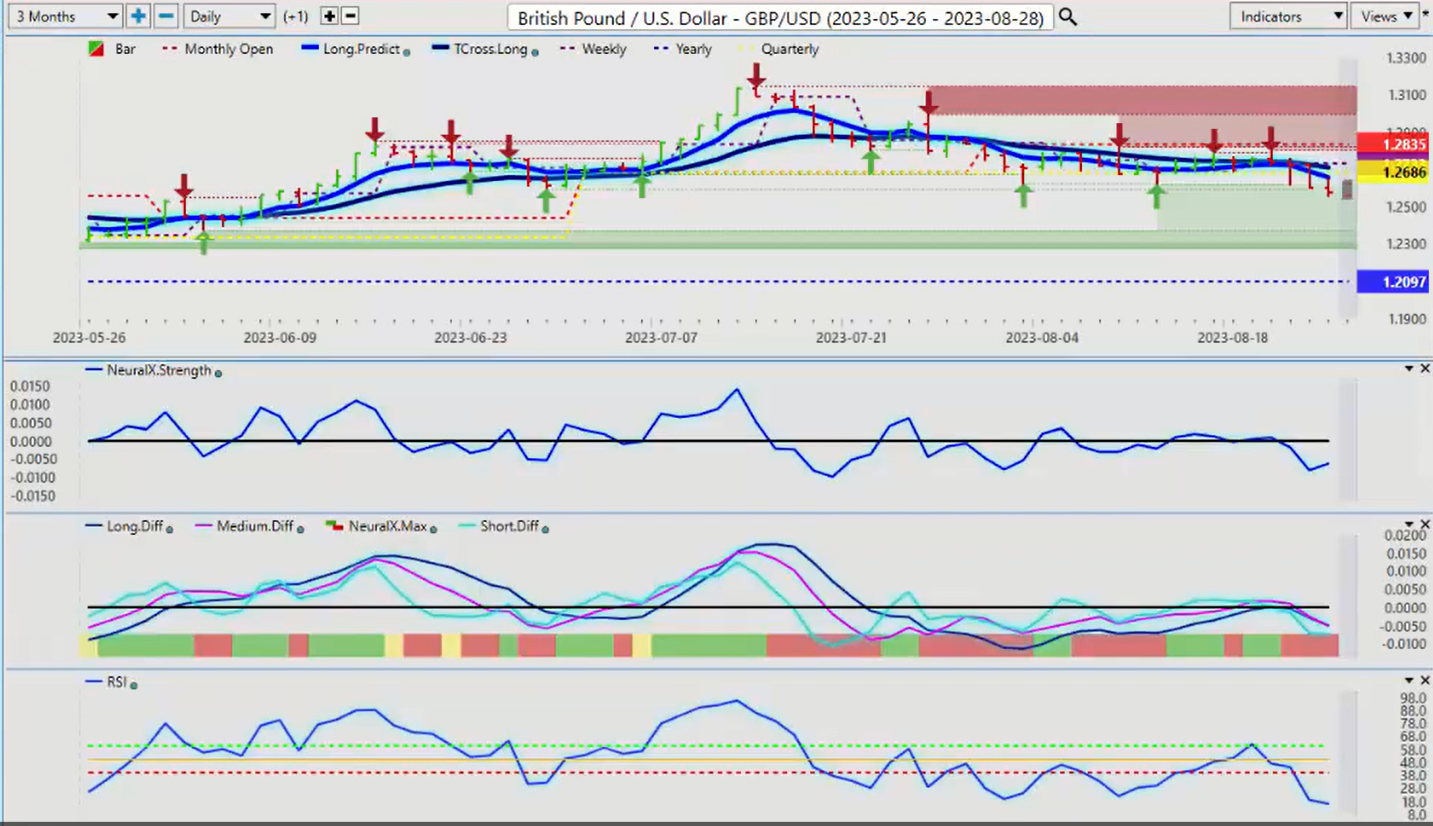
Now, the British pound for next week, once again, cutting below that quarterly opening price is definitely an area we want to watch. 126. 86. We’re still positive on the year. So Sterling has put up a good fight here. But again, it is likely to come under excelling pressure in the month of September based around that dollar seasonal.
So we’re negative on the month, we’re negative on the week, and we’re negative on the quarter. So at least until October 1st, we would use this 126.86 level as a pivot point to get in or out of trades. So if you’re leery of that, if you think that the pound dollars is going higher, then you would put buy limit orders above 127. If we break above that, then we should be able to target that monthly opening. But at this time, the dollar cycle… The dollar is normally quite strong at the end of the month into the first week of the new month until the week after the non-farm payroll number. But again, the month of September, there is a stronger seasonal pattern in that US fiscal year end. So I would look for additional selling pressure on this particular pair.
U.S. Dollar versus Japanese Yen
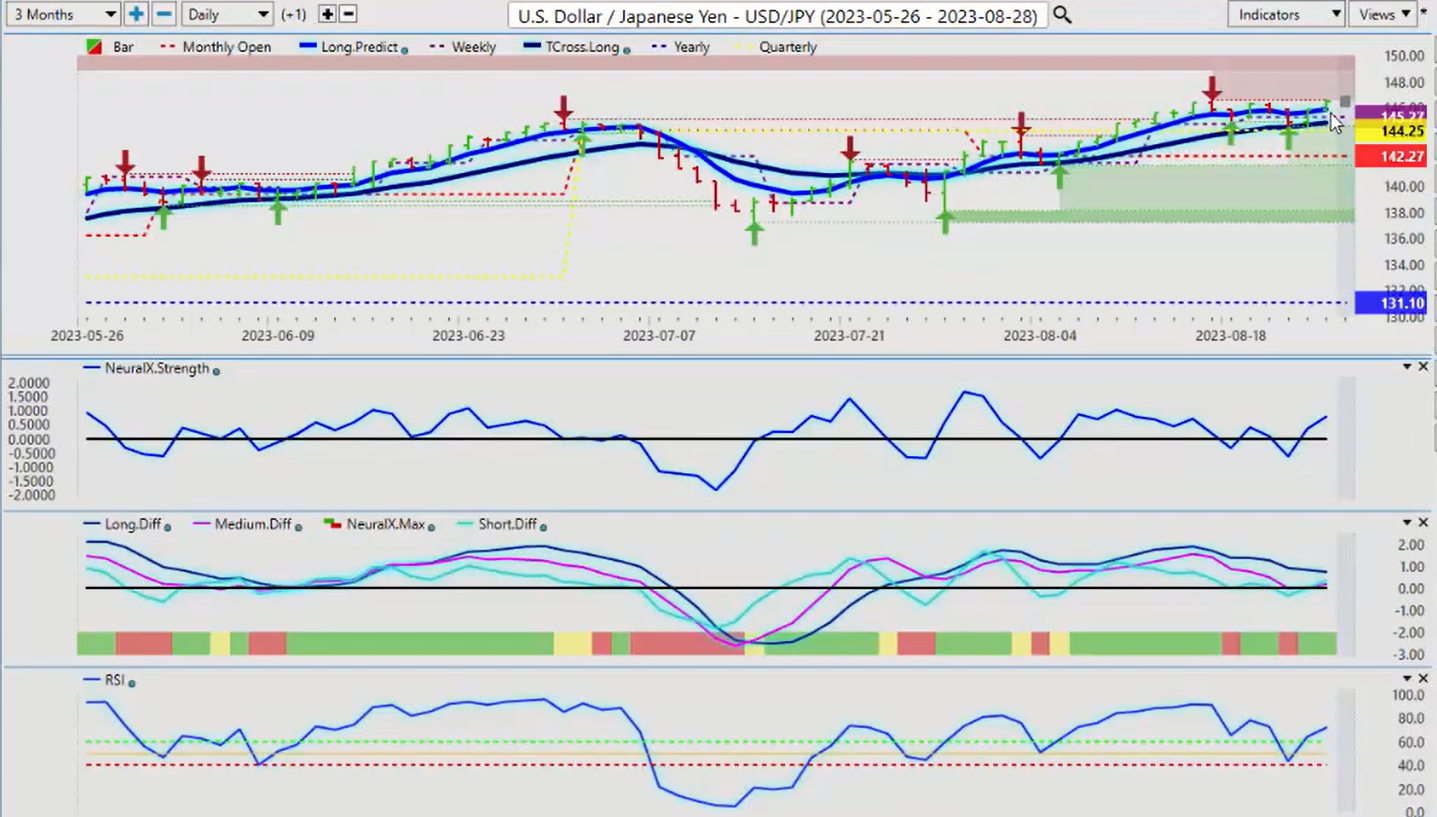
Now, with the carry trade going into the dollar yen for next week, again, the carry trade reign supreme here. You can see that we’ve come down this past week.
We’ve used the VantagePoint T cross long and again, an accurate performance model, guys, the current quarterly opening price is intersecting with the VantagePoint T-cross long, the quarterly at 144.25, 144.64 for the T-cross long. Our buyers are clearly coming out around that level. So for next week, what we really need to do is push through that verified resistance high coming in at 146.56, and would probably open up the door for additional buying on this pair for next week. Because again, the carry trade, the interest rate differential between the Bank of Japan and the FOMC is substantial, probably one of the biggest in the forex market, next to New Zealand, Japan. So unlikely we’re going to get any sellers here. But if we do have further tensions between China and the US, or China and Russia and the US, that could trigger some yen buying.
So always be careful with this particular pair, but the indicators are saying, for next week at least, we are going higher.
U.S. Dollar versus Canadian Dollar
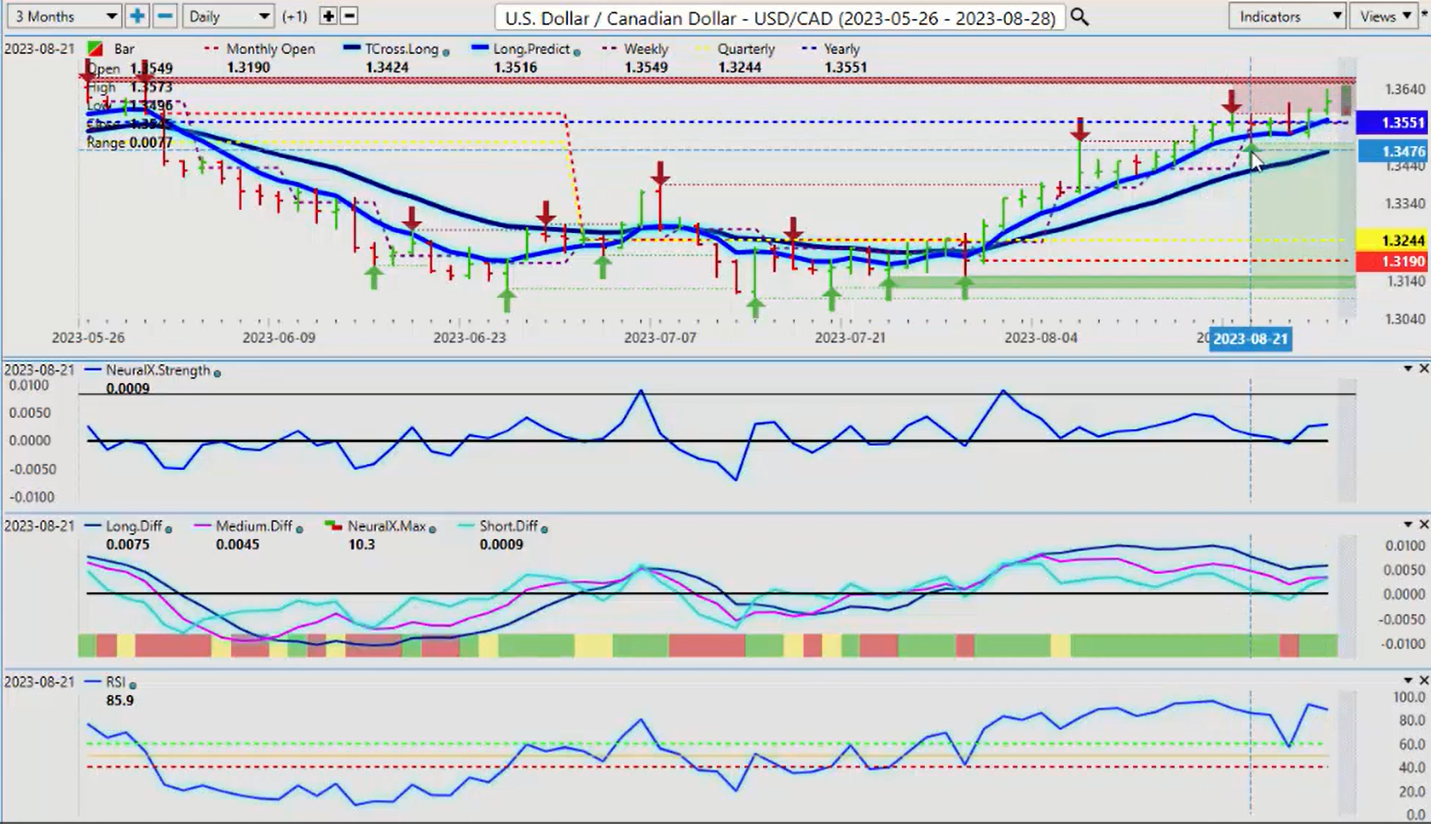
Now with the US Canadian pair, again, unless oil can turn around and start moving aggressively higher, then it’s continuing to put upside pressure on these equity-based currencies, the Aussie, the CAD, and the New Zealand. So the Canadian dollar, once again, you can see coming up against that accurate yearly opening price from January the first. Again, guys, I will reiterate this, rolling performance models creates lag in the market. If we look back from today from three months ago or six months ago or nine months ago, it is very little relevance to anything. We look at the current yearly opening price, the current quarterly, and monthly and weekly opening prices, and we can assess whether the buyers or the sellers are in control.
Right now, the buyers have control. We’re holding above 135.51 is major support. Now, if this is the form of resistance turn support, we need to stay above this. But as I’ve talked about in the VantagePoint live training room, guys, be very careful of the Monday Tuesday reversal. So what we would look to begin the week with this is for the US Canadian pair to come screaming lower, only to stop dead like it did on Friday at the yearly opening price, and then move higher. Our predicted low for Monday, 135.68 is a pretty decent area to attempt longs, but just remember there’s always that possibility of a bull trap up here. So keep your stops within a reasonable area. The T-cross long 134.74, that’s a main support level two, but I believe any move down to that area would likely be corrective in nature until we get into mid-October.
Australian Dollar versus U.S. Dollar
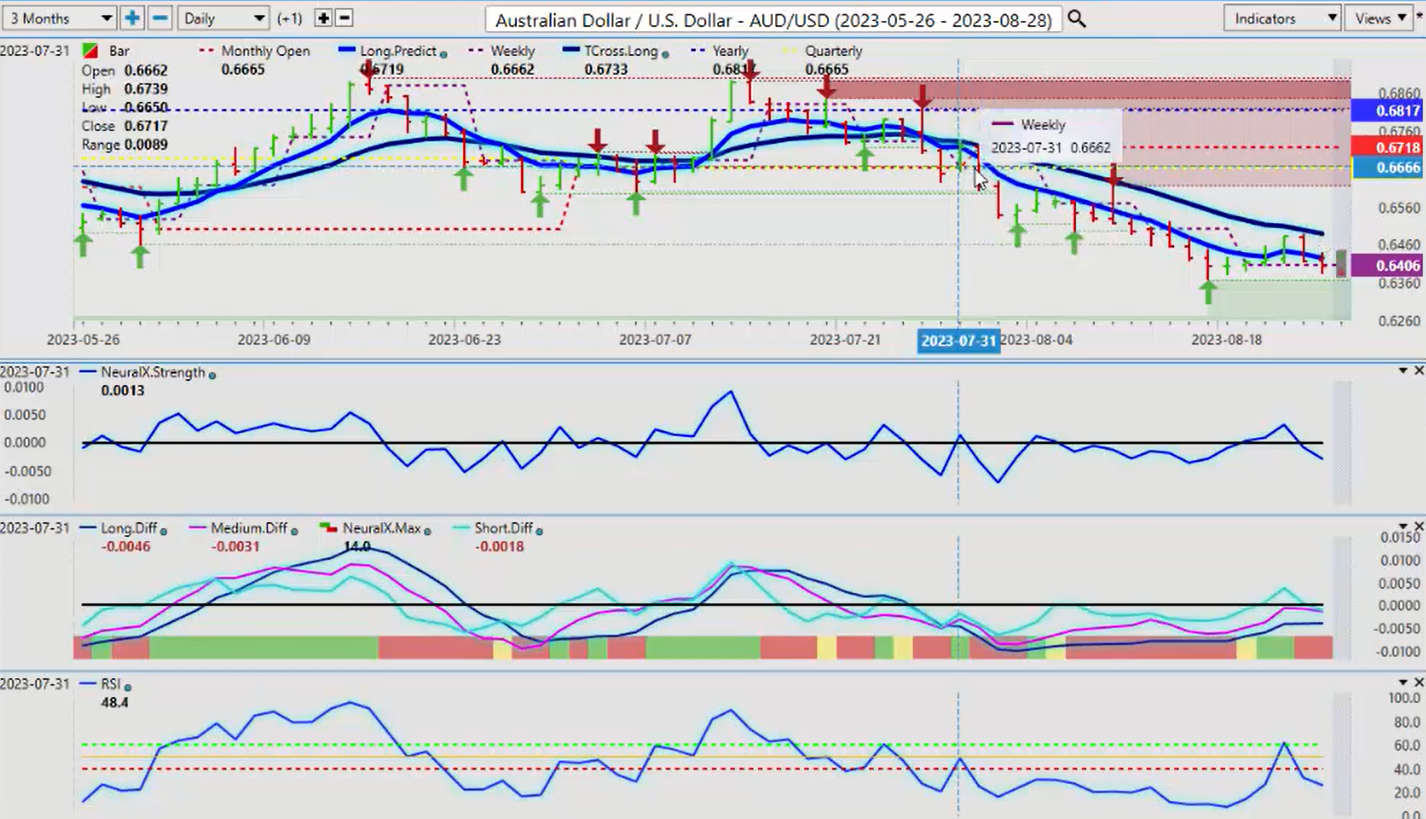
Now, the Aussie and the Kiwi, very similar trades to the CAD, the Aussie under significant pressure. But once again here, guys, and again, this is for training purposes only, when you’re using an accurate pivot point like a monthly, quarterly, yearly opening price, when you get a break of one of these major levels on a weekly, monthly, yearly, or quarterly basis, it usually leads to a significant move like this. So if we look at an accurate break of the quarterly opening price to where we’re currently at now with the US Canadian pair, or excuse me, with the Aussie US pair, you can see that that’s a significant drop of 3% in a very short period of time where the average trader or using that rolling performance model created lag, and they actually think it’s bullish when it’s bearish. So on a break of these levels, it can usually be very significant.
I believe that this pair will move higher into the year end. But for now, it’s going to be under significant selling pressure. Our VantagePoint T-cross long coming in at about 64.88, the long predicted, 64.25, but our quarterly all the way up at 66.65. So a retracement is possible, but we would need a strong move in the S&P 500 or the global equity markets to get people going back into these risk on currencies, the CAD, the Aussie, the New Zealand.
New Zealand versus U.S. Dollar
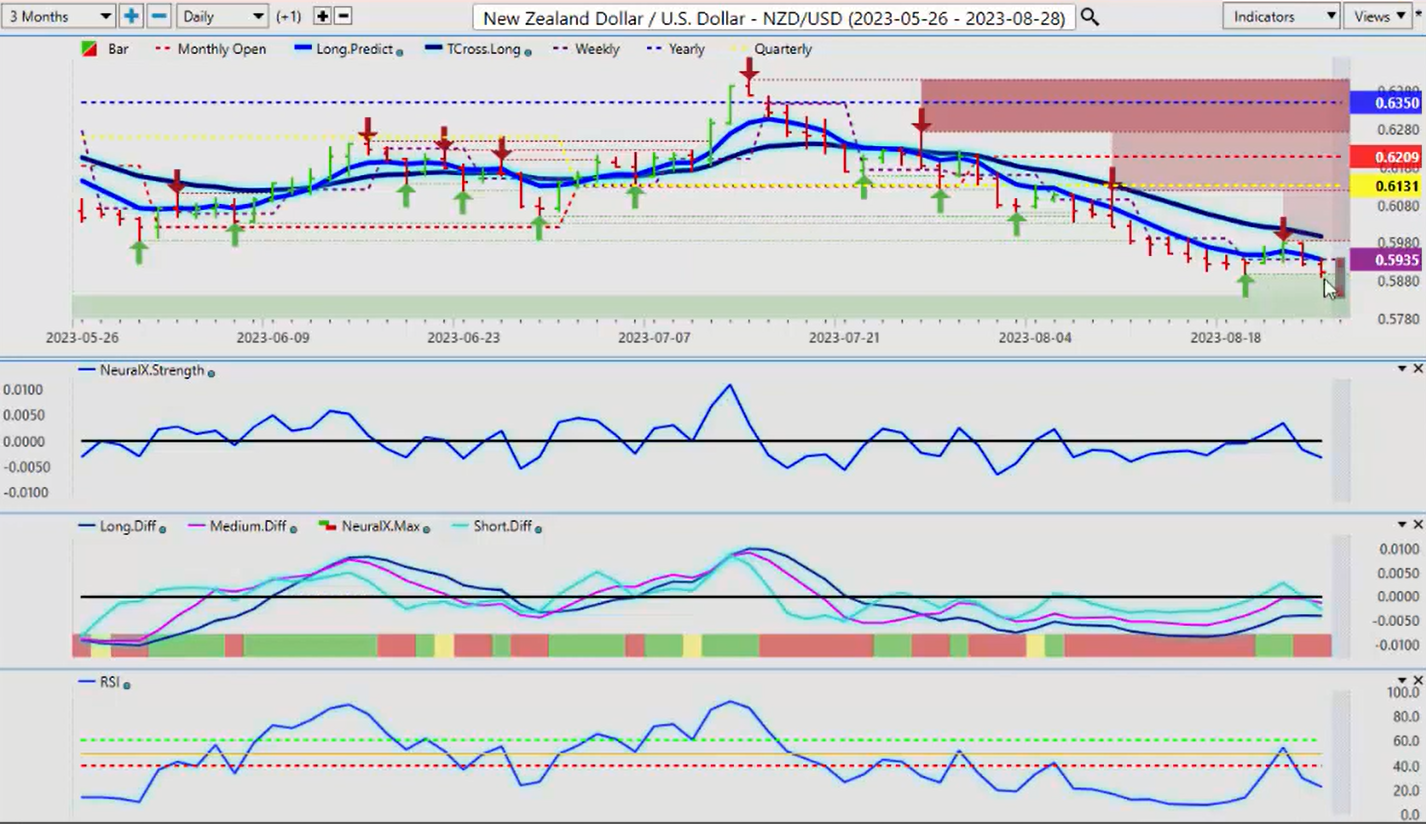
We can assess here that the Kiwi looks basically the same here, very, very little difference, guys. And you can see the lines are staggered, the yearly opening price, the accurate yearly opening price, the accurate monthly, and even the accurately quarterly, and weekly levels. So again, looking at this, these risk on currencies are not actually in play right now, but I believe they will be towards the end of the year. So with that said, this is the VantagePoint AI market outlook for the week of August the 28th, 2023