-
View Larger Image
Welcome to the Artificial Intelligence Outlook for Forex trading.
VIDEO TRANSCRIPT
“Hello everyone, and welcome back. My name is Greg Firman, and this is the Vantage Point AI Market Outlook for the week of September 18th, 2023.
U.S. Dollar Index
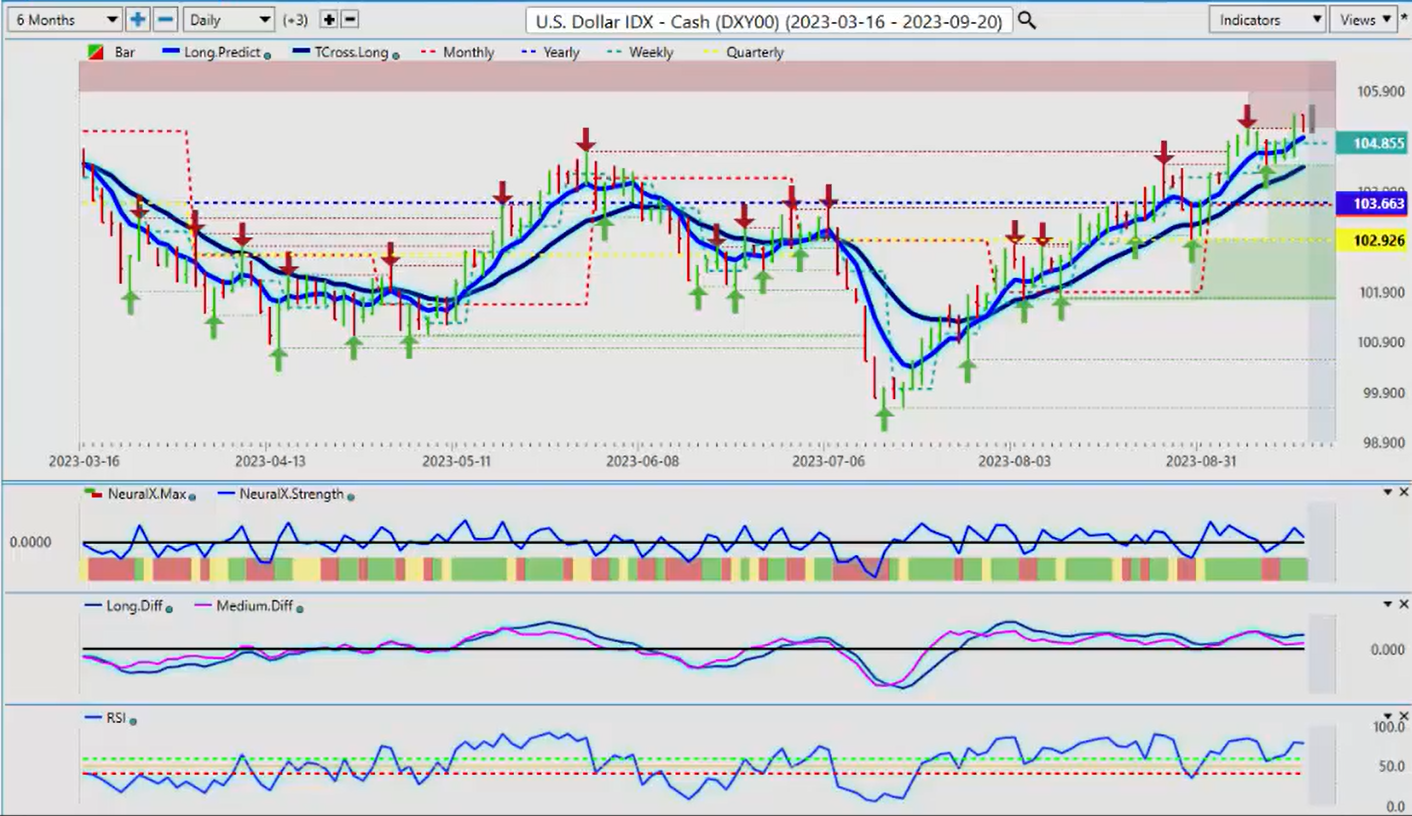
Now, to get started, this week we’ll again revisit the U.S. Dollar . I believe we’re in our ninth consecutive week of dollar strength, so obviously, this is likely coming to an end very soon. What I’ve talked about in previous presentations is that the dollar is normally very strong in the US fiscal fourth quarter, which is ending October 1st, and then the dollar usually starts its descent by mid-October. That would push Gold higher, potentially equities higher, but we’ll talk about that more in a minute. For now, we can see that our current quarterly opening price is 102.92.
Now, again, the Point in Time indicator in Vantage Point is highly effective because the last thing we want to be looking at is rolling performance—looking at a random five days, random 30 days, random 90 days. We want to keep our focus on the quarterly open, the monthly opening, the weekly opening, and the yearly opening. So when we look at the U.S. Dollar , we’ve crossed above all of those levels: the yearly opening price 103.66, but the quarterly 102.90. The indicators here are a little bit mixed; we’ve got an M A diff cross to the downside, and we have a reverse checkmark on the neural index strength indicator, but the neural index itself is still green.
Now, again, in my respectful opinion only, what I’ve seen from a seasonal standpoint, because I don’t get into looking at waves or any of this stuff, Fibonacci—I focus heavily on the inter market correlations. Where we are currently sitting in the calendar year, based on a quarterly opening, the monthly, the weekly, and of course, the all-important yearly opening price. So, the dollar normally rallies at this time of year. But if we look at this even from one year ago, we can see with the excessive rate hikes coming out of the Fed, the dollar still didn’t make any further gains past September 28th. Now, this is exactly when I believe we will see Gold start to Rally because again, dollar down, gold up. That’s usually the way it works. But I’ll talk more about that in a moment.
For now, what we’re looking for from the dollar is to continue its advance. The major event risk coming in next week is, of course, the FOMC. Zero control over what this person is going to do or say. I was a little surprised by the ECB this week. Sounds like a one and done. Is that the way the Fed’s going to play this? Well, we’ll have to see on that one, guys. But for now, the dollar is softening a little bit.
Gold
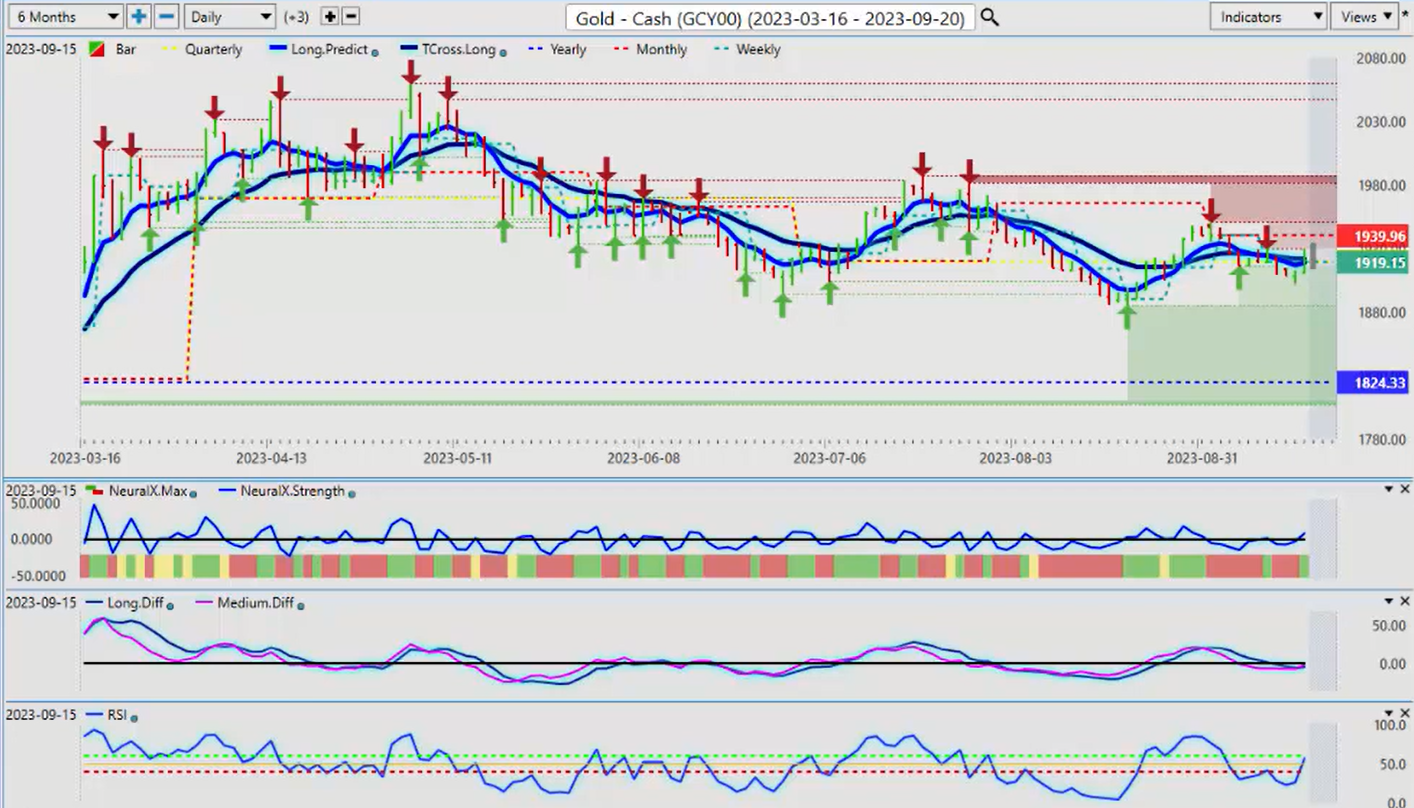
Now when we look at Gold prices, I talked extensively about gold last week. And to clarify, I was very clear in what I said. The bias in the month of September in Gold contracts is down, and that is consistent with other types of analysis. However, when we look at the seasonal pattern of gold, if we look at it over a 10-year period, okay, gold has gone up 40 percent of the time between September 28th and about November 15th, or I could argue even to year-end. However, over the last five years, gold has gone up 80 percent of the time during that exact same period, with an annualized return of 21.45 percent.
This is exactly why I avoid wave analysis, and again, there’s only one Elliott wave Guru here, guys, and that’s Ralph Elliott, born in the late 1800s, died in 1948. But again, in 1948, the Forex market, for example, we were still on the gold standard. The Bretton Woods Accord didn’t happen until Nixon came into power. So again, we’ve got to be careful about using older, lagging technologies. But again, that statistical fact on Gold : gold has gone down over the last five years in the month of September; it’s gone down 100 percent. But not in the month of October, guys. So again, I just want to be clear about that.
Right now, we are firmly above the yearly opening price at 1824. I, too, would anticipate a move down towards this 1890 area. I think we will still get that. But the question is, will we get any further of that? But either way, the bias is to the upside once we start the new month or the fiscal first quarter in the U.S when the dollar gives back 90 percent 80 percent of its gains.
So when we look at Gold right now, we actually finished the week quite strong, moving back up into the 1929 area. And as I had stated last week, there were still some signs of life, and there still is right now. We have the neural index strength pointing higher, the predicted differences are starting to point up, we’re starting to gain upward momentum. So again, there’s different ways of doing things, guys, but seasonalities, inter-market correlations, and predictive indicators will always be at the forefront—or should be—of the indicators we look at.
S&P 500
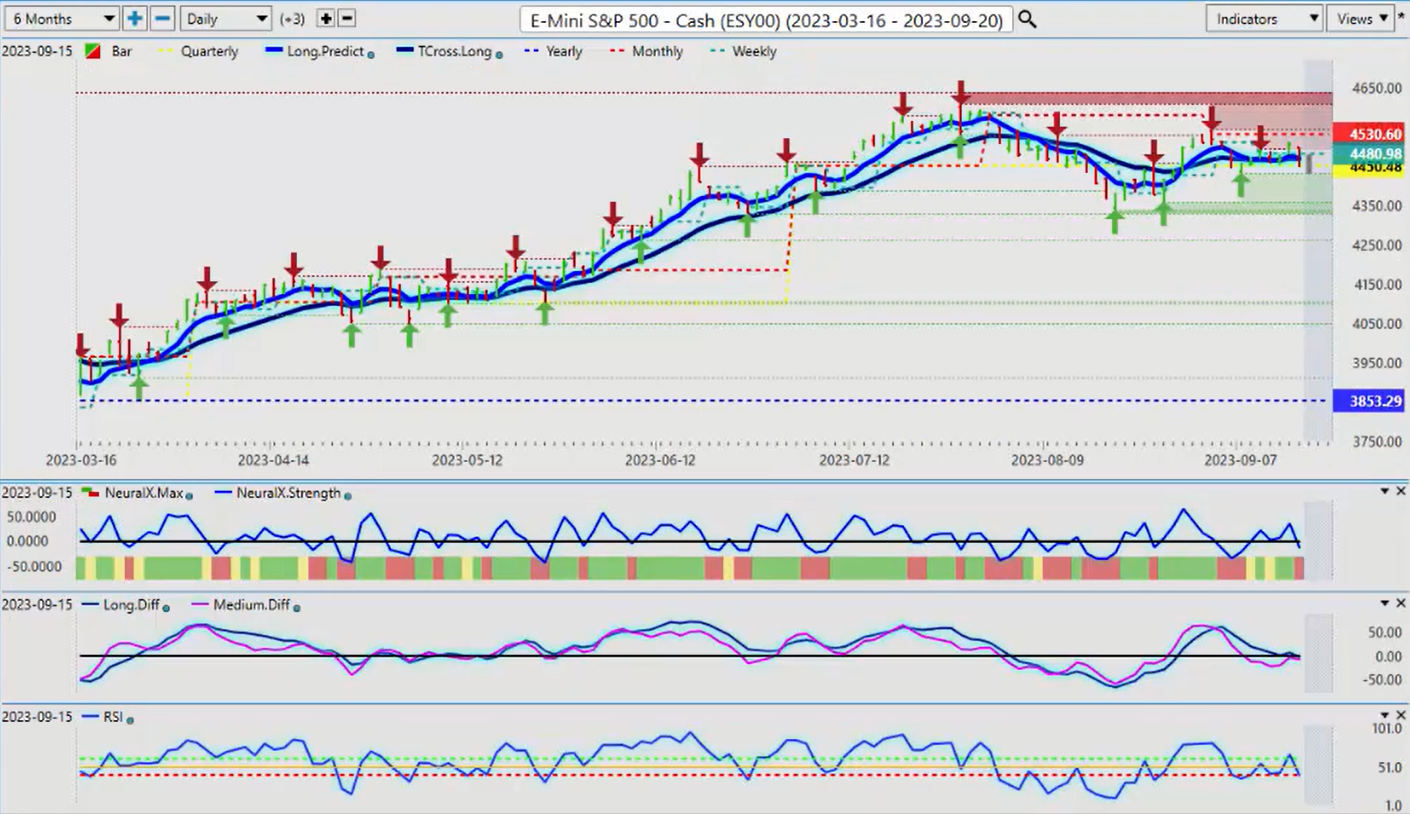
Now, when we look at the S&P 500 , this is where it gets very interesting. Again, we don’t want to get into using, again, lagging performance models. There’s, yes, we’re in an election year—I believe it’s next year, usually points towards equity strength. But a few of you guys have rightfully pointed out that that may not happen this year. So right now, the S&P 500 , statistically from a seasonal standpoint (remember, seasonals are very similar to the weather; we look at the weather, we can predict the weather to a degree of 80 percent on a daily, weekly, monthly, yearly basis), I can tell you exactly when it’s going to snow here in Canada, approximately. But these other tools, there’s a lot of very subjective waves are very subjective. We’re looking for objectivity in our trading.
So from an objective standpoint, we are not—we’re stuck on this quarterly opening price 444.50. But again, another week close here, guys. So when we look at that and we do a comparative analysis on the S&P to stocks, something like Tesla , when we look at actually Tesla closer, within some of the analysts, it was pointed out that there was bullish momentum coming into the market on or about the end of August. In actual fact, you can see we’ve actually moved lower in the month of September. We’ve been down as much as 6.45 percent. But if we measure it from the same point, we’re only up 5.92 percent as of Friday’s close. So again, you can see that the quarterly opening on Tesla , essentially, the market is unwilling to buy up here.
So the point of showing you this is to make sure that you don’t get caught in a potential bull trap because again, we’ve been up at this quarterly opening price, and we have been unable to close above that price five days in a row. Now, if I look back five days, a random five days, a random 30 days, then it would appear super bullish, you would think. But again, we don’t want to get caught in a bull trap like what happened on August 31st, where you buy into the stock, and then the very next day it drops 7 percent. So we want to avoid that.
So right now, I think I would be fine with buying this Tesla stock under 2 conditions. Number one, we clear, make a sustained break of the quarterly opening at 276.49. I need to close above that level two days in a row. But more importantly, guys, what we really look for is the S&P 500 to hold above and remain above that quarterly opening at 4,450. If we lose this, the probability that Tesla will get a high probability that Tesla could get dragged down with this. So again, pointing that out using factual anchor points, again, the start of the month, the start of the week, the start of the year, and again, the quarterly opening price right now is critical in the U.S fiscal fourth quarter.
And as we, and again in most cases, the dollar, I can tell you for almost exactly to some degree when gold will go higher and when the dollar will go lower, with the only wild card we’ve got to deal with here is, of course, the FED. But for now, these indicators on the S&P 500 are pointing down, so indirectly, we need to take that into consideration that there could be a bull trap setting up on a number of different stocks, Tesla just being one example of that.
Bitcoin
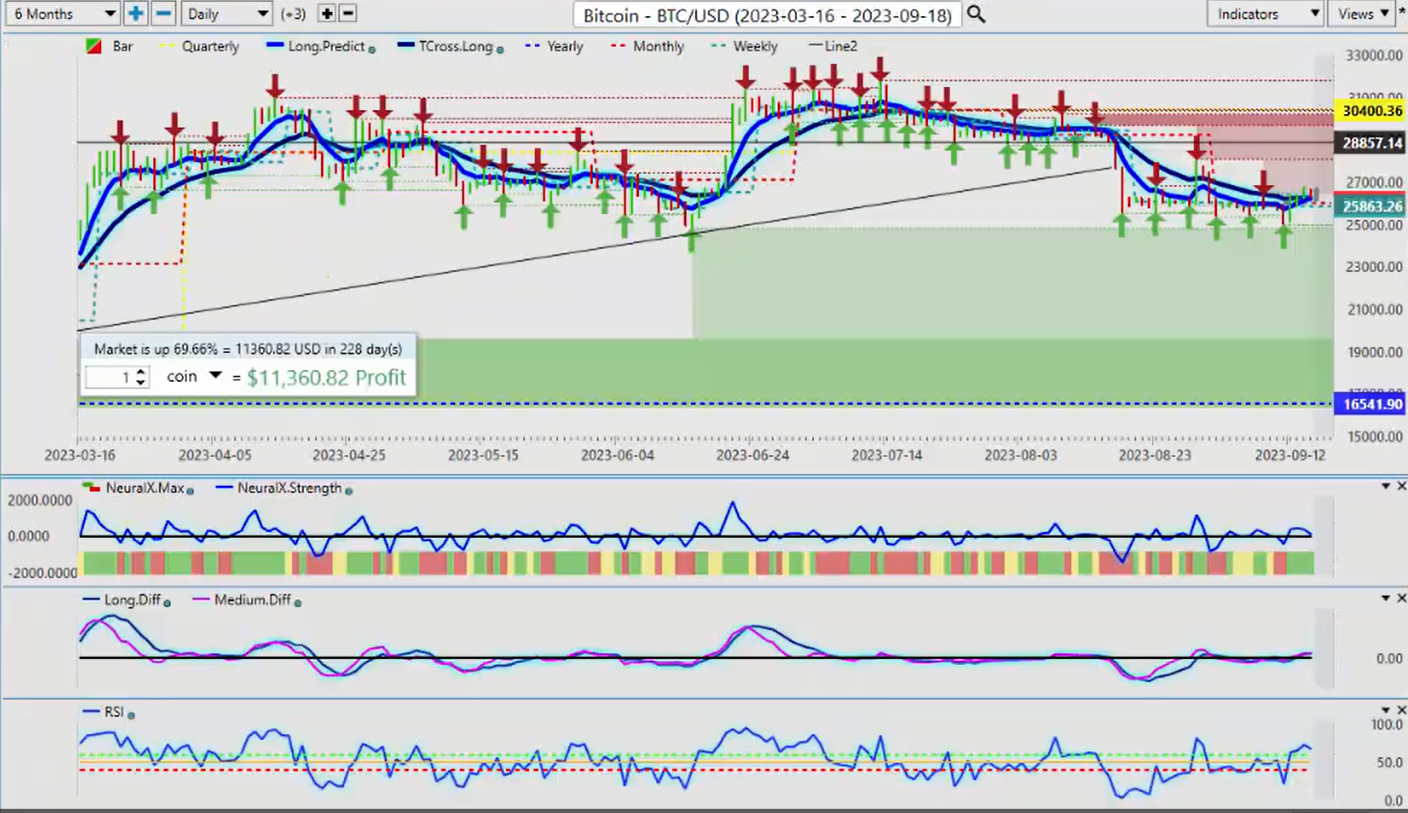
Now, when we look at Bitcoin for next week, once again, I anticipate that Bitcoin , as I’ve discussed in the Vantage Point live training room and in this particular weekly Outlook, that about 80 percent of the time, in the early part of October, Bitcoin starts to rally. And Bitcoin has also shown a very high correlation to Gold contracts as of late. So gold could indirectly be helping, or Bitcoin could be helping gold, or vice versa. But right now, when we look closer at this, this is the one thing we want to make sure is that we can see we are firmly above the yearly opening. Remember back in March, guys, when they said, ‘Don’t buy stocks, don’t buy Bitcoin , only buy US dollars’? What a horrific trade that actually was. When we look at this again, using accurate anchor points, using the point in time, then we can say, ‘Well, you know what, it never actually really got below that level this year, to any real extent.’ Then again, how can they say something’s bullish when it’s positive on the year?
So right now, Bitcoin is showing signs of life, but I don’t expect it to move up until the end of the month, when the dollar starts to move lower. So a mixed signal here, but right now, we are holding above that very important monthly opening price at twenty-six thousand thirteen. As long as we’re holding above this, the more likely Bitcoin seasonality is getting ready to kick in, which, in most cases, is around September the 28th when the dollar tanks. So again, be very mindful of that, because this is an Outlook, not a recap of something that’s already happened. Very important that I stress that, that we’re looking forward in these in our trading, not backwards, because again, we can’t go back in time and pick these trades up. We look as much as an advantage point live trading room, we look as much as a month in advance for some of these particular positions.
Light Sweet Crude Oil
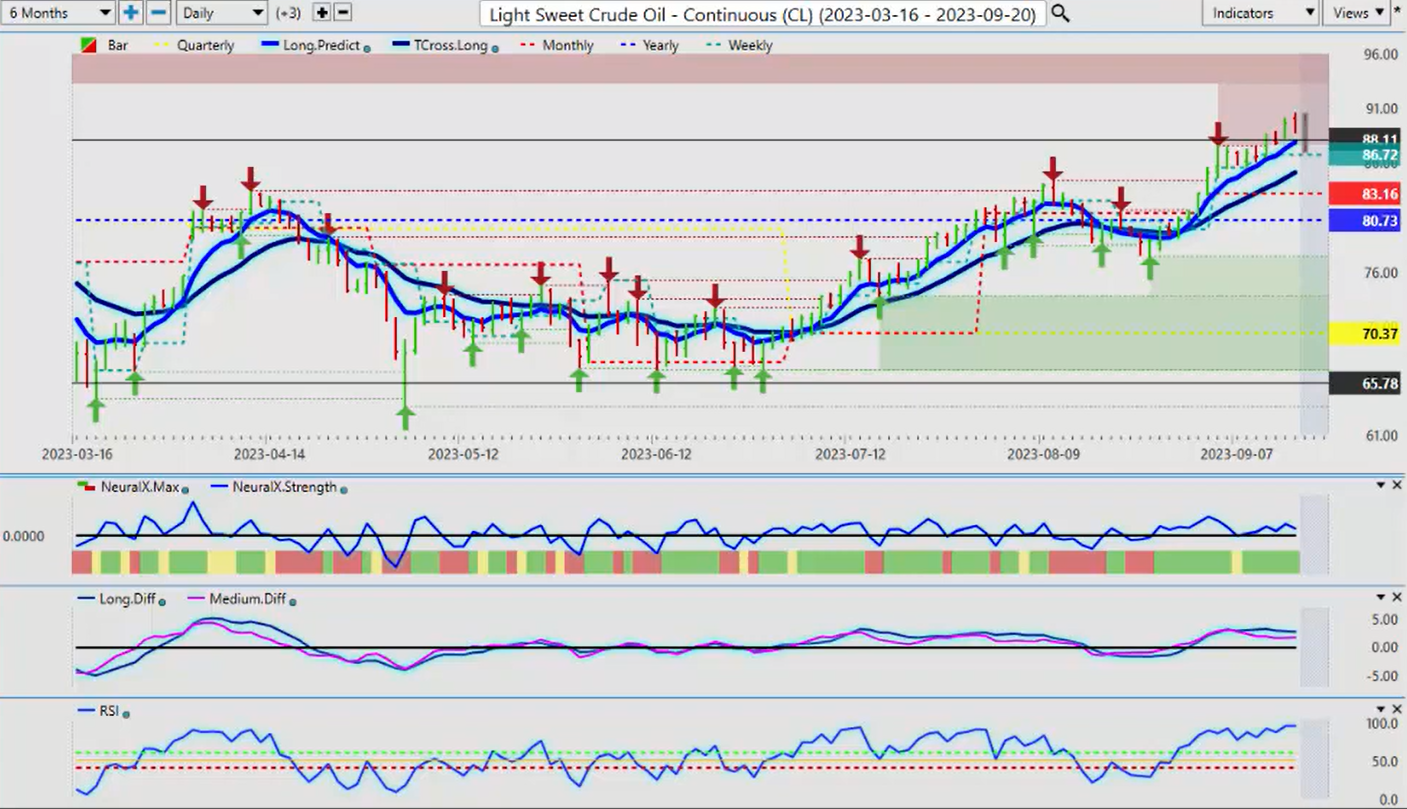
Now, Light Sweet Crude Oil continues its advance, and you can see that we’re holding right along this long-predicted the long-term crossover with only the predicted moving average. But again, we’re nearing the end of the oil rally, in my respectful opinion, based on that seasonal pattern. So again, when we look at this, I would say, okay, maybe a little bit more upside, but in actual fact, our MA diff cross has moved to the downside back here, around 87.86. So I would argue that this is out of fair value up here, and that a short trade could be coming within the next few weeks, maybe as early as next week. We’ll see what the FED does, but for now, these indicators are warning that this trend in oil is nowhere near as strong as what it appears to be.
Now, with some of the Forex , looking at some of our Forex pairs this week, starting with the most popular Forex pair, of course, is Euro US .
Euro versus U.S. Dollar
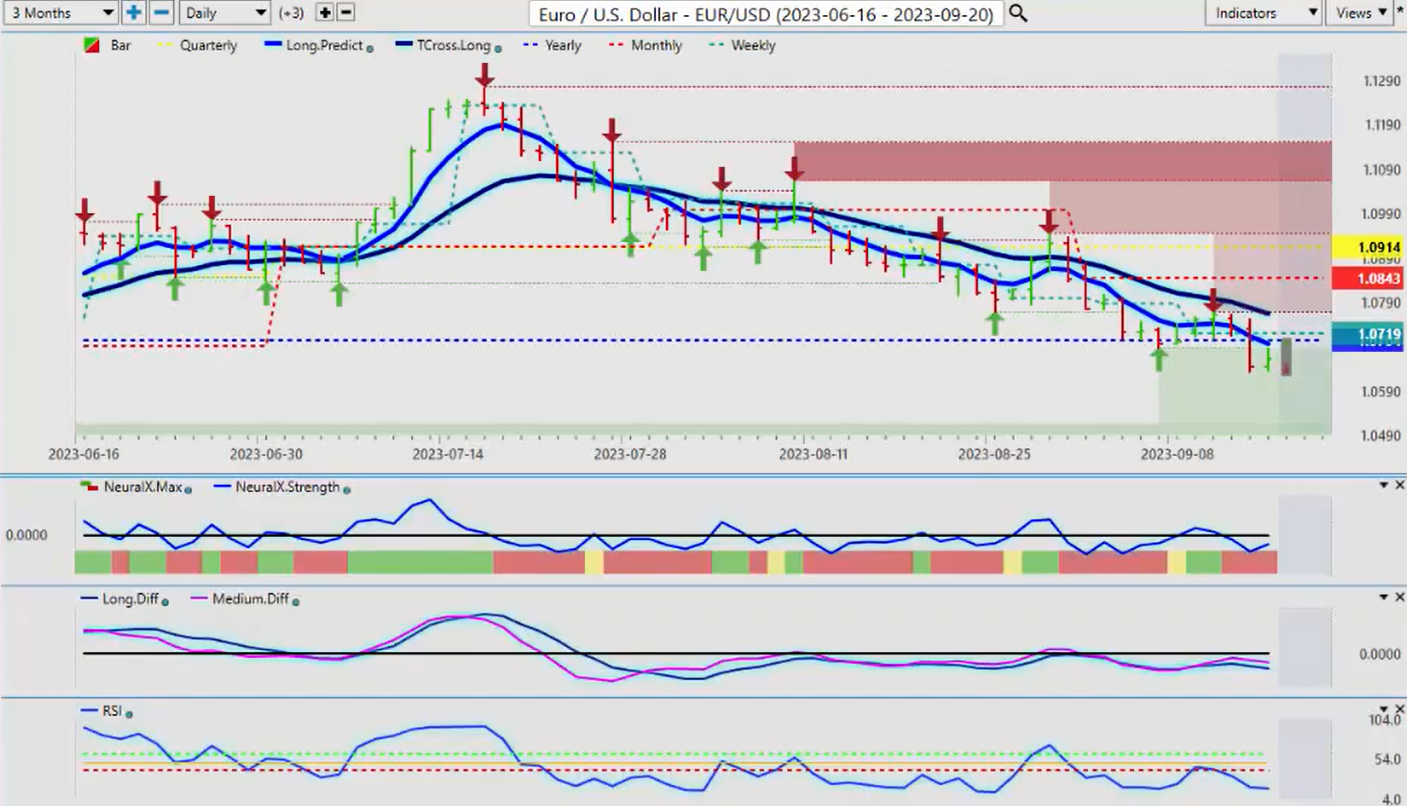
Now, that’s surprised from the ECB. My interpretation of it is one and done, that they’re not looking to hike any further, and obviously, the Euro was hit by that significantly. But more importantly here, guys, once again, we’ve got to be cautious of a bit of a potential bear trap because of the time of year, heightened volatility between September and November, dollar seasonals, gold seasonals, a number of seasonal patterns kicking around this particular time. So what I would be very cautious of is this yearly opening price at 107.04, because this, again, is a leading indicator in this case, not lagging, guys. This is stationary; it’s not moving. So as long as we’re holding below that yearly opening price of 107.04, shorts are viable. But in my respectful opinion, this short trade on the Euro is likely on borrowed time here. If the dollar sells off, as it normally does in mid-October, then either way, the Euro benefits from that. Right now, again, that neural index strength indicator is pointing up, not down. So another way of playing this is putting our limit orders above the yearly opening price. So if it clears 107, stays above 107, then we know that we’re likely to retrace to our T-cross long. But if we lose that, then we could move even higher. Now, the quarterly opening here, 109.14. But remember, on October the 1st, that quarterly indicator will change, and depending on where the market is. So right now, it there is definitely a bearish bias here. But let’s say the FED does the same thing the ECB does and says, ‘Okay, one more hike, and that’s it, we’re done.’ Well, it would probably; the dollar would suffer a similar fate to the Euro. So that is something we would watch very closely.
U.S. Dollar versus Swiss Franc
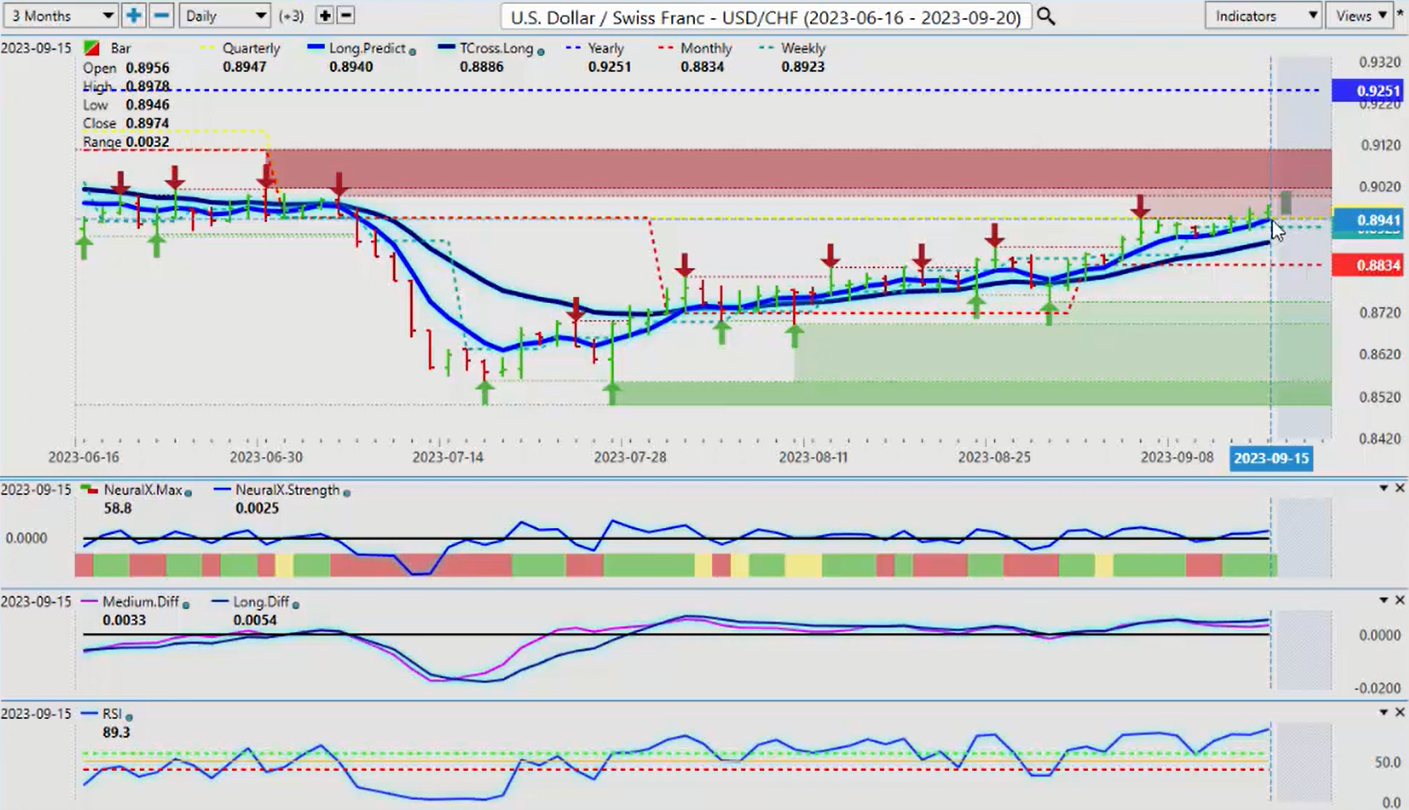
Now, the US Swiss Franc has been a very, very good long trade. We’ve talked about this one over the last several weeks. But right now, it’s basically at a make or break point. You can see that much like that Tesla stock, it’s not getting through that quarterly opening price. But in the last two days, it has. So I would imagine we’ve got another few, maybe in two to four weeks, of buying this particular pair. But when the dollar index turns lower, you can take it to the bank, no pun intended, that this is likely to follow lower also. And again, the appreciation, the Swiss Franc has had against the dollar is unparalleled, actually; it’s very, very strong. So again, the indicators right now are warning that we still have some upside left, but again, keep a very, very close eye on that quarterly opening price; we need to maintain above that particular level.
British Pound versus U.S. Dollar
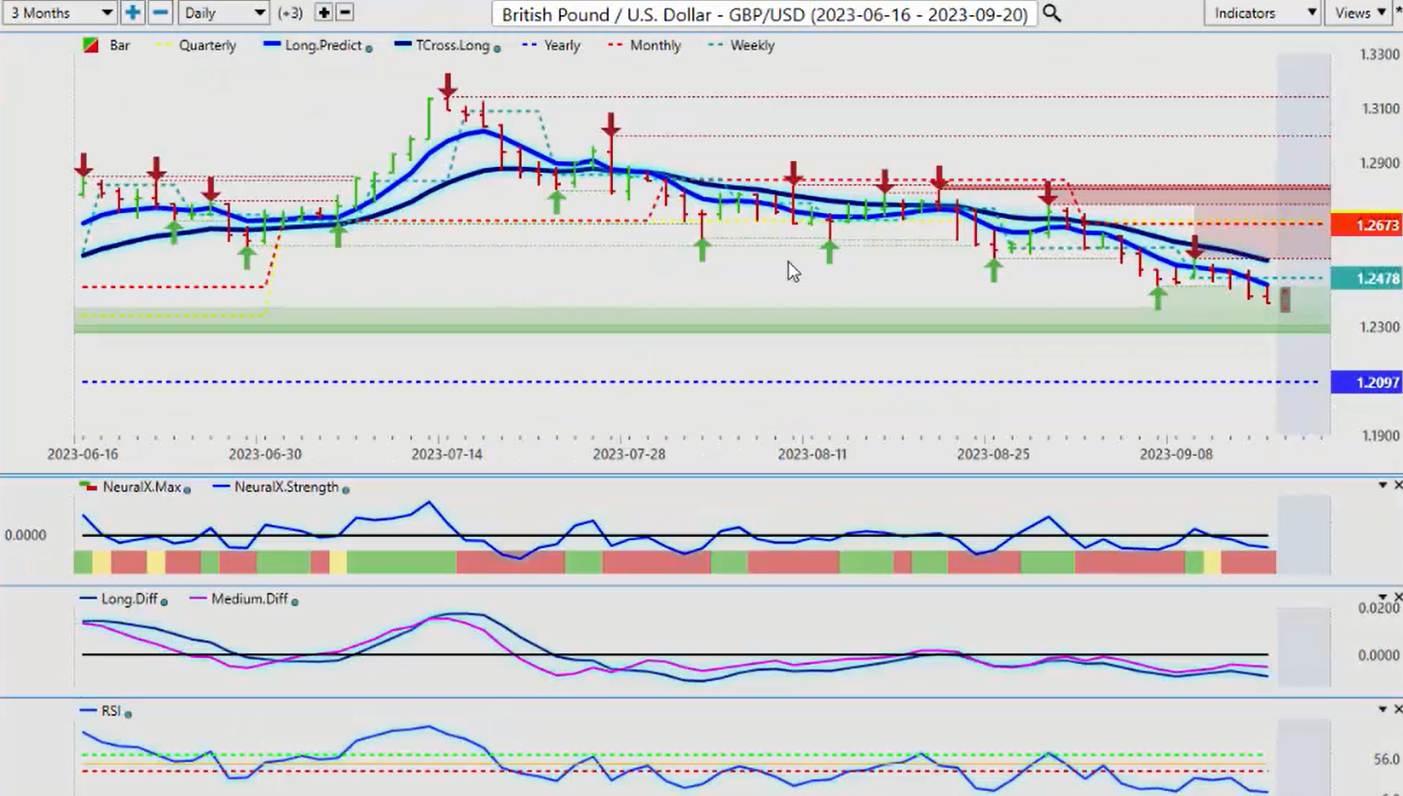
Now, with the British Pound, again, we’re going to see something very similar here. We’ve crossed over the month; we’ve started the month basically, very similar to the S&P 500, Tesla, some of these different stocks. And again, we’re holding below the monthly opening price, but we’re still positive on the year, 120.97. In my respectful opinion, likely by mid-October, if that seasonal pattern on the dollar comes to fruition, then this would rebound. So I would be on the hunt, looking for longs towards the end of this particular month. But the Vantage Point indicators are saying not yet. So when we get that buy signal, we’ll have our MA diff cross moving above the zero line and our neural index strength. I’m pretty confident the neural index strength will give us the signal we’re looking for around the first to the second week of October.
U.S. Dollar versus Japanese Yen
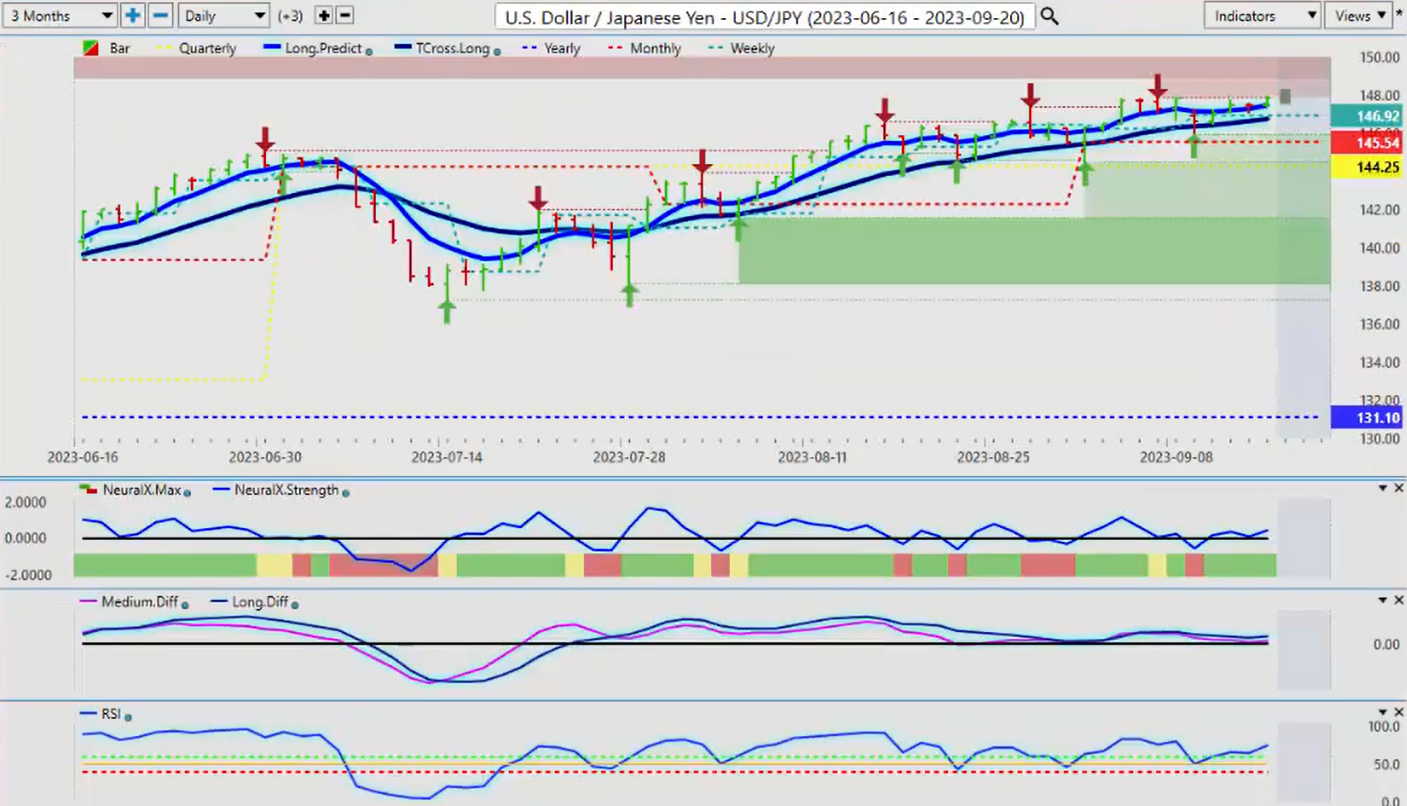
Now, with the Dollar Yen , again, no stopping this, and I will give everybody fair warning here.
I’m not sure if everybody knows what happened last Sunday night, but I suspect the Bank of Japan is going to pull a similar stunt here. So what they did is they came up with very hawkish comments last Sunday, and the dollar yen had a massive drop on Sunday night, in my respectful opinion, only. They did that in thinner liquid markets to get the best bang for their buck that they could to weaken the dollar against the, or strengthen the Japanese Yen by suggesting after all these years, they may be willing now to hike rates. So they’re using that to try and, again, get their currency out of the doghouse here. But they put it there to begin with by saying they would defend the 100 levels. So dollar yen , you can expect heightened volatility on this pair, but be careful on Monday night because, again, they are likely going to be in there trying to do the same thing again by, by again, strengthening their currency. So I would be very cautious, but this is clearly in a very powerful uptrend based on that carry trade.
Now, the other side of that is if the carry trade, if the equity markets or the S&P collapses below 1450, you get a global sell-off in the equity markets, that in itself would strengthen the yen. So there’s a number of reasons to think that this pair could move lower based on Bank of Japan intervention or a global sell-off in the equity market. So be very mindful of that if trading this particular pair.
U.S. Dollar versus Canadian Dollar
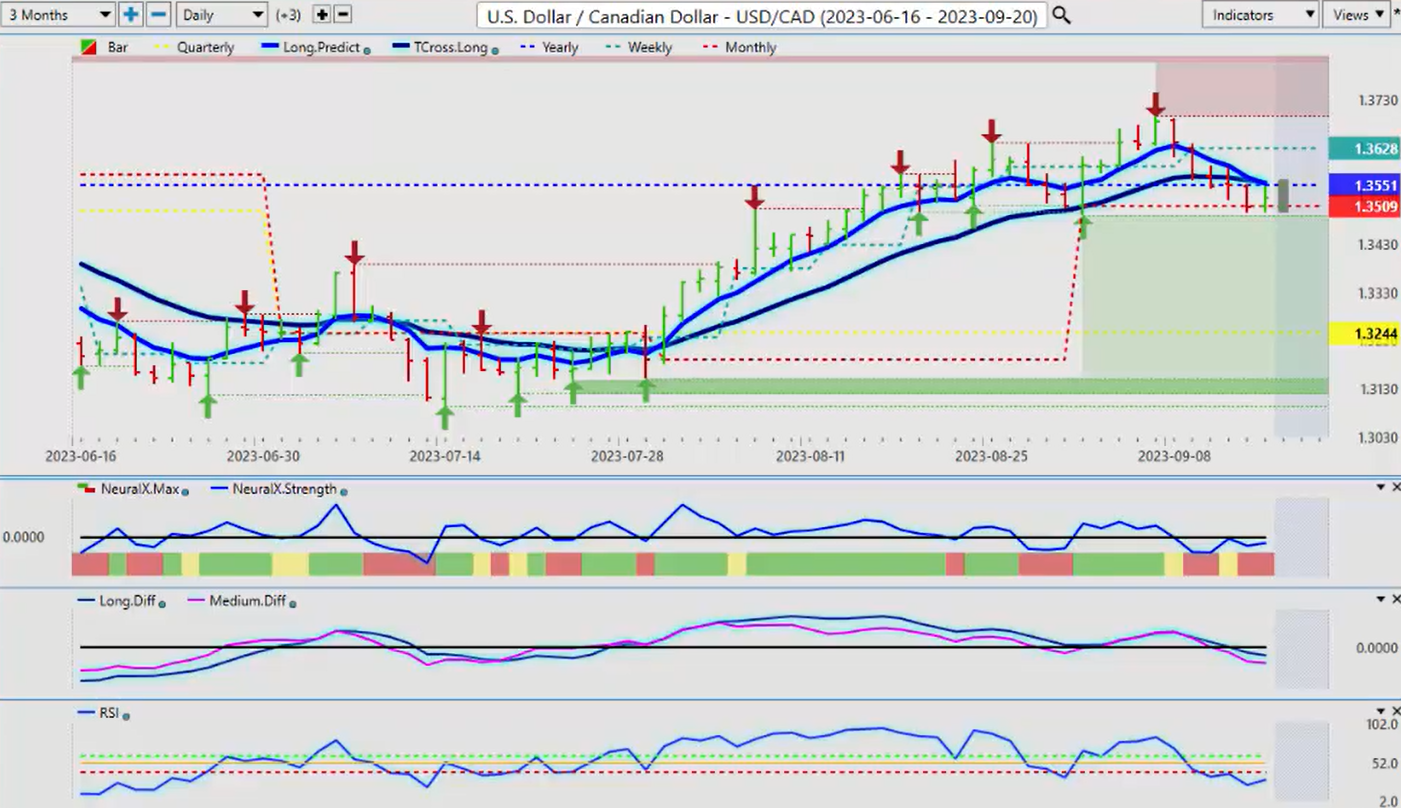
Now, with the US Canadian pair, this is kind of a goofy currency pair of late, guys. But again, you can see two days in a row, we’re hitting the monthly opening price, that low of 134.94. Again, guys, with the risk of sounding like a broken record, we’ve got to be careful with this one because this is normal. The Canadian dollar in oil is normally strong only up until the end of summer driving season, which will likely conclude in the next few weeks. Once we get into October, we usually see oil prices move lower. So again, we need to be very, very cautious here because you can see the neural index and the neural index strength is seeing very different signals here. So right now, the main thing we need to do is break down below the monthly opening price of 139.09 and stay below this level because you can see it’s struggling right there and using a current, again, if I went back a random 30 days here, guys, this is exactly what we don’t want to do because what we would be doing is getting a full signal or a lagging signal right now. If the buyers are going to remain in control, we need to stay above this monthly opening price, or, you know, I would anticipate we’ll push down below it on Monday. But another thing I’ve talked about here is a notorious Monday-Tuesday reversal with this pair. So if it makes a big move up on Monday, then I would suggest you sell it late Monday or early Tuesday. But if it makes a big move down on Monday, the probability that it reverses higher on Tuesday is literally 85 to 90 percent over a five-year period on that Monday-Tuesday reversal. So just a warning not to get caught in that particular setup, but looking forwards, not backwards. In most cases, the Canadian dollar does not fare very well into October, November, December. Well, December it does okay, based on dollar weakness.
Australian Dollar versus U.S. Dollar
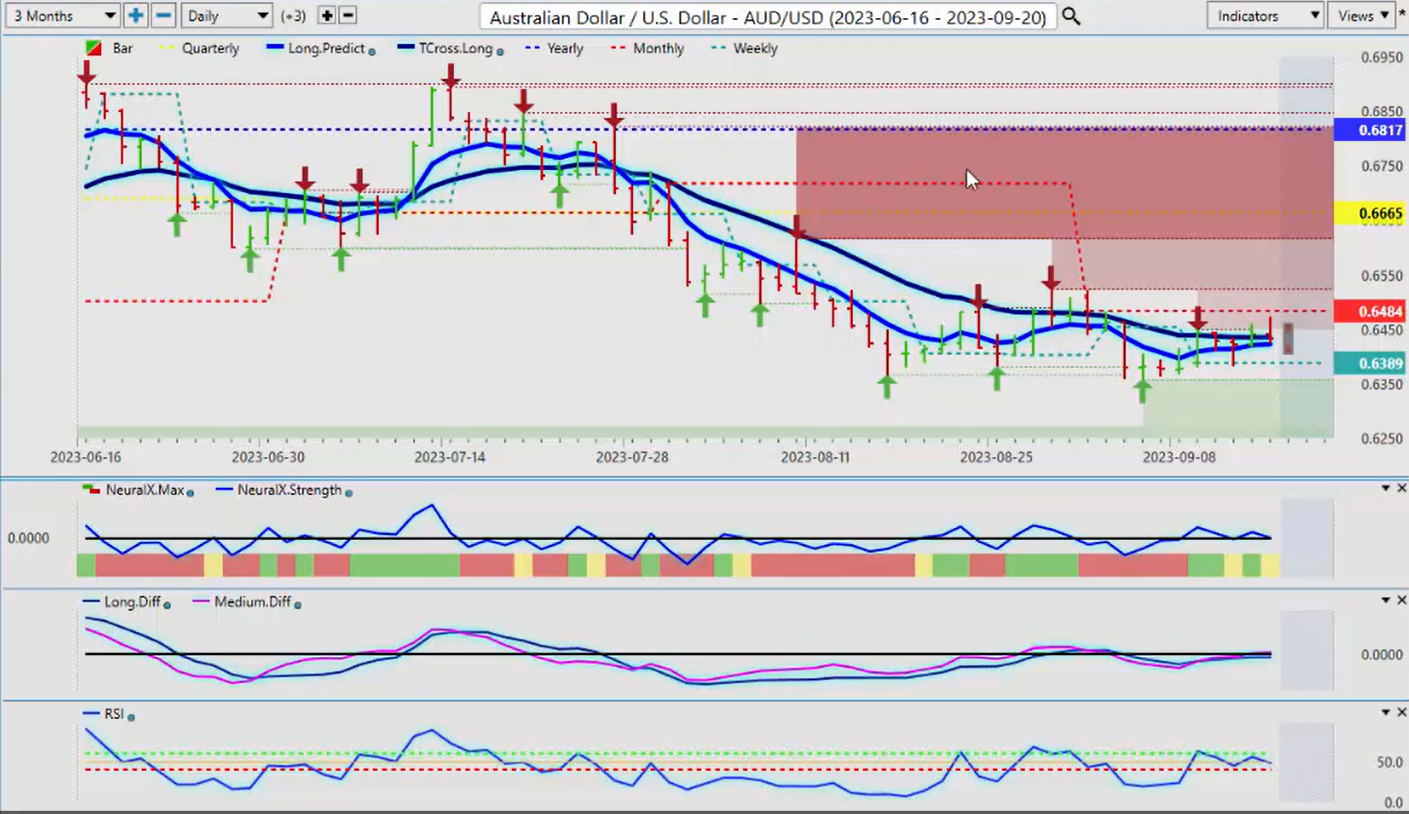
The Aussie and the Kiwi , both a couple of wild cards here also a little bit better data coming out of the Aussie employment numbers, but still not enough to get this thing positive on the month. When we look at this right now, we’re below the yearly opening, the quarterly opening, and the monthly opening. So 64.84, that’s the level. But the indicators in Vantage Point are warning yet again of another move to the downside, despite that labor report. Now again, we can connect the dots to the Aussie currency to the S&P 500 to individual stocks, maybe even to Tesla , that if the Aussie tanks again, that’s a leading indicator that that’s exactly what could happen to stocks because the correlation between the Aussie , the CAD, and the Kiwi to the S&P 500 is very, very high. These inter-market correlations, guys, are based on science, not on waves or all these other things, these wild and wacky tools we try and use.
When we forecast the weather, we have very specific things we use: satellites, space barometric pressure, seasonal weather patterns to dictate what the weather is going to be each day, each week, each month. So we try and apply a similar technology in our trading, right? So right now, I would be a happy buyer of the Aussie currency once I get positive on the month, 64.84. But the indicators and the accurate point in time is warning that it’s not ready to move higher yet. Mid-October, well, that could be very different.
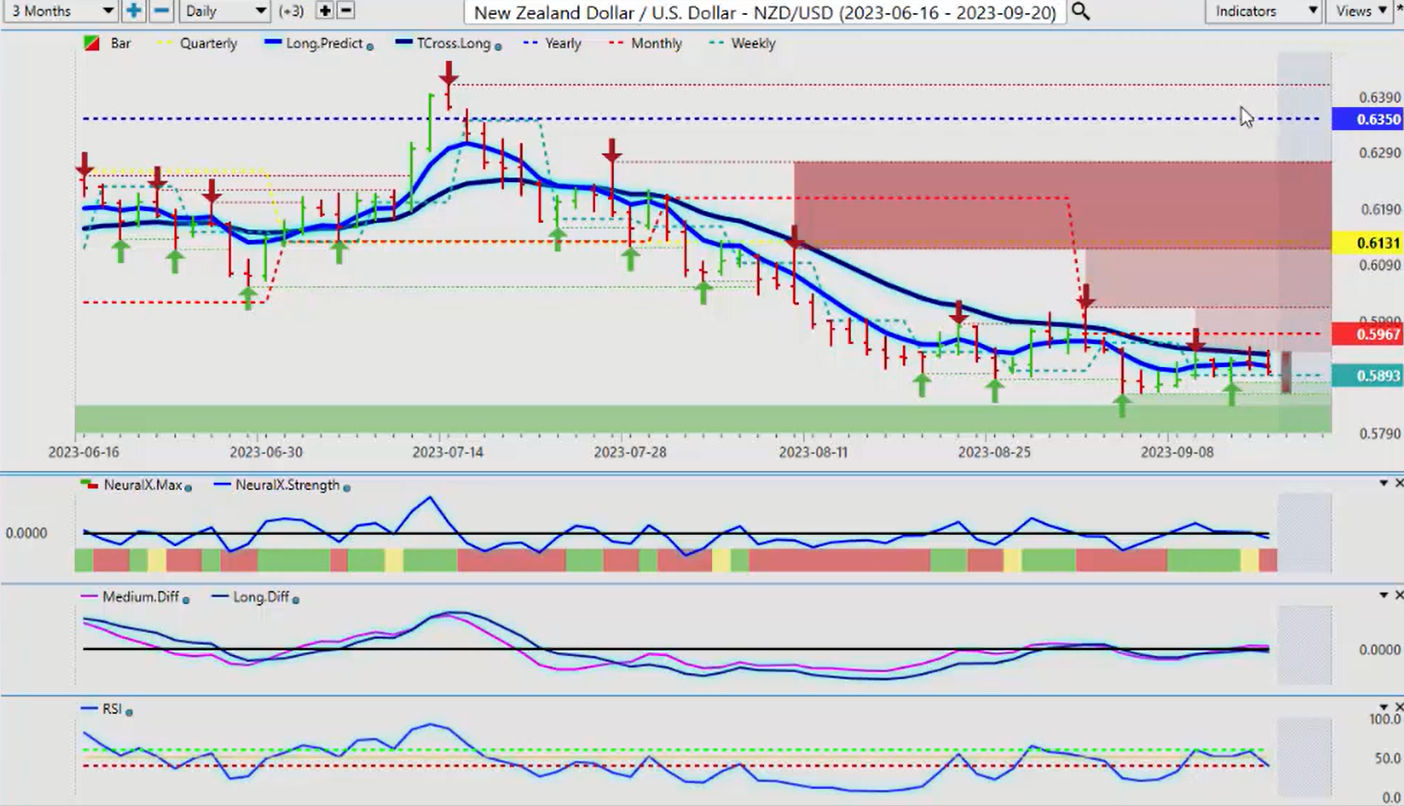
New Zealand Dollar versus U.S. Dollar
The Kiwi , we’re looking at a very similar methodology here. We’re below the monthly opening price, but we can clearly define a trend, and you’ll notice where this trend actually started, not on a random 90 days or a random 365 days, the yearly opening price. The second you can see the bull trap they set up for you, you there, then we close below the weekly opening price, and I don’t think I have to tell you what happened from there. It got downright ugly on this currency. And I know, including myself, it’s a head scratcher that we would be shorting when the Kiwi is so grossly undervalued, but it didn’t matter, guys; they’ve taken it all the way down to, down into this lower 59 area, where we’re closing the week at 50 at the 59 Mark. So again, I believe this will turn higher, but I don’t believe that’s going to be until probably mid-October, and that’s only provided that we get that dollar seasonal and gold pattern because if we don’t, then that could be even more pain ahead for the Canadian dollar, the Aussie dollar, and the Kiwi.
So, with that said, this is the Vantage Point AI Market Outlook for the week of September the 18th, 2023.