-
View Larger Image
Welcome to the Artificial Intelligence Outlook for Forex trading.
VIDEO TRANSCRIPT
Hello everyone and welcome back. My name is Greg Firman and this is the VantagePoint AI Market Outlook for the week of October the 23 rd , 2023.
U.S. Dollar Index
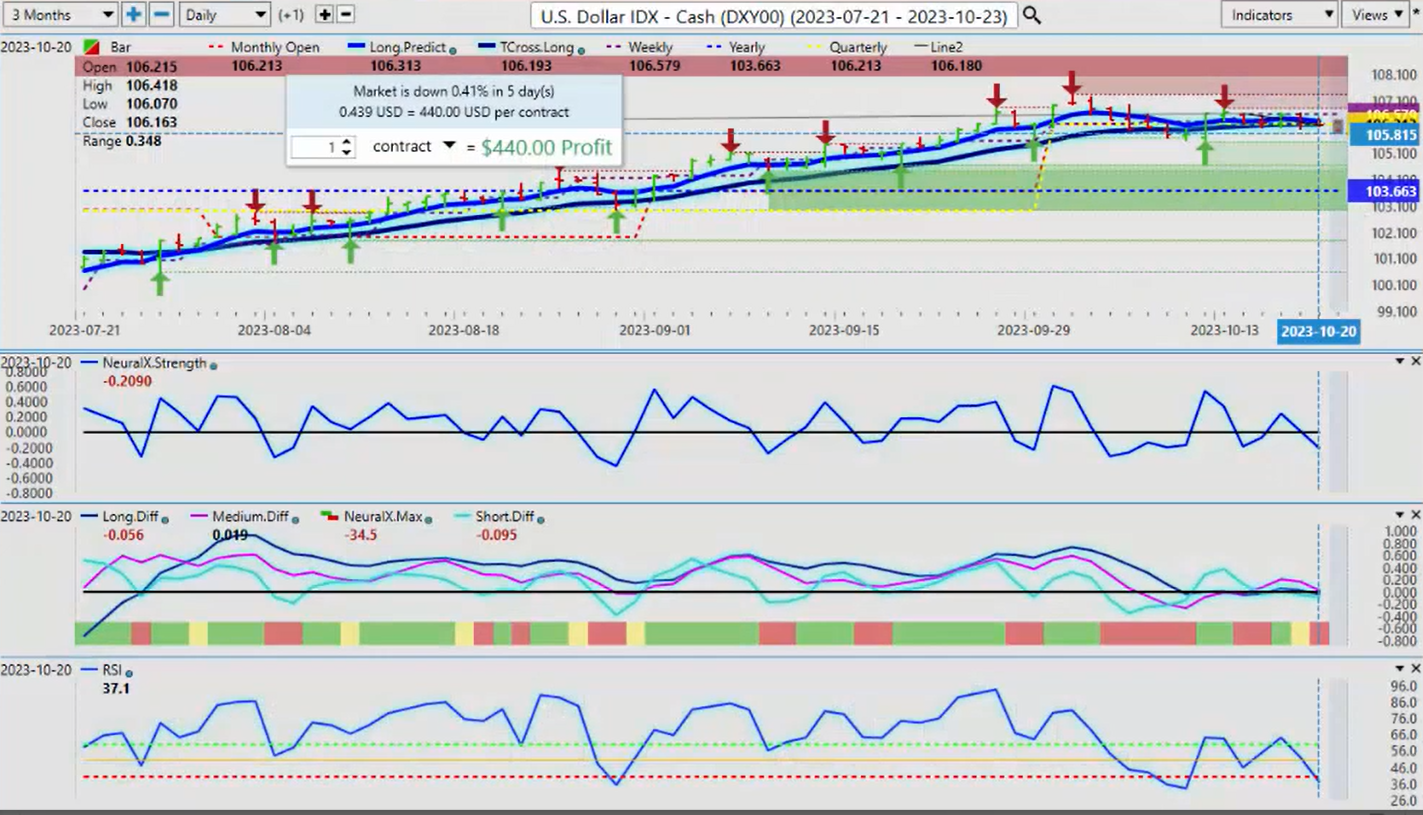
Now to start this week, we’ll begin where we usually do with the US dollar Index. Now what we can assess here again very important that we’re not getting wrapped up in Rolling performance here guys. We need to look exactly where we’re at in the month the week and the quarter. So right now the the resistance uh SL support is using that monthly and quarterly opening price because again what most people don’t realize is the US fiscal fourth quarter ended on October the 1st.
Now in most cases, the dollar slowly weakens through throughout the remainder of the calendar year last year being an excellent example of that where it peaked on October the 20th despite the Fed rate hikes. So right now the dollar continues to move sideways along the Vantage Point TR cross long but right now we can see we have the T cross long the monthly and quarterly opening price all coming in at or about the same level. However, the long predicted is now moved to 10631. So we have resistance on the dollar up to this level but we just can’t seem to get any buyers up here. So again, I believe that this is the warning sign but also don’t forget we have that period of known US dollar strength at the beginning of the month, albeit very short lived, it is still likely going to happen at the beginning of October, so the closer we get to excuse me to November 1st the more likely it is we’ll see some dollar strength. But for now we remain above the current yearly opening price again guys we don’t want to be looking back 365 days that’s what we use seasonal patterns for we don’t want to measure our performance where we’re at using random a random 5 days a random 30 days or a random 3 65 days. We need anchor proper anchor points to determine where we’re at in the current Trend so the dollar is struggling the indicators our neural index strength is pointing down our predicted differences are pointing down the predicted RSI is now at 37.1 which is suggesting that momentum to the downside is building now.
If that is true then the equity markets we would look for the equity markets potentially to turn around now we have verified support at 4219 the bulk of the selloff has come off on Wednesday the initial move is higher. My concern here which is which is uh sign a significant concern, is we have broken below the current quarterly opening price at 42.84 so what I’m looking for is I want to see the market retake this level by month end. If we can’t, then we could
see further downside but make no mistake here guys,, the stocks are have been positive the bulk of the calendar year, the S&P 500 yearly opening price 3853 so again we very often in the month of October, and November we could potentially retest that yearly opening but that would be a premium long only in my respectful opinion because of the seasonal pattern with stocks. But the immediate support that we would need a sustained break of would be
- If we do get break down below that particular level, then yes there is very little support between there and the yearly opening at 3853.
Many years I’ve seen a flash crash that lasts for a day or two goes down hits the current yearly opening price and then shoots right out of there and allies the remainder of the year so keep that in mind. But currently for the week we’re down 2 .81% on the week but on the month we’re we’re not down anywhere near that amount so again watch those level levels very closely.
Gold
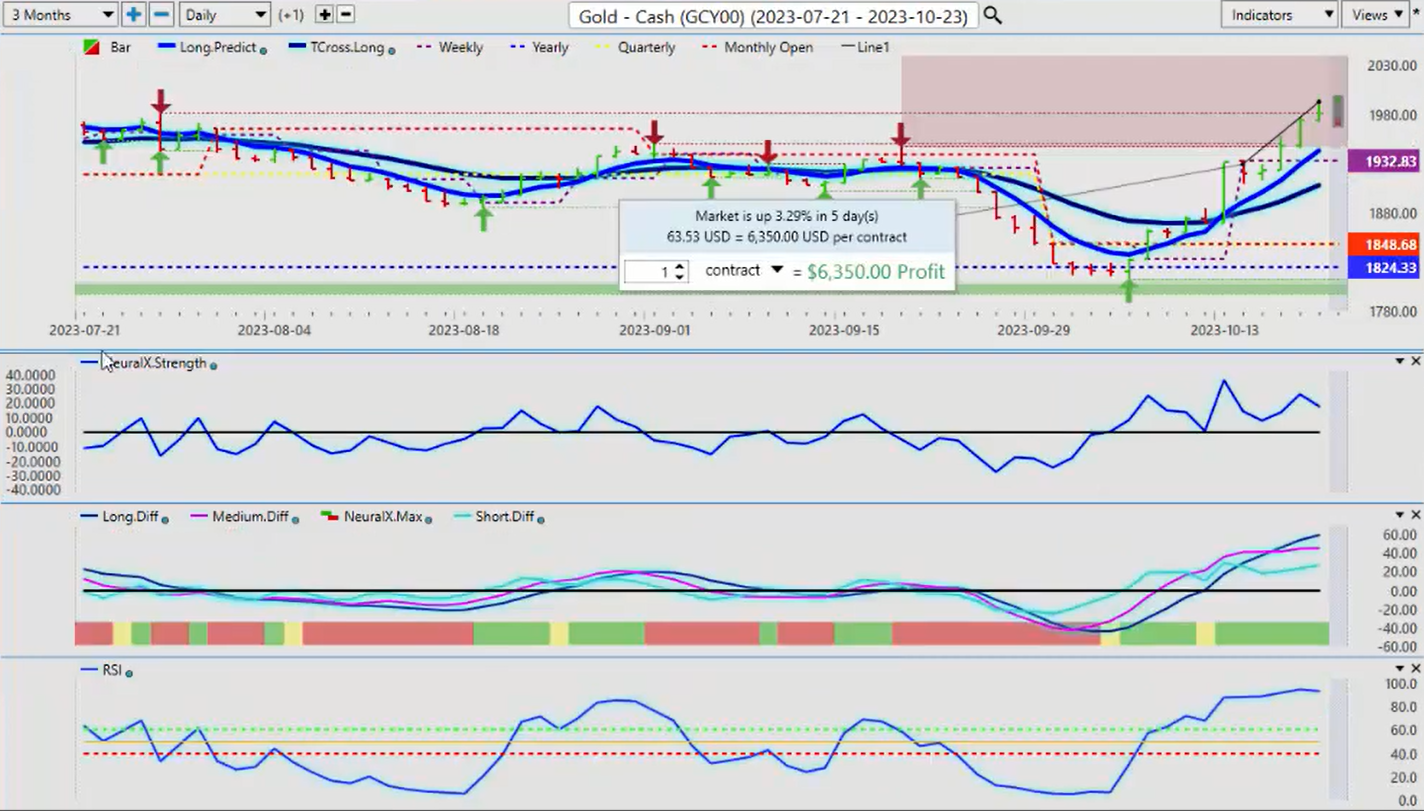
Now with the gold contracts gold, continues to shine here, pardon the pun, up 3.29% on this past week. but the real move guys occurred down here. Now I’m nota a huge fan of of oscillator based indicators. I like a definitive signal the pink line, the medium-term crossing, the long-term predicted difference, this went off on October the 3D or October the 4th. In the modified predicted RSI. Soon as we moved above the 50 line but when we moved above the 60 level at that same time we crossed above the VantagePoint Long predicted. and we’ve had a substantial rally now of course that the Israeli-Hamas conflict has played into that. But the reality is in getting out in front of this in the October 9th presentation. I did go over this and said “look we’ve got a seasonal pattern here” the non-farm payroll number of that particular week was not good. It was again the U6 number, is moving the wrong way, that is based in the argument the secondary and third argument that I made is, that yes that people looking at long-term seasonals, it shows gold is is softer in the month of October over say 10 years, or maybe even 20 years but the seasonal pattern over the last five years is showing something very different it’s showing an 80% bullish signal on gold. That Trend or that longer term seasonal pattern has shifted to the upside and again this buy and vantagepoint and the seasonal patterns this happened long before the Israeli-Hamas conflict and even if you look back at the rally with the Russia Ukraine, gold didn’t rally anywhere near this amount. So in some ways, it’s a perfect storm,. with what’s happening in Israel and the fact that we were coming into a period of known gold strength. So a nice move up here very strong move. And I get this question almost weekly, do I think gold will retake the 2,000 Mark, and in my respectful opinion, yes it is a very strong possibility but nothing goes straight up, here the further we move away from the long predicted and the T cross long, the more likely it is we’re going to have some kind of retracement, which has nothing to do with Fibonacci waves or any of this nonsense. What it has to do with is you’re simply going to run out of buyers here, or they’re going to take profit. When they do that price drops it needs to correct. You know if you look at a boom in the real estate market if the house that normally sells at uh 300,000 is selling for 700,000 then you’re going to have less buyers that are going to are willing to pay that, so we’re looking for I would I would say a minor retracement, probably back down between 1943 but as long as we’re above 1907 the uptrend in Gold remains intact, because again the point that I was making after the non-farm payroll number is we went sideways along the current yearly opening price uh for about four or 5 days. After the non-farm payroll number we closed above the current yearly opening price . That set this trend in motion, and again, so if if things calm down in the Middle East, I think that’s unlikely at this particular point. So we will see but we do have a warning sign, here the same thing that put us into the gold long trade potentially now is warning us that this may be getting a little exhausted up here so watch for those two retracement points.
Bitcoin
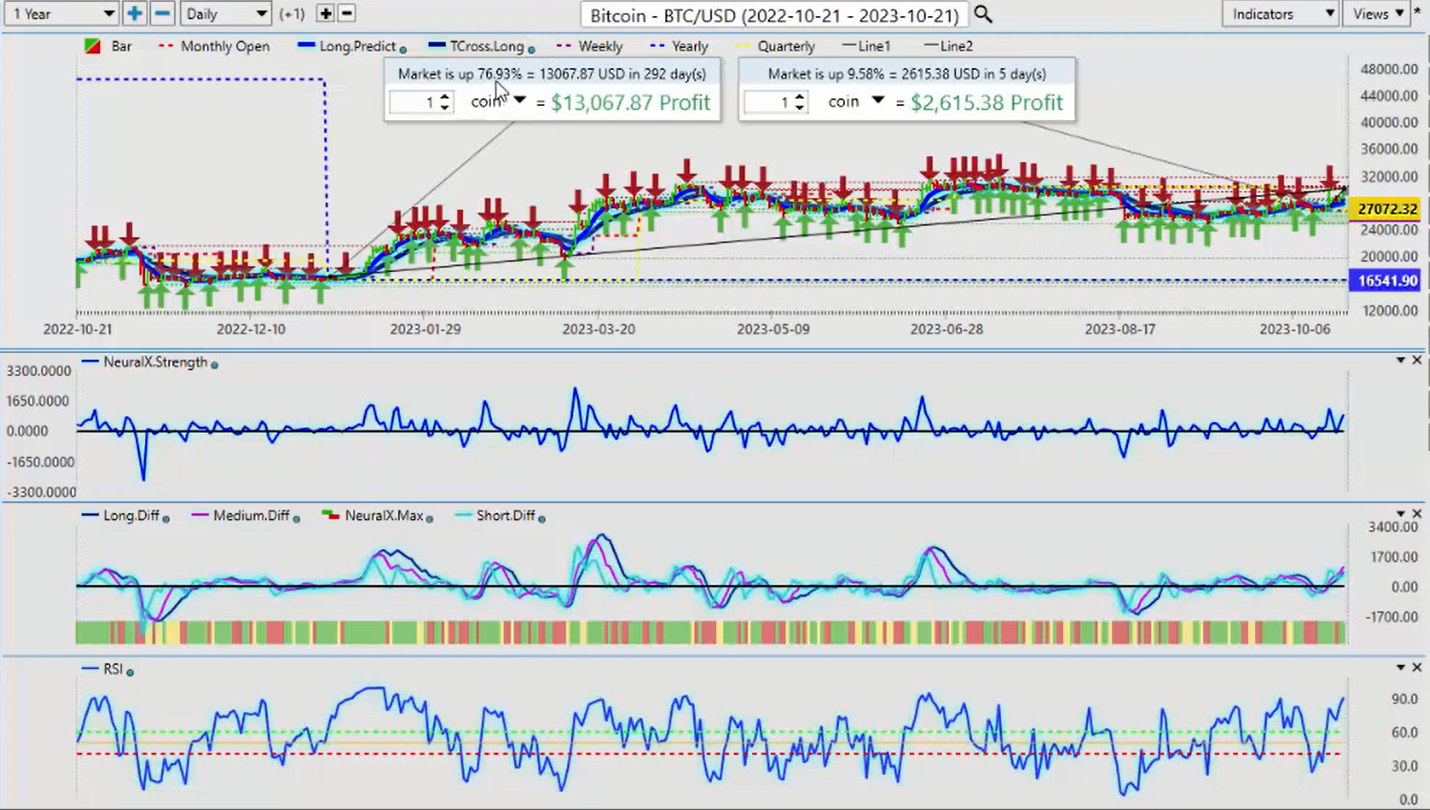
Now, the star of this past week as predicted was Bitcoin. And I’m still frustrated by this media is actually having the nerve to say Bitcoin is a terrorist currency, and they said this prior to this massive rally, that we’ve had this week Bitcoin up 10%. I have repeatedly talked about this in the month of September be prepared to buy Bitcoin in mid October in the VantagePoint live trading room. but what really confused me in this, last on Friday watching, uh watching one of the news channels I won’t name names but they showed that if you invested $50,000 in crypto at the beginning of the year and what if you invested in real estate and stocks and they showed these different Investments and real estate was at the top and they actually had the nerve to say that Bitcoins, if you invested 50,000 in Bitcoin they didn’t say what type of Bitcoin, but I would naturally assume Bitcoin versus the US dollar they’re saying you’re up between 3 and 8% that is simply not factual. Bitcoin is up 76% on the year and if you remember in the earlier parts
of this year when they were calling for 5,000 in Bitcoin 6,000, 8,000 in Bitcoin I was dead against that analysis because if you look at Bitcoin uh whenever it’s been down % or more in a calendar year it’s actually rallied a minimum of 50 to 80% the next 3 years so that pattern is in motion yet again repetitive patterns in the financial markets guys is a thing it really is a thing it we see it happening with the dollar at the beginning of each month they must buy dollars so when we look at Bitcoin closer this past week, I would argue the previous week was a setup by saying that Bitcoin is not going to make it. Bitcoin is a terrorist funded currency, but then mysteriously this is what happens on Monday. And again, I would argue the same thing was happening on gold at the beginning of October. They’re saying Gold’s lost its Luster, Gold’s going lower it’s going to they actually said that gold is going to continue its downtrend when it was never in a downtrend this year. So that part alone would confuse the average Trader. But Bitcoin still looking very strong and in most years Bitcoin remained strong into the uh first or second week of November. But what also I found curious this past week, with the media is they’re left scratching their head saying well we don’t know really why Bitcoin went up is it a flight to safety. Now maybe there I would argue there’s a strong seasonal pattern and there’s a strong year-over-year pattern at least over the last 10 or 15 years, on the down year 50% or more you see a rally for the next three. So again Bitcoin is not up 8% on the year, Bitcoin is up 76% on the year very important that we understand that the indicators uh are still saying we’ve got a little bit more upside but again watch for some kind of retracement those two levels 28555 and 27,800. The Vantage Point Long predicted and T cross long. But now we have the quarterly opening here at 2772 that’s another additional level to watch.
Light Sweet Crude Oil
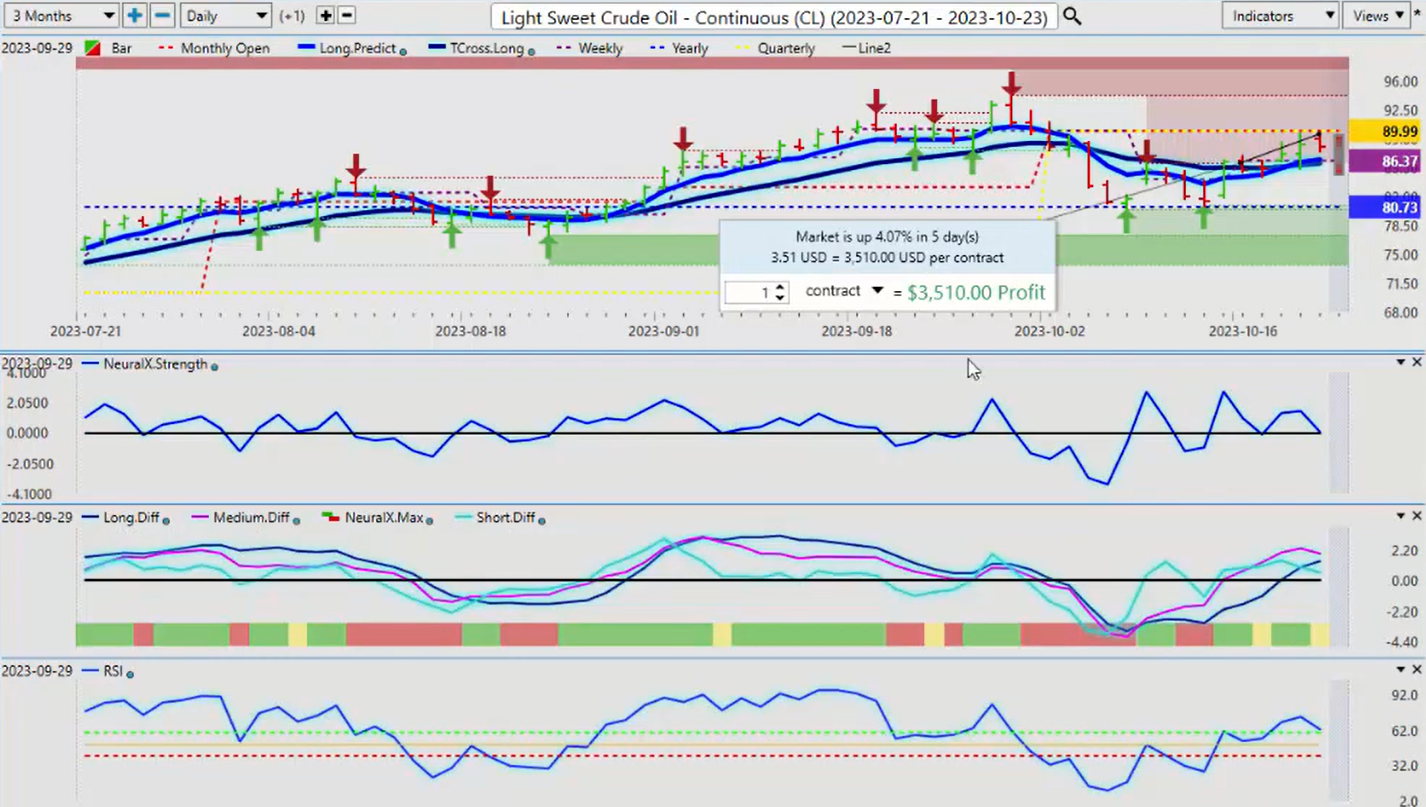
Now, light sweet crude oil has rebounded this past week for a bit of a rally. There, 4%, so obviously, the commodity side of the trade this past week has been very good. However, my concern here is that we have failed two days in a row. And once again, this is the main reason we want to avoid lagging rolling performance models. Guys, this is the current monthly and quarterly opening price. We have failed two days in a row, so this is there’s enough meat on the bone for any type of trader.
The way that this can be played is you can sell as long as we’re holding below 8988, the quarterly opening price. Or you can set up buy orders above 90. When we clear this level, then that would tell me we would likely be moving up to at least the 94 level. So, obviously, that is the latter is biased because of what’s going on in the Middle East and no sign of any real resolution. So again, the indicators from Vantage Point are, however, are not overly supportive of what I just said.
So this will be a very interesting week for oil. But remember, guys, know your levels. Okay, we don’t want to look at 5 days back or random 30 days back. We need proper anchor points – the beginning of the month, the beginning of the year, the beginning of the week, the quarterly. Very, very important. And this is not a coincidence that oil failed to break down below 80, the current yearly opening price. But if you were using a random 365 days in a rolling performance model, you wouldn’t have even seen that. You would have gone with the talking heads that are saying that oil was ultra bearish at that time when in actual fact it was a premium long, right? So these are the things we want to take into consideration.
But I would argue, uh, trade what we see, not what we hear. And I have a growing concern with some of the media outlets and the information that they’re providing is either false or a half-truth or just downright misleading. Uh, so always make sure that you’ve got your own trade plan in place here, guys, because there is some very good opportunity if you know your levels and you trade what you see, not what you hear.
Euro versus U.S. Dollar
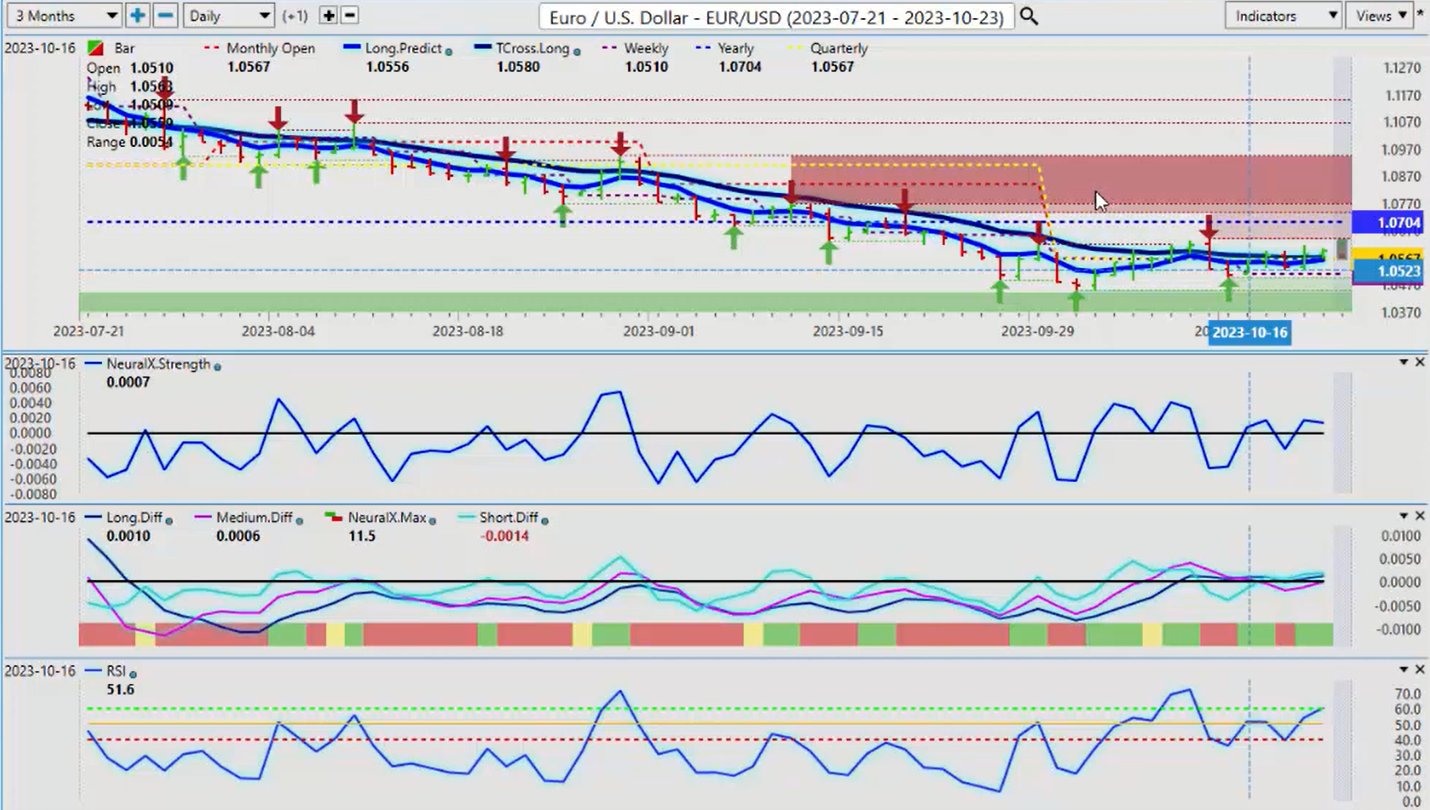
So when we look at this, some of the main Forex pairs with the dollar stalling, that is given rise to the euro. So this entire past week, we started right out of the gate because we had that period. We know that the dollar Index is not above; it can’t hold above its quarterly opening price. So that means the euro is going to remain above its quarterly opening price. Now, that is coming in at 105.67. That is the level we keep an eye on. We have the ECB next week. I believe they’re going to let some steam out of the currency. I don’t believe the ECB wants a stronger Euro, so they’re going to try and kill this thing. So keep an eye on it.
Right now, we’ve got a mixed bag on the indicators, but it’s still showing 60.4 and a failure at the 40 level on the predicted RSI. This is a modified RSI. I’m not looking to trade overbought and oversold conditions, guys. I’m looking to trade market momentum intermarket correlation, seasonal patterns, repetitive financial patterns that can repeat themselves. So in this particular scenario, uh, again, the closer we get to November 1st, the more likely the dollar is going to, the euro, excuse me, is going to correct lower. So be prepared for that. But ultimately, again, in my respectful opinion only, the dollar goes lower into year-end. I’m not going to try and time this to the hour or the minute or I don’t need to do that. I’ve seen these patterns repeat over and over and over again. The dollar will strengthen a little bit in November, and it’ll strengthen a tiny little bit at the beginning of December, but outside of that, the dollar is likely heading lower, barring any further conflict or flight to safety.
But when we look at a flight to safety, then we have to look closer at where that money is actually going. We know it’s going into Bitcoin, we know it’s going into gold, and we know that, for the most part, it’s not really going into the US dollar; it’s going into the Swiss franc.
U.S. Dollar versus Swiss Franc
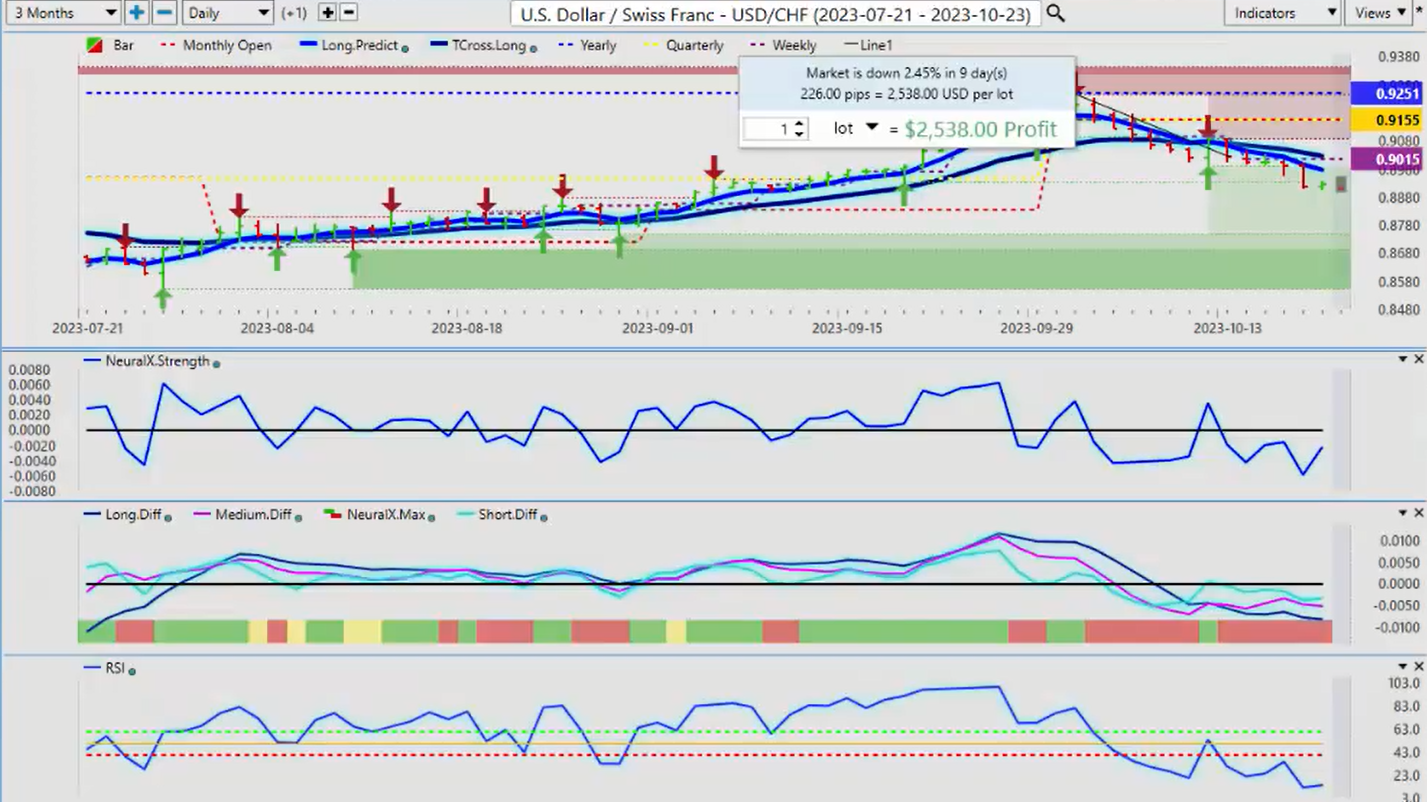
So once again, using the proper anchor points, the proper performance model, the current yearly opening price, I could care less what this did last year from a pivot standpoint. I need to see where we are in the year. This pair has not been able to overtake this yearly opening price, and we failed on again, September 27th, which I talked about in here and again on October 3rd. Once the dollar was done, its period of known strength, down it goes again. So again, our main resistance points are the cross long 96.69, 91.69. We’re getting a bit; we’ve got a 100 pip gap between these two. So be careful there. That’s but the monthly opening price 91.55. So the long predictive, that’s a big one for us that using that long predicted moving average is a pivot level. You can see every single day this week it went into that blue line. I’m not necessarily interested in trading a Blue Line crossing a black line but rather the predicted moving average by itself and using that as a daily entry point.
So in this particular trade setup, not only do we have the luxury of trading with the primary trend, being below the current yearly opening price, we’re also below the quarterly opening price, and we’re below the Vantage Point T cross long. We’re simply using the long predictive as a potential entry point. If I can match that to the Vantage Point predicted high of the day, that’s even better, but I’m going to target this blue line. So right now, again, a little bit of a concern because I don’t believe the intermarkets have come out of the dollar Index; they’re still mildly bullish on the dollar. We’ve got a reverse checkmark here. So a little bit of caution. Again, we could be seeing some dollar strength here, but it would be corrective in nature; it would not be a new trend, particularly at this time of year.
British Pound versus U.S. Dollar
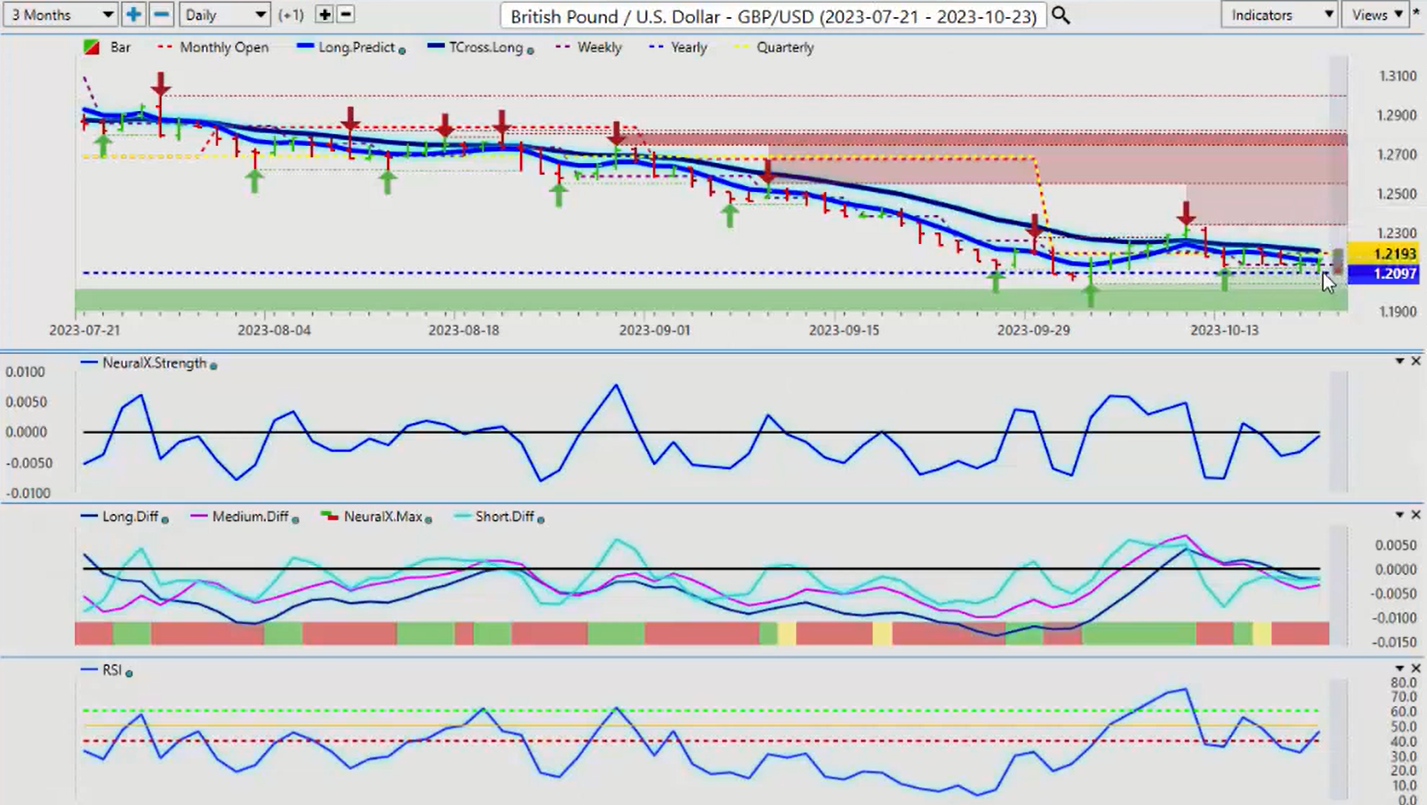
Now when we look at the pound dollar, once again, the pound dollar, very similar pattern here. We’re just hovering right along this yearly opening price 120.88. Again, here, guys, we’ve been down here before multiple times in September, October, the 4th, and we’re down here testing it again this past week, which was an easy long. So my concern is that we’ve got some divergence here. We’re hitting and failing at the T cross long, but the neural index strength is starting to rise; the predicted RSI is starting to rise, the predicted difference is there. So this is warning that, again, my view is that the dollar weakens into year-end, and that is not. It will show its the bulk of its weakness in December or mid-November. But I also believe it’s going to struggle here too. So any move below the yearly opening price, as you can see, we’ve had before, has been a buying opportunity. So again, when we look at the seasonal pattern of this particular pair, it does start to gain strength to the upside by the first week of November. But again, if we’re not breaking down below here, the indicators are warning us that we’re losing that downside momentum for last week. So again, that level there, the yearly opening price, 120.97, we need to stay above that. If we get a sustained break of, say, 3-4 days, then we can reassess. But the main thing here, guys, is know your levels.
U.S. Dollar versus Japanese Yen
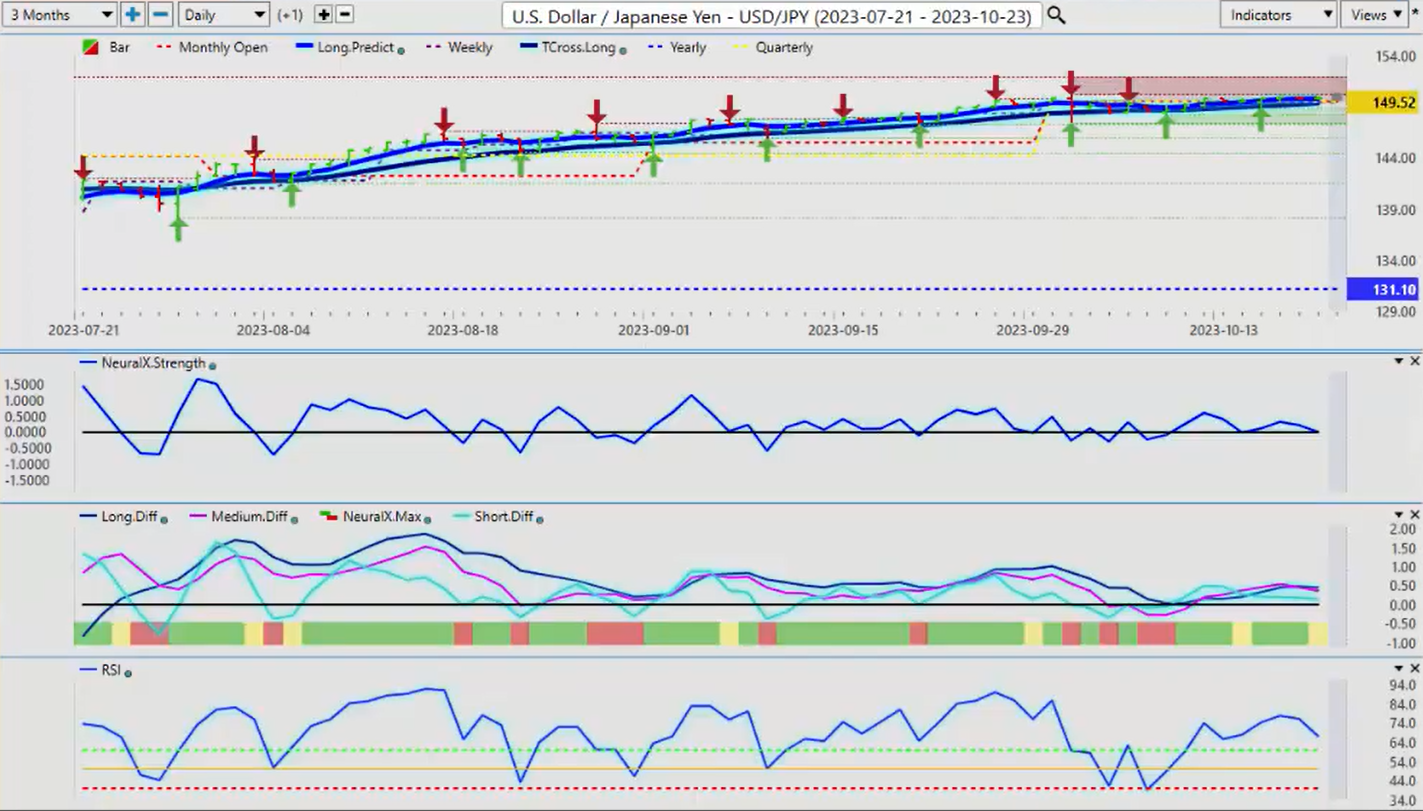
Now with the dollar-yen again, the dollar-yen is trying to e out some gains here. But again, this pretty much exactly where we were last week, is it not? Maybe a couple of pips, a couple of 100s, 20-30 100s of a cent higher, but no real big move. And we do have a sell signal forming here. The dollar-yen would be the ultimate barometer to gauge US dollar strength because again, a flight to safety, um, usually when gold strengthens and Bitcoin strengthens, so does the Japanese Yen and the Swiss franc. So this will be a very interesting, uh, couple of weeks with this pair because this is the carry trade. The only thing, in my respectful opinion only, keeping it up here is the interest rate differential between the Bank of Japan and the Federal Reserve. It’s the maximum amount of swap being paid to the trader and the trading firms on a daily basis with the Fed over 5% and the Bank of Japan in negative interest rates. So they’re taking borrowing that cheap money right, and they’re getting paid to do it. So keep an eye on this one. But Vantage Point, to be clear, is warning us that something is afoot here. And just like that early entry point with gold back on October 9th, this is the kind of warning sign we’re looking for. So if gold continues to advance, Bitcoin advances, the dollar Index slides, not even the carry trade may be able to save the dollar here. But there is, uh, a very slow-moving sell signal forming.
U.S. Dollar versus Canadian Dollar
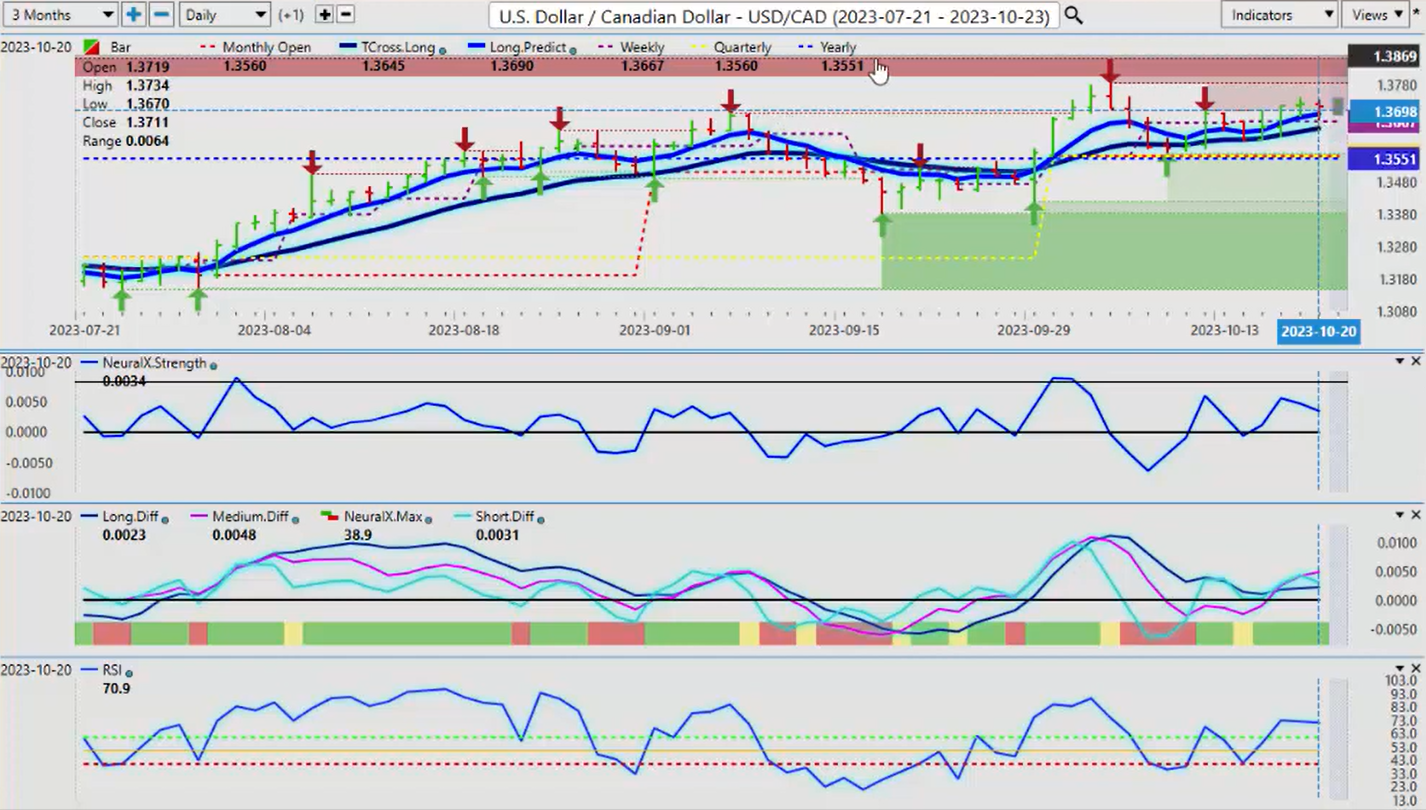
Now when we look at our three main equity-based pairs, obviously, they’re not going to finish the week well. But I would argue that US Canada didn’t fare too bad here. But, uh, it’s still an upside bias while we’re holding above that quarterly opening. Now the thing that’s interesting about this pair, guys, is the current quarterly opening and the current yearly opening are at the exact same level. So if you don’t want to get involved in uh buying today, selling tomorrow, flip-flopping back and forth, uh, ultimately, I think there’s a good chance that we break down lower on this pair into year-end. So one could just put sell orders below 13.35.51 because again, we’re not using a rolling performance; we could care less what it did 30 days ago, a random 365 days. Our this is our main line in the sand, guys. So I believe if nothing else, we’re going to retrace back to this particular level. But the Bank of Canada and the ECB next week, the Bank of Canada could really sink the Canadian dollar next week. So watch out for that volatility because again, Vantage Point’s indicators are still warning of further upside, but I feel we need some type of retracement first.
Australian Dollar versus U.S. Dollar
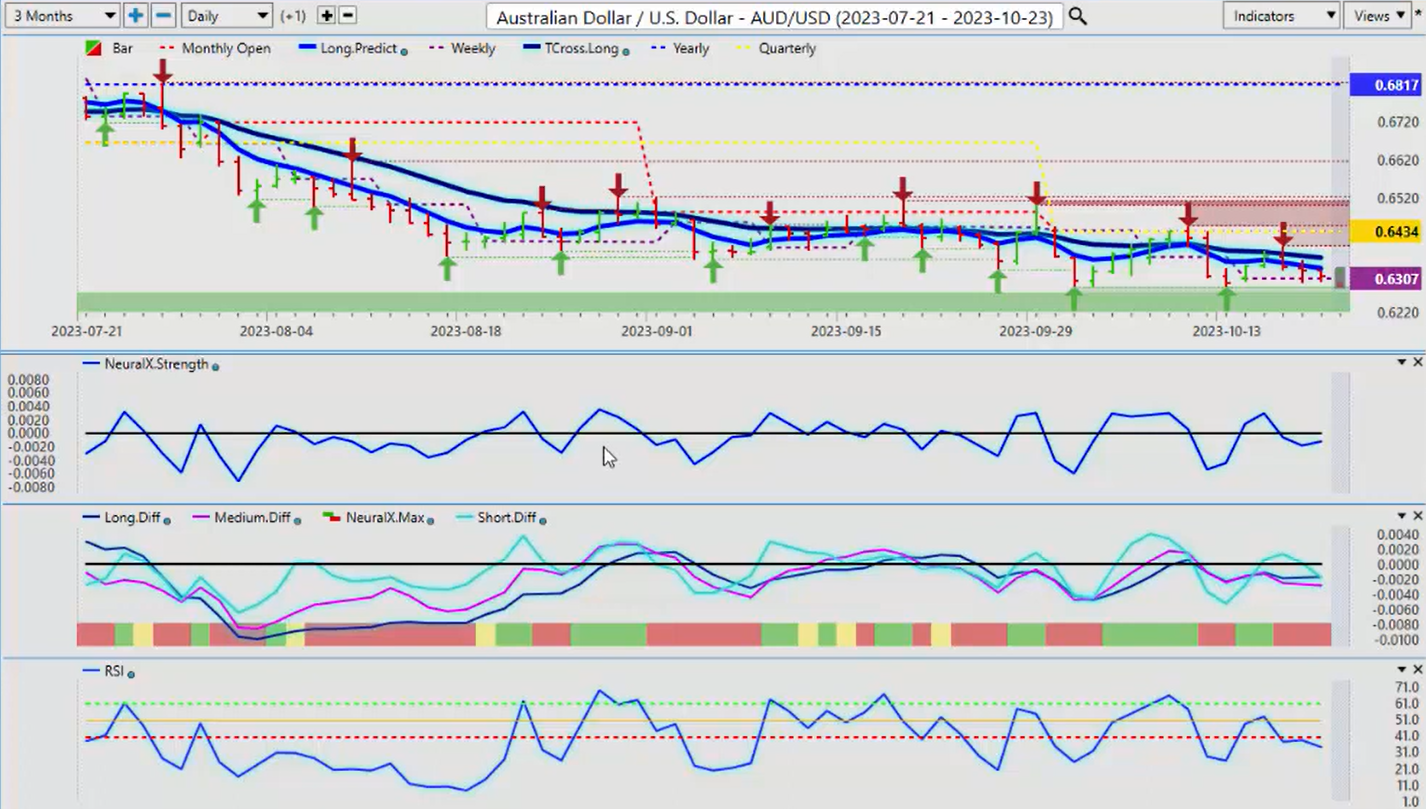
Now with the Aussie and the New Zealand, these are two of my least favorite pairs. I don’t trade them heavily; I find them a little erratic. But uh, there is a very; this pair is in a very strong downtrend, indisputably. Yearly opening price 68.17, quarterly now 64.34. But with pending dollar weakness into year-end, we’re simply waiting for Vantage Point to give the green light to buy this thing. Uh, because even though the Aussie and the Kiwi don’t make up any part of the dollar Index, they’re still affected by it. So right now, we’ve got some pretty heavy support down here down to 62.86, and it seems like a lifetime ago here, guys, but it really wasn’t that I was trading this above parody, well above parody. So the potential opportunity here is vast, but uh, again, we’re just waiting for this to start. So if I look at this right now in this past week, 63 uh, we started the week at 63.07, and we’re closing slightly above where we started the week. So the primary move was up, and then the last three days down, uh, some of that is profit-taking, right? But I would argue the TR cross long is what What’s blocking this trade. So the verified support zones, uh, we’ll keep an eye on those, but right now, we’re basically just moving sideways.
New Zealand Dollar versus U.S. Dollar
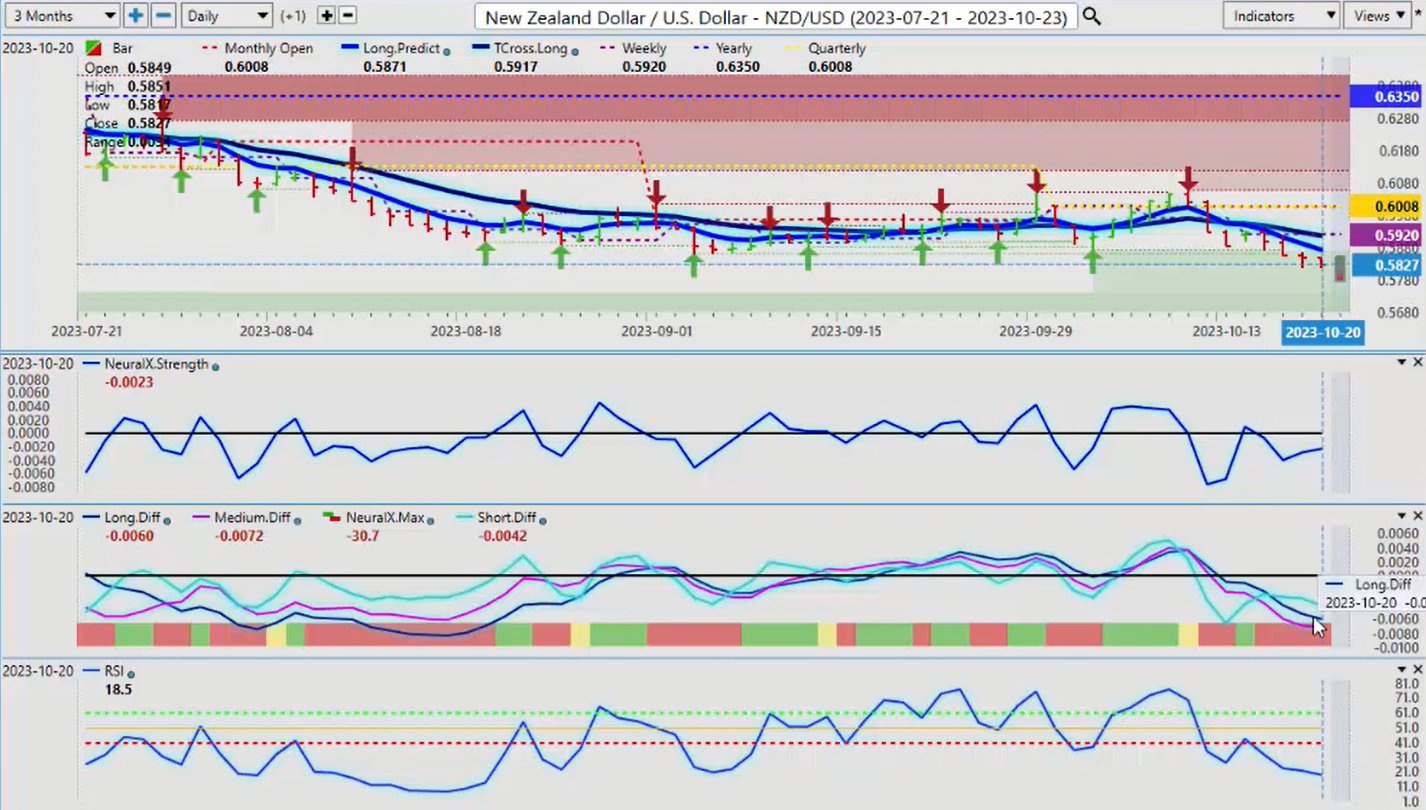
The Kiwi really taking a hit last week here; the simple answer is the CPI number coming in much softer than anticipated. So now they’re going to be looking at a very high-yielding, high-interest-rate currency getting ready to potentially cut. But I believe that the global central banks will be looking at cutting in 2024 with the damage that these rate hikes have done globally; it’s bordering on criminal in my respectful opinion. But right now, if the Aussie turns higher, then the Kiwi will follow, but we need the dollar to make us start its descent lower. Right now, the dollar Index remains stalled up near that current very important 105.85 area. The, it’s not getting above; again, that quarterly opening at 106.21. So we’re looking for a move in the dollar to trigger a number of additional trades. So keep a very close eye on that, but I suspect that things will begin to open up next week.
So with that said, this is the Vantage Point AI Market Outlook for the week of October the 23rd, 2023.
.