-
View Larger Image
Welcome to the Artificial Intelligence Outlook for Forex trading.
VIDEO TRANSCRIPT
Hello everyone, welcome back. My name is Greg Firman, and this is the VantagePoint AI Market Outlook for the week of November the 27th, 2023. Now, to get started, this week we’ll begin where we usually do with the US dollar Index.
U.S. Dollar Index
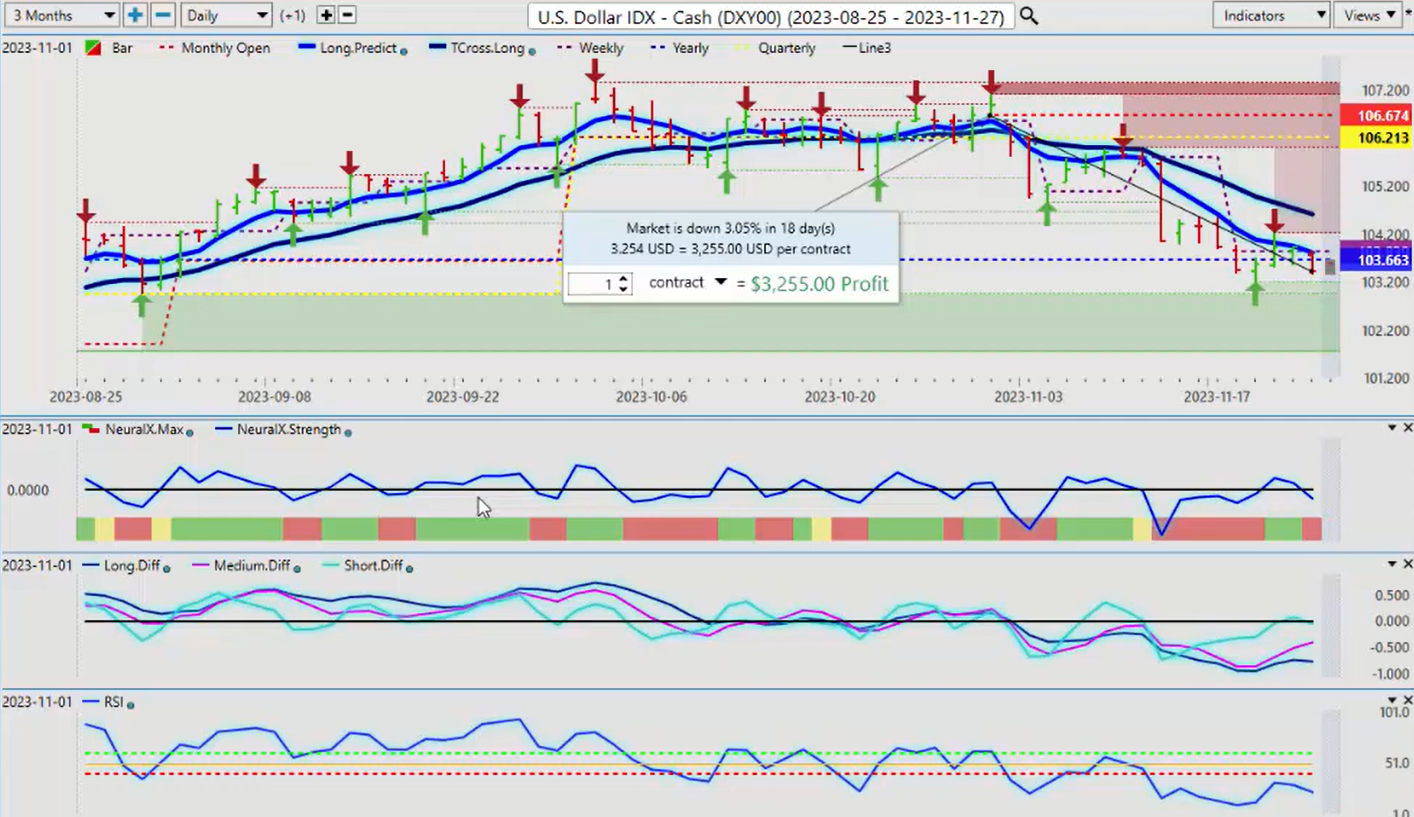
Now, as we can see in the month of November, the dollar is really taking a hit, down 3% on the month. Now, where we’re sitting right here is a very, uh, potentially dangerous area for a reversal at the beginning of December. Now, the current year, the opening price, depending on which broker you’re using, uh, is between 10366 and 10340. The dollar is continuing to recover off this area. We have a new verified support low at 103117 that will act as our support for next week. In most cases, the dollar does see some strength around the beginning in that first week of the month. But in December, it’s usually a very, very small rally, as predominantly the month of December does not favor the US dollar. The indicators from Vantage Point are still pointing down, but our predicted differences are starting to rise, showing there is still some life left in the dollar here. So again, we’ll watch this level very, very closely, uh, around 103117. If we remain above that, we are likely to see some dollar strength.
SPDR SPY ETF ($SPY)
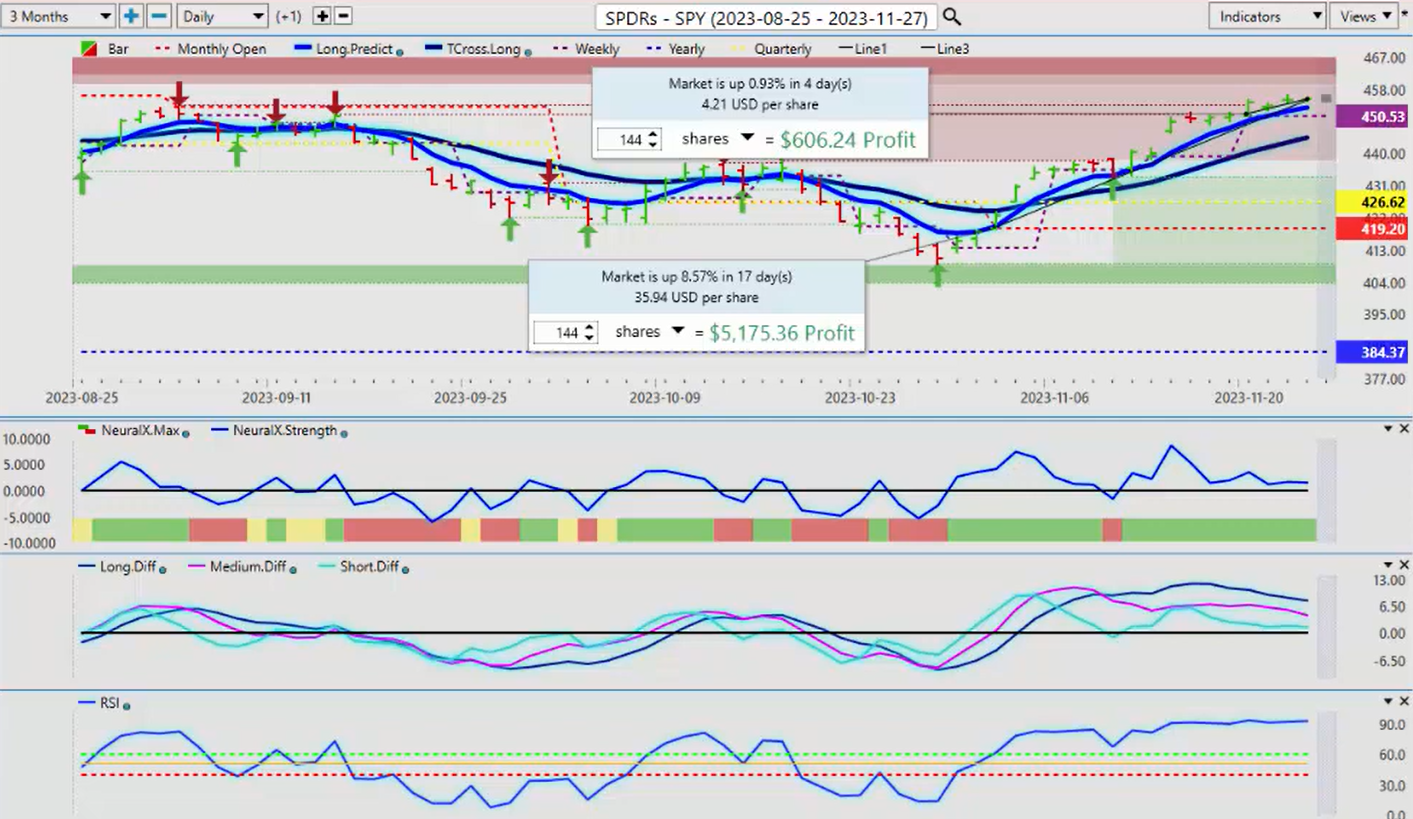
Now, when we look at the broader Equity markets, we can use two things: the spies or the S&P 500, basically the same thing, but we want to make sure we’re looking at accurate numbers, not a rolling performance model, because, again, I’ll continue to promote the monthly opening, the weekly, the quarterly, the yearly, because that’s the best way to see where we’re at. So for this past week, the spies are only up a smaller amount, 0.93%, but it’s having a very, very good month at 8.57%. When we look at the S&P 500, we can see the exact same thing. Now, again, when we look at some of the broader stock markets, uh, when we look, we can—there’s numerous stocks that I can use as an example here. But if we look at Ford Motor Company, we look at, uh, DXG, there’s too many to even list. If the broader markets are healthy, then those stocks will be going up also. But what we have to understand is that in most cases, again, right around the end of the month, the beginning of the first week of the new month, equities usually don’t do as well on that dollar strength. So for now, we’re getting a little bit toppy up here. But once again, when we look at, uh, you know, trading overbought, oversold type of signals, we can see that we’ve been in an overbought condition on the S&P 500 or the spies for weeks, and the market ignores it and continues to go higher. My concern is that the MA diff, the predicted diff Cross, or the strength of the medium and long-term crossovers is weakening to some degree. So there could be some corrective action here on the spy’s, the S&P 500, and if that happens, your broader individual stocks will also move lower because, again, the correlation to those main indices is about 95 to 98%. So we’ll watch this very closely. But again, the S&P and the Spy still holding strong, but I would be expecting some type of minor corrective move going into that first week of December. So we identify these levels ahead of time. 4534 is our long predictive, and we can see our T cross long, 4448. I could absolutely see a corrective move coming over the next week, week and a half to that particular level.
Gold
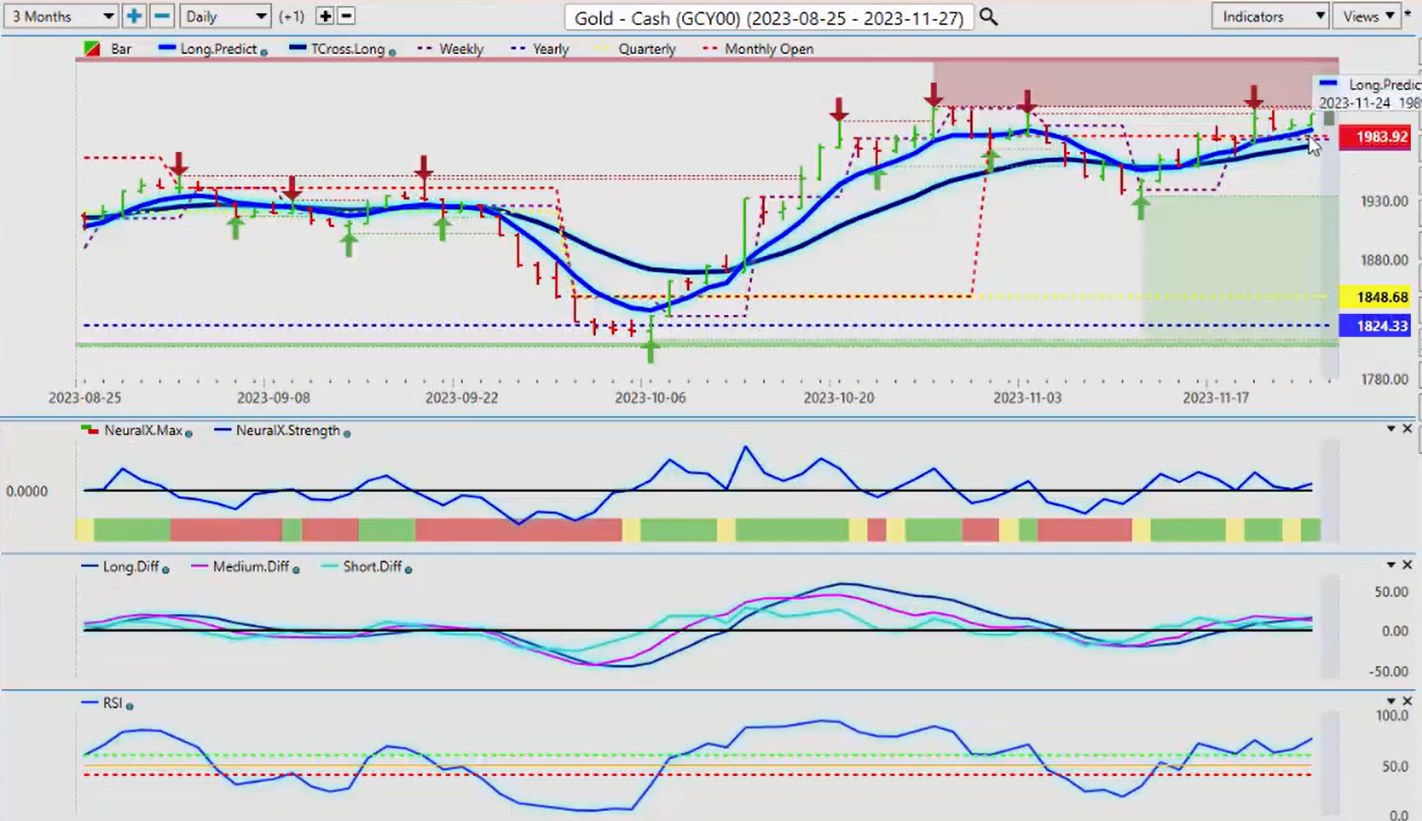
Now, when we look at gold contracts, again, gold contracts getting a little bit tangled up in these verified resistance zones. We’ve got multiple verified resistance zones coming in at 2006, we’ve got 2008, and we have this minor one sitting here at 2003. But there’s significant resistance up here. Now, in the month of uh, November and December, in my respectful opinion only, uh, these are good buying months for gold, very good buying months. The dollar usually doesn’t start doing well again until, believe it or not, closer to the mid-February. So usually the gold rally starts mid-November, early December, and continues on into about the first week of February, and then that seasonality of dollar strength kicks in. So again, it’s always about getting out in front of these moves, uh, you know because, again, this is an Outlook, not a recap of something that’s already happened. So when we look at the RMA diff cross, you can see that the pink Line crossing the blue line here is warning that gold could struggle here, but that would only be short term. Either way, we would be looking for, uh, buying gold on a dip. Again, firmly up on the year. Even if we look at the most recent corrective move to the yearly opening price, and this is a very interesting, uh, you know, uh, an assessment of this because as they were selling and telling you they’re in a bear Market using the current yearly opening price, not a rolling performance model here, guys. That’s a lagging model. We always want to know where we are in the calendar year, uh, where we are in the current month, the current week, and more specifically, the quarterly opening. So these levels are stacked very heavy down here, 1848, 1824. We’ve seen a sign, almost a 10% rise in gold, and it looks like we’ve still got room to extend. Now, if things start calming down between the Ukraine, uh, and Russia and the, uh, Middle East conflict, then that could let a bit of steam out of gold. But, in, again, in my respectful opinion only, regardless of all of these outside events, gold usually rallies at this time of year anyway. So we would look for a corrective move, uh, or another buying opportunity. We’ve got our monthly opening at, uh, 1983, but we’ve got our T cross long and our long predicted 1989, 1975. So that’s the area you would target for potential, uh, additional Longs.
Bitcoin
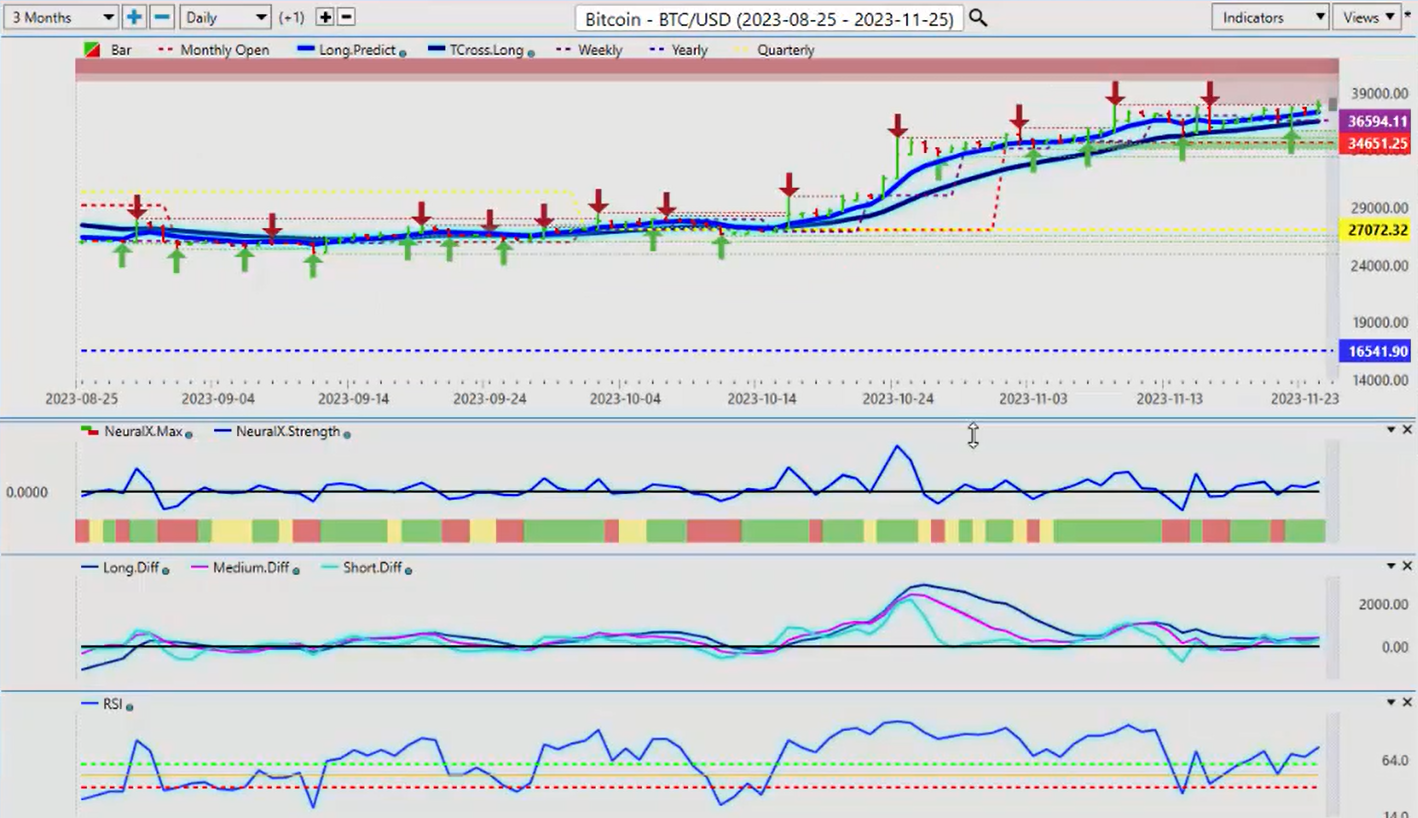
Now, Bitcoin, in the month of, uh, November, has not done overly well, and what we expected because the bulk of this rally came back in mid-October. But Bitcoin is holding up very well. Using leveraging the Vantage Point predicted moving averages as pivot Points provides potentially a weekly or daily entry point. You can see that Bitcoin has come down, hit our T cross long, 36254, and has rallied back up off of this. Because the bulk of this rally came back in mid-October. very stiff resistance in that 38,500 Mark, or I would argue anything around 38,000. So we’re closing out, uh, coming in at 37,855.
But again, when we look at this, uh, you can really see Bitcoin if we look at this on the monthly bar here, uh, where it’s trying to move higher but it is really, uh, struggled for the entire month. We’ve seen repeated selling around that 38,000 Mark. But again, as we go into December, uh, and potentially early January, that can benefit Bitcoin. So we’ll continue to monitor this. The, the indicators and Vantage Point remain bullish. And, and again, by having a proper Anchor Point in your trading, the monthly opening, the current monthly opening, not a random 30 days, guys, because again, it’s a lagging methodology, we can’t see, we need to gauge where we are in the month. Is to say, okay, if it’s above the monthly opening, then we’re buyers. If it’s below the monthly opening price, we’re sellers. But we also have to look at the, we have to look at both sides of a trade, both the support and the resistance, and of course, combine those very important intermarket correlations. And right now, it does still favor Longs on bitcoin. It just really hasn’t favored it heavily. But in the month of November, uh, because we just can’t seem to get through this 38,000 Mark. So even if we take and we go back one Year from, uh, in one of the strongest, uh, calendar years the US dollar has had in the last 15 years, we can see that that Bitcoin ran basically sideways last year and then really started to move up in January. So I think we’re still on track for something very, very similar, but we will assess that in the 1st of January once we get, we get our new yearly opening price because a lot can happen, uh, between now and then.
Crude Oil
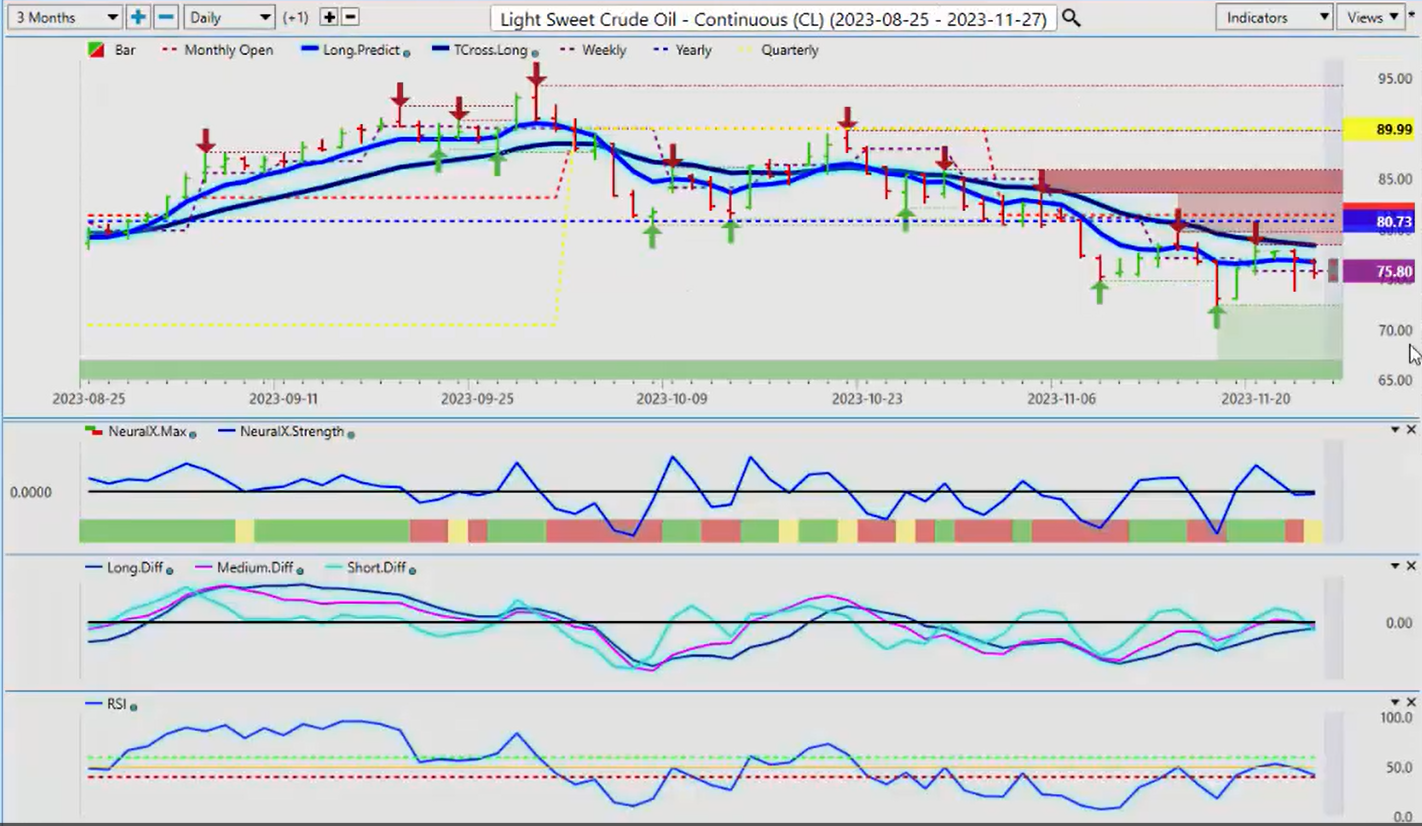
Now, when we’re looking at oil prices going into next week, again, not a lot of buyers in oil. You can see the resistance are quarterly opening $89.99, our monthly opening price that’s coming in at 81.44, and our yearly at 80.73. You can see that oil put up a good battle here, uh, the Bulls and the Bears really fighting it out on the current yearly opening price. Again, if you’re using a random 365 days, you wouldn’t have these anchor points. You wouldn’t even see this resist, this support, excuse me, here, but soon as that support broke, it immediately triggered a massive sell-off in oil. So again, we’re holding below all of these levels. I think it will be difficult for oil to retake, uh, the current monthly opening price or potentially even the yearly opening price at 80.73 because it would have to cross the Vantage Point T cross long which comes in at 78.31. So that’s where all the action is, guys. If you don’t want to get caught up or you don’t feel that shorts are still a good play, then you can put your buy limit orders above the current yearly opening price above 80.73. And if the market does break higher, then you’ll be waiting there. That’s how we straddle or if you’re a seller, you can sell into 80.73. But you’ve got options here if you can identify the proper support and resistance levels using these types of anchor points.
Euro versus U.S. Dollar
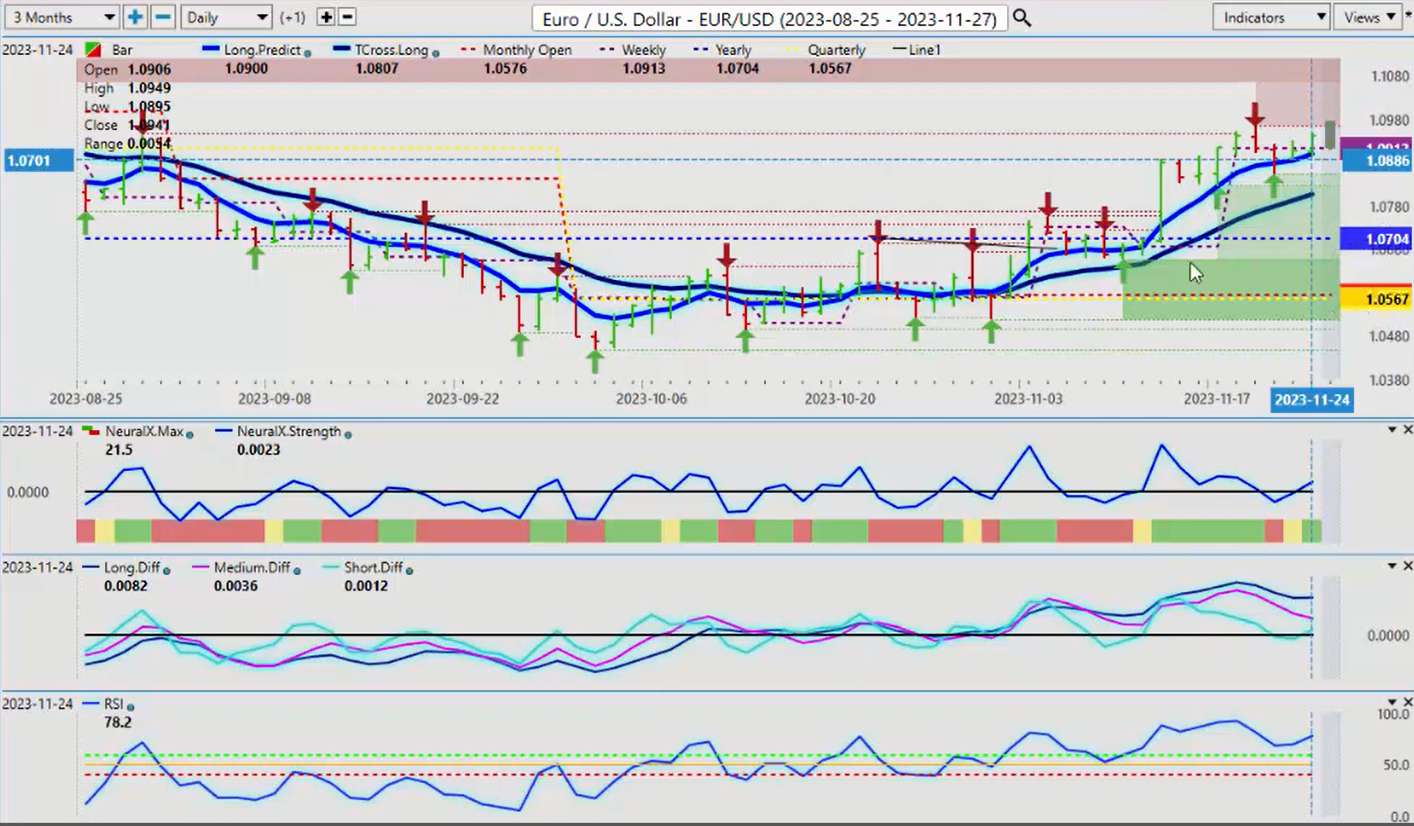
Now, when we look at some of our main Forex pairs going into next week, the Euro basically running sideways for the better part of the week. You can see we formed a new verified Zone that’s coming in at 109.65. Now, I believe that that level will be taken out in the month of December. The question is how low will it go before that happens? Now, again, we’ve got a significant gap to fill here. Our T cross long is coming in at 108.07. So we’re long while above 108.07. That’s the easy way to look at this, guys. Right? But if we break down below our Vantage Point Long predicted at 109, we should see a relatively quick move down to our T cross long. But below that, we’ve got our yearly opening price at 107.04 and our quarterly at 105.65. So the Euro clearly finish going likely to finish the year bullish, uh, but again, we need to identify these levels every week so we know where we are in the current Trend. The current trend on the euro is clearly up. But again, we’ve got to fill this Gap a bit before we start jumping into additional Longs unless we can clear 109.65 and stay above 109.65. So again, we have very specific levels where we’re willing to buy and sell from. We don’t want random areas, random rolling performance, trying to guess at what the actual performance is. Uh, the Euro’s had a very, very good month of November, and December is likely to be very similar once we get past that first week.
US Dollar versus Swiss Franc
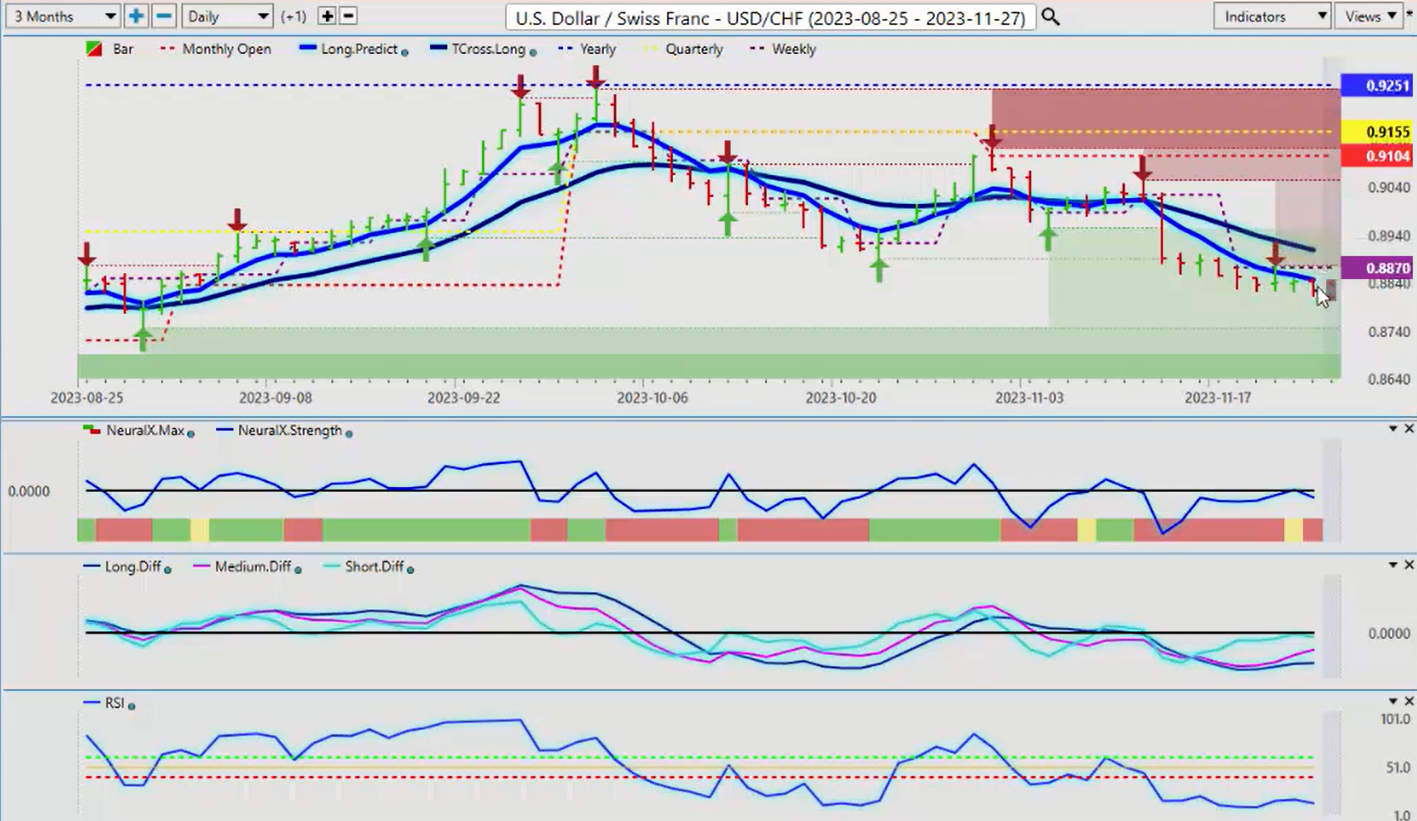
Now, the US Swiss franc could see some buying this week if we see that the dollar cycle where we’ve got dollar buying at the beginning of the month. Then it would push this higher. But make no mistake here, guys. This isn’t a very strong downtrend and has been for many, many years. When we look at this going back, uh, I can go back 5 years, but you can really see that, uh, way back here in 2019, we came up to just above the parity Mark, made a significant move lower down. We’ve corrected, but we’ve made a lower high over that longer period of time, and we’re now making lower lows. So we’re not making higher Highs, but we are making lower lows. So when we look at it from that perspective and we come back to the three-month period, then you can see that using the Vantage Point Long, uh, long predicted or the long-term crossover with just the predicted moving average, this has been an excellent daily selling opportunity. If we can combine that with the Vantage Point predicted high and predicted low, then the trade is even stronger. But we want to make sure we’re combining this predicted moving average with the predicted high and predicted low of that day, or we get, could get caught in a short squeeze, a bull trap. That’s how that often happens because the trader is not looking at all these things. He’s just looking at maybe the Blue Line crossing the black line or maybe just the neural index. We want to always make sure we’re combining quality indicators so we know or we have a better idea what the market Trend really is.
So TR cross long, I believe we have a bit of a gap to fill here too. That T cross long coming in at the 89.09 Mark. If we can get up that high, I think we have Longs would be reasonable up to that area. And then we can reset our shorts once we get up, if we get back up to that particular level.
British Pound versus U.S Dollar
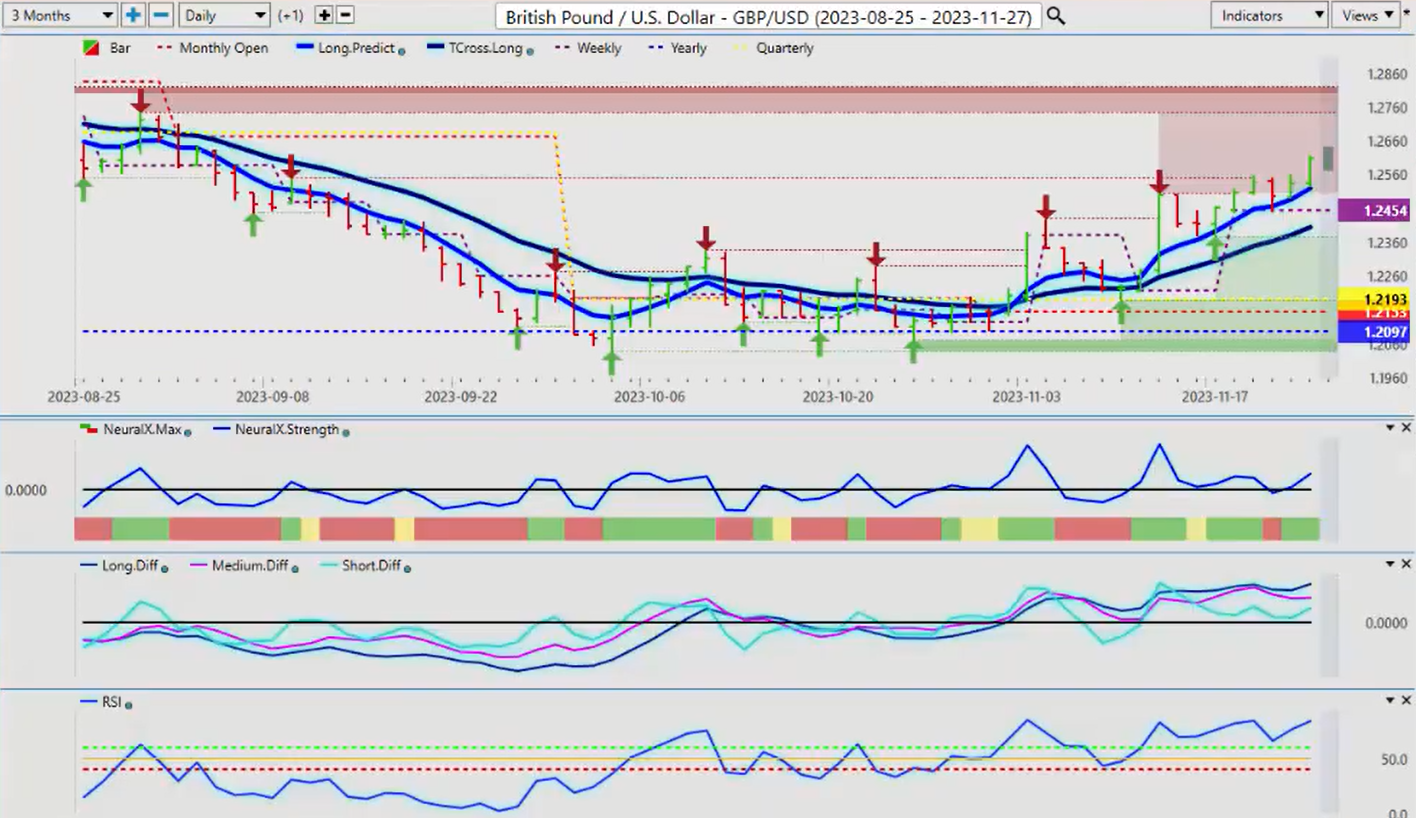
Now, the British pound US dollar, one of the star performers again. Uh, if you can, you can see, uh, again because we’ve talked about this each week in these weekly outlooks using the current yearly opening price as a pivot level to buy and sell from using the monthly level predict the current monthly opening. Because again, if I just took a random 365 days, this support would not have been seen. And you can see the market has used that current yearly opening price as a leverage point to get long on this. That is in turn, and again, I the one thing I can say with my outlooks, I 90% of the time do not show something that’s already happened because that would then not be an Outlook.
This was a move in progress that was discussed in this weekly Outlook in November. So again, you can see 4% on this particular currency pair. So if you’re doing a leveraged position of 2 to 3 to one, uh, that’s a very significant move in one month. 4% is very, very good. So again, when you’re in the Forex Market, you’re either buying or selling US dollars. So once we get past that monthly dollar cycle, but we know the seasonal pattern supports gold, it doesn’t support the US dollar.
I believe that the pound dollar has room to extend, but we do always want to make sure we look at downside entry points. So for example, for Monday, the predicted low is 125.74, but our long predicted is 125.19, and our T cross long is 124.04. So what you want in your trading is getting that predicted low of the day or a predicted high. You want it close to one of these predicted moving averages so that you know that that gap is being filled.
So right now, in my respectful opinion only, if I’m closing Friday at 126.09 and the TR cross long is at 124.04, I would like to see a significant portion of this gap to be in price to be filled, which I believe I can get by the end of next week. So watch for it. I’m not going to say that shorting against this trend is a great idea. I’m saying that this gap, it, this pair will likely move forward to fill this gap, and then we go higher.
US Dollar versus Japanese Yen
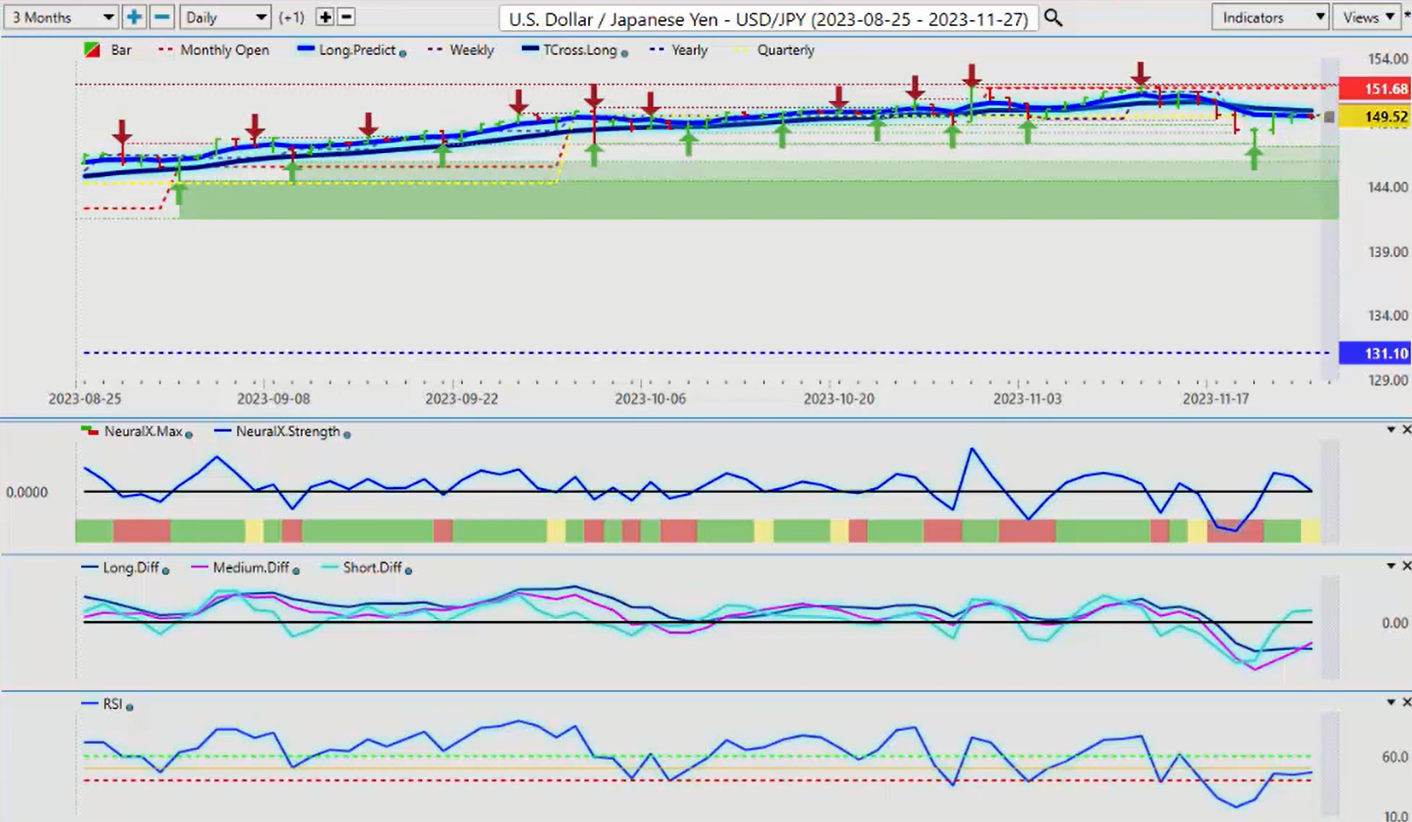
Now, when we look at the dollar-yen going into next week, once again, as I had talked about over the last few weeks, in most cases, the dollar, regardless of everything that’s happened, if we look at what happened last year with the with the Fed with these ridiculous rate hikes over and over and over again, it’s still the dollar could not really make any new highs since last October and still hasn’t for that matter. So when we look at the dollar-yen, this is the carry trade, so it’s not the best place to short because the Fed being the highest interest rate and the Bank of Japan being the lowest, so the swap payments are a little heavy on this pair.
But we have had good selling this past week, but it’s starting to recover a little bit of dollar strength, but I believe that to be short term because as the Fed starts potentially moving towards rate cuts in 2024, the carry trade would likely come unwound, meaning we could see extreme volatility in this in all the Japan pairs, Euro-Japan, Aussie-Japan, Great Britain-Japan could be a nasty one. But dollar, they all stem from dollar-yen, guys. All those Japan cross pairs all come from this pair. So if this pair drops, it’s very likely those other cross pairs will drop too.
For now, we remain negative on the month, 151.68. Uh, shorts carry a slight edge. However, we have a corrective buy signal here, the medium-term crossing the long-term predicted difference to the upside warning that at the current time, this is a corrective move higher. So we match that corrective signal here to the monthly opening price at 151.68 and we match it to our T cross long at $49.92. So in my respectful opinion only, if you were to short this, this is where you would do it between 151.68 and 149.92 because again, this is an Outlook, not a recap of something that’s already taken place. Or for this presentation, it’s being done on Saturday morning while the markets are closed, so the idea is that you can prepare for the coming trading week. You can identify these critical pivot areas to get a premium entry point.
US Dollar versus Canadian Dollar
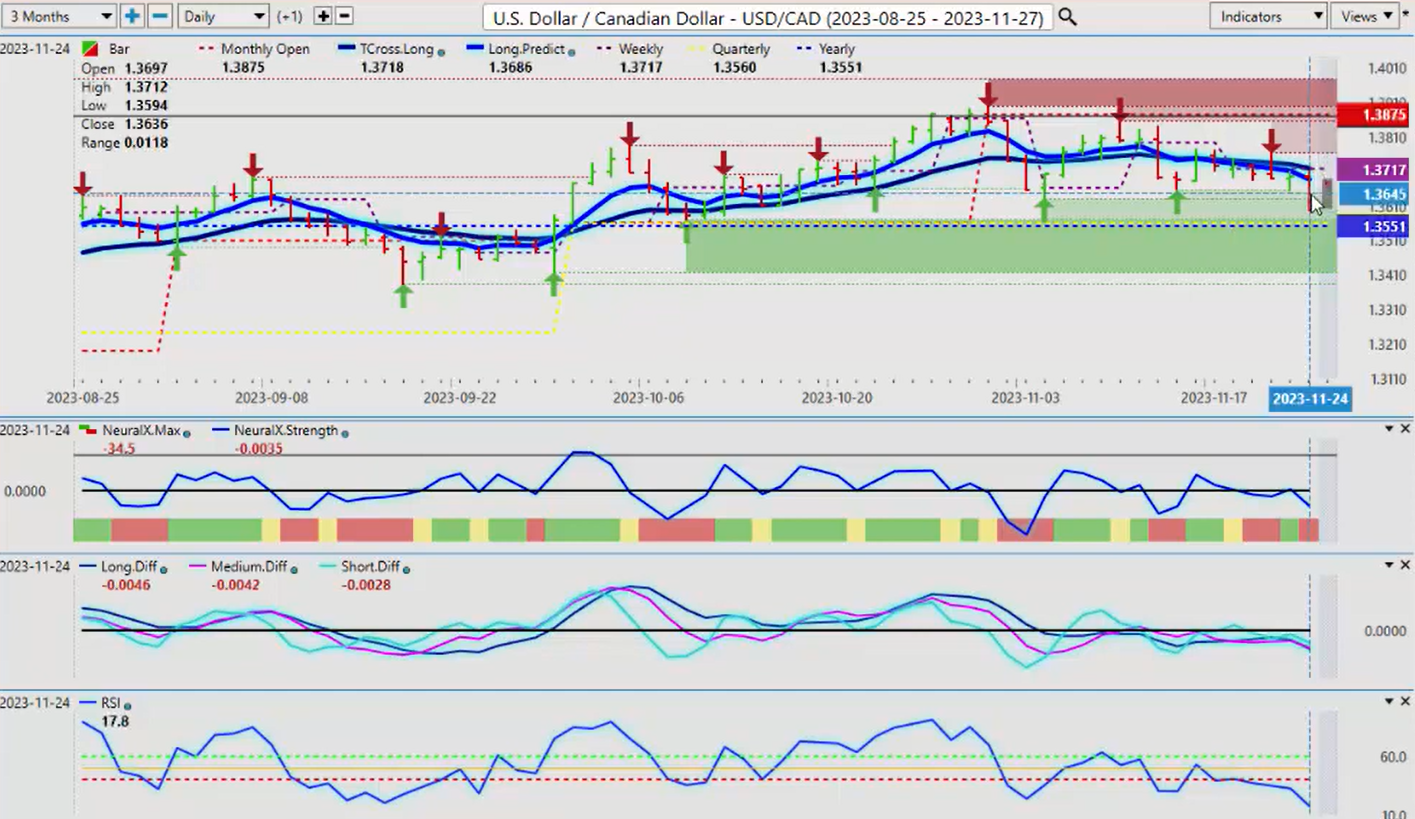
Now, when we look at the US Canadian pair, uh, finally, the Canadian dollar saw some kind of strength on uh, on Friday, but for the bulk of the week, it was really just running sideways. But it continued to hit into the T cross long, ultimately moving lower on that Canadian retail sales number. But again, in my opinion only, uh, that retail sales is not going to be enough to save the Canadian dollar. For the Canadian dollar to hold these gains, we must have Equity markets moving higher. We must have oil moving higher, and that’s highly questionable at this time.
But more specifically, I believe that the Bank of Canada will be one of the first banks to start cutting rates, and it will not favor the Canadian dollar at all. But either way, when the US, the US dollar doesn’t do well in most cases, neither does the Canadian dollar. What we’ve seen this past week, the CAD and the US dollar were two of the weakest currencies in the Forex market. And again, if the US is not doing well, the Canadian dollar, it usually doesn’t fare well either.
So you’ve got the US GDP numbers coming out next week that will also affect the CAD. So we’ll watch it closely, but again, very, very stiff resist, uh, support down here. The quarterly open is 1.3560, the yearly is 1.3551. Uh, two ways to play this, guys. I like to give a little to the Bulls and a little to the Bears. If you want to stay with the uptrend, which this pair has clearly been in this year, then you would look to buy from that particular area. If you’re a bear, then you would set up your, your sell orders below the current quarterly and yearly opening price, and that’s a reasonable trade also, based on nothing more than US dollar weakness. So again, we’ll watch this very closely, but it’s a very ominous signal.
Australian Dollar versus US Dollar
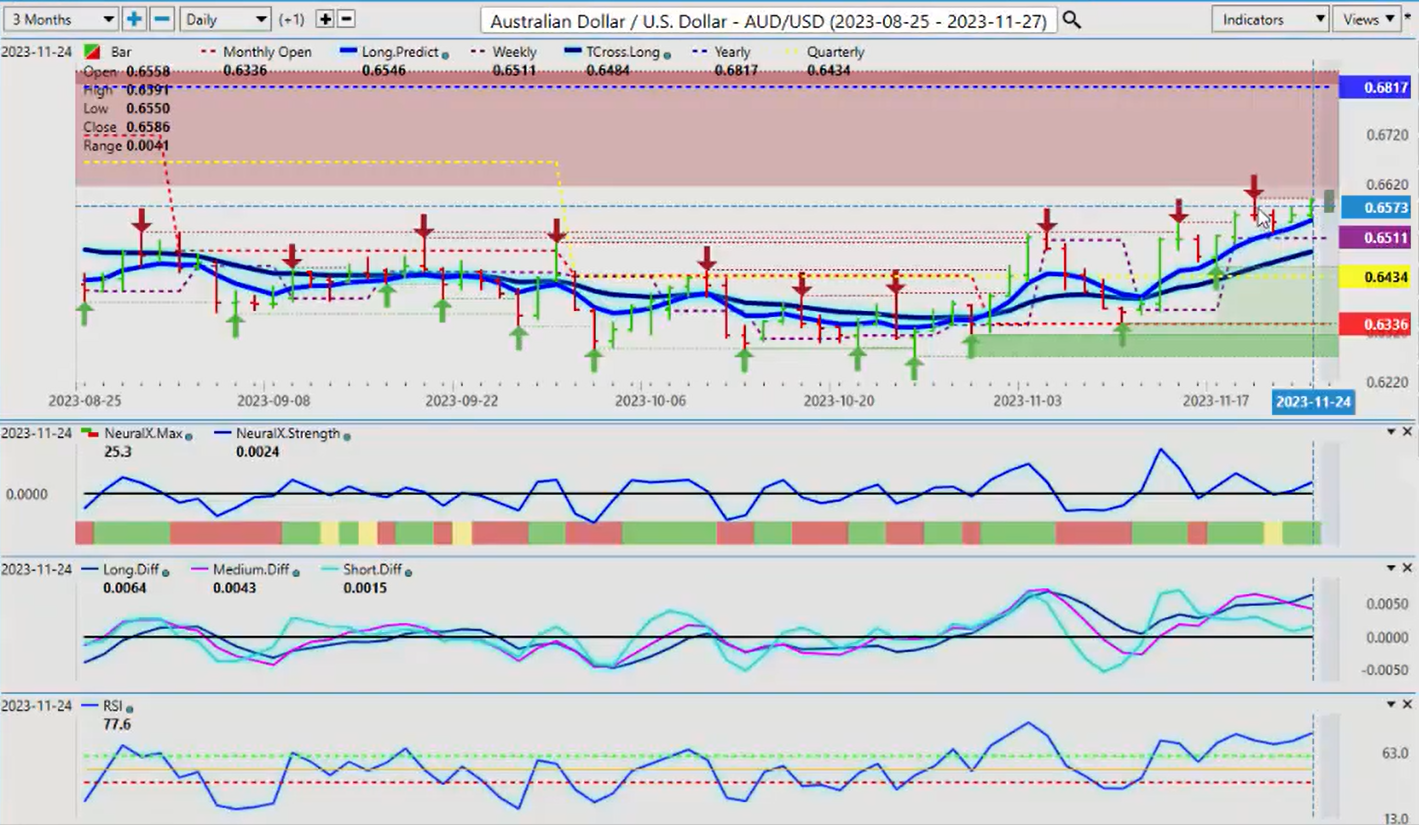
Now, when we look at the Aussie dollar and the Kiwi going into next week, we’re going to see something, uh, very similar. We need to clear this particular verified resistance high at 0.6590. If we break that area, then we’ve got a pretty clear run up to 0.6817. But again, we need the global stock indices moving higher also. We need a risk-on environment. For example, if we get a ceasefire in Gaza for the next, uh, 10 days, 20 days, or maybe we get it right into Christmas, that would, the Aussie would definitely benefit from that. So would the CAD. But the US dollar would not benefit from this. So again, we’ve got to break through this particular level. And another great example of using that long predictive as a daily entry point. We just want to match it to the, to the predicted high and predicted low. But if there’s a big gap there, then I would be cautious.
So in the, in the, the basis of advanced in Market technical analysis, if we connect the dots that verified resistance High to the MA diff cross, if the Aussie moves lower, that would indirectly warn us that the stocks are going to pull back before they go higher. So that’s the way I would look at this. That is a very ominous signal. Now, if I click on the F7, then yes, we have a medium-term crossover that took place here. But that MA diff, the pink line is saying that the medium-term crossover or the strength of the medium-term crossover is actually not getting stronger, it’s getting weaker. And it’s crossed over the long-term predicted difference, which is again, the worst thing I could say about this indicator is that it’s always early to the party, guys. So adhere to that warning that the stock market is not a given to go higher here. Uh, this pair is not a given either. But if the stock market, the S&P goes higher, that will help push the dollar down and bring the Aussie, the New Zealand, and the CAD, and indirectly the pound, the Euro, and the other pairs up. So again, we’ll watch this very closely, but it’s a very ominous warning sign.
New Zealand versus US Dollar
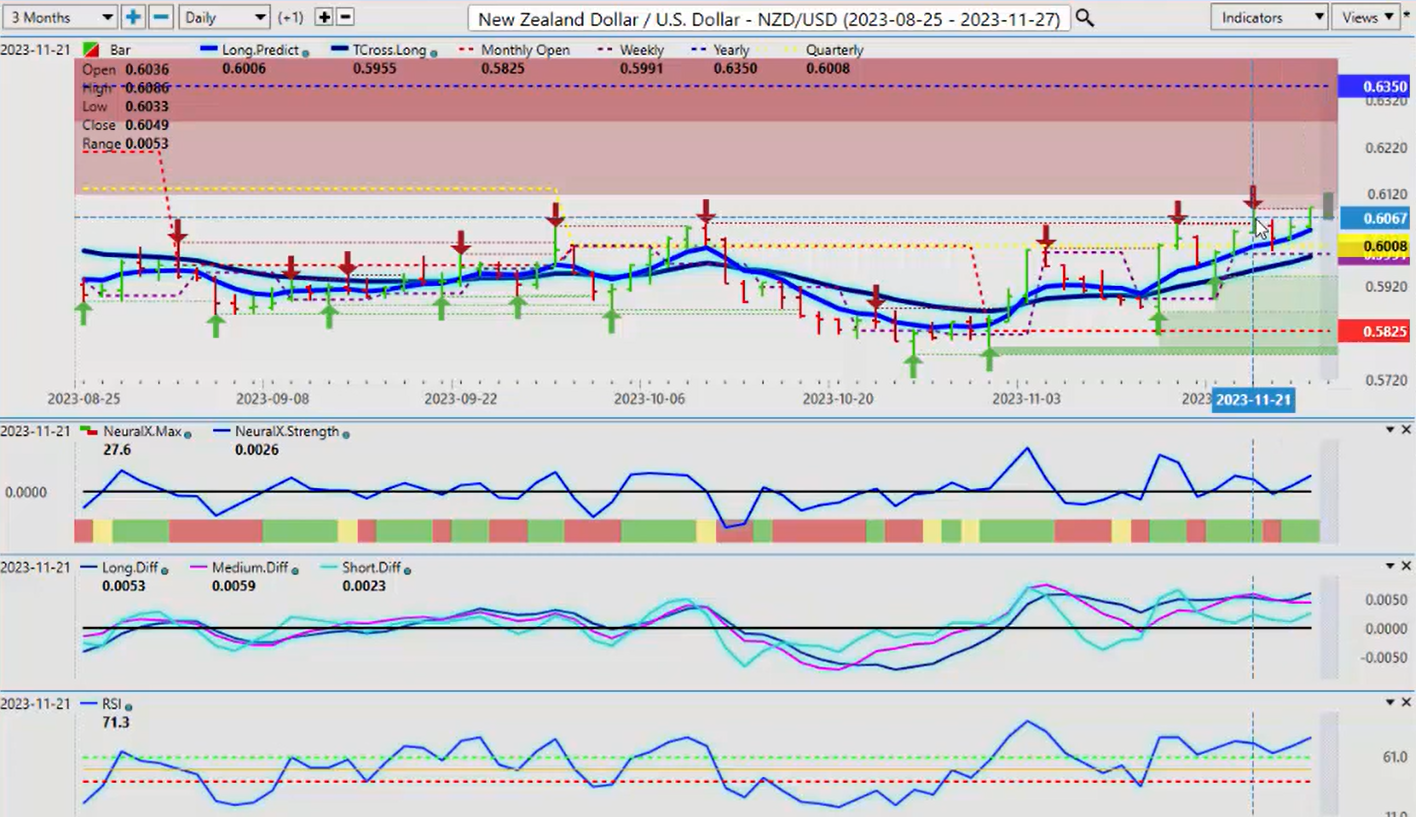
When we look at the New Zealand, uh, we see something very similar, a very similar setup, a verified resistance high. That one’s coming in at 0.6086. And again, we’ve got to break through that level if it has any chance of moving higher. But the predict, the medium-term predicted difference is again, uh, it’s, it’s, it’s saying that there’s some underlying weakness here. So we will have a busy week. We are moving into year-end, but there still will be some very, very good trading opportunity. So with that said, this is the Vantage Point AI Market Outlook for the week of November the 27th, 2023.