-
View Larger Image
Welcome to the Artificial Intelligence Outlook for Forex trading.
VIDEO TRANSCRIPT
Hello everyone, welcome back. My name is Greg Firman, and this is the Vantage Point AI Market Outlook for the week of January 15th, 2024.
Now, to get started this week, we’ll begin with a very important US dollar Index. It’s a very mixed bag of data this week. We have the CPI number that was slightly hotter, but the producers price index is the one that matters here, guys. It’s much softer on the inflation side. It’s current data; the CPI number is lagging data. The dollar rightfully has responded somewhat negatively here.
U.S. Dollar Index
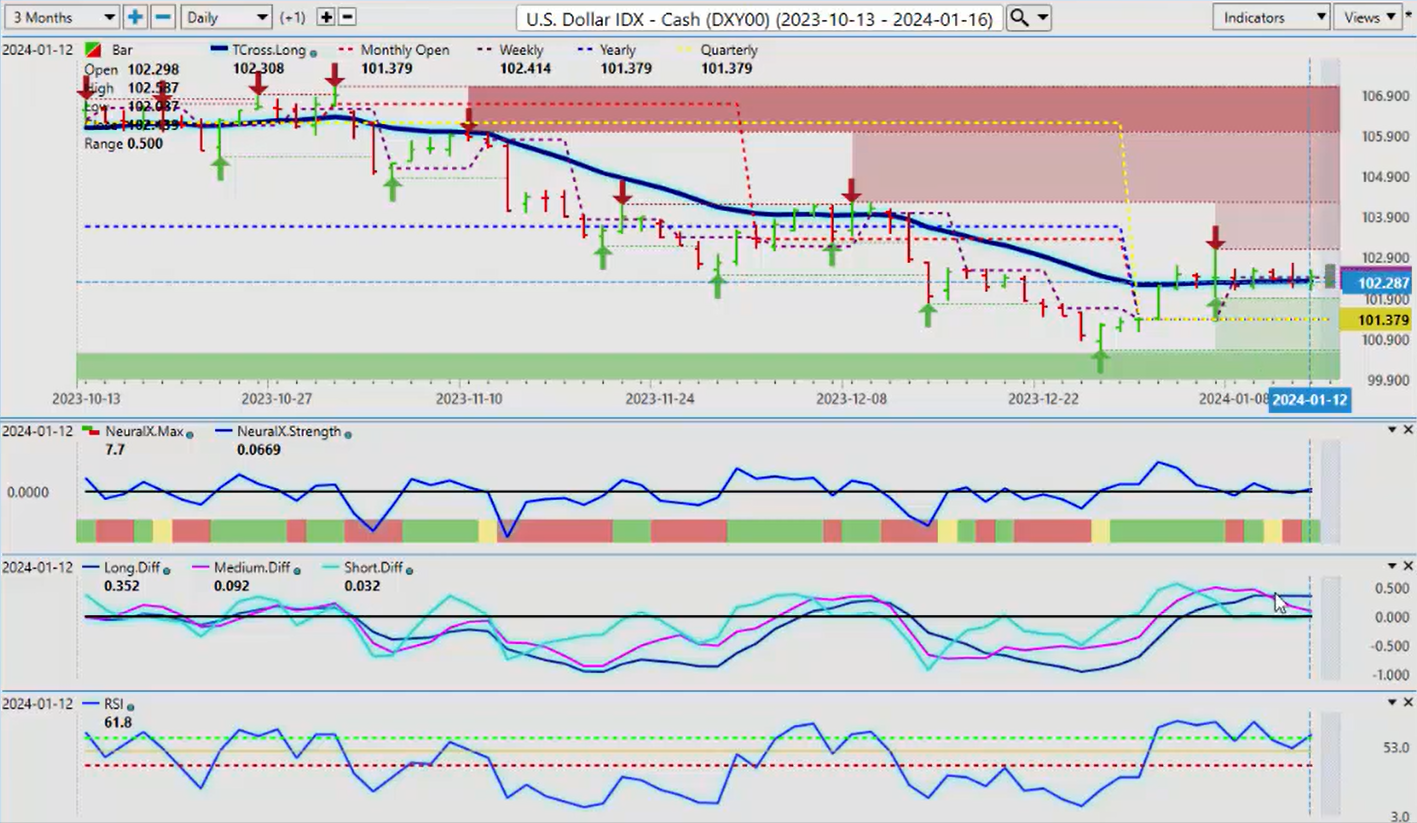
So let’s look at things going into next week and what Vantage Point is actually forecasting. We have an MA Diff cross that is crossing to the downside. We are struggling on our T cross long. We are further struggling right along this particular line on that Weekly opening price, 10241. I meant this level has contained the dollar for the better part of the week and likely to contain it next week also. A very mild bullish signal here for likely a one-day event where we’ll see the Monday-Tuesday reversal, as we’ve worked on in the Vantage Point live training room. There’s a very strong Monday-Tuesday reversal across these markets. So if we have an up day on Monday on the dollar, the likelihood is we’re going to have a down day on the remainder of the week before we get into that seasonal pattern in early February. So right now, the indicator is very mixed here across the board, but the MA diff cross, I believe, is our warning sign. We can draw a line on here in our software if we’re so inclined, but the dollar again has not made any new gains since that highly questionable payroll number last Friday. And again, in my respectful opinion only, the U6 number points to a weaker labor market, not a stronger one. So we would go with that for now, and the MA diff cross suggesting that it’s going to be a tougher week next week for the dollar.
S&P 500 Index
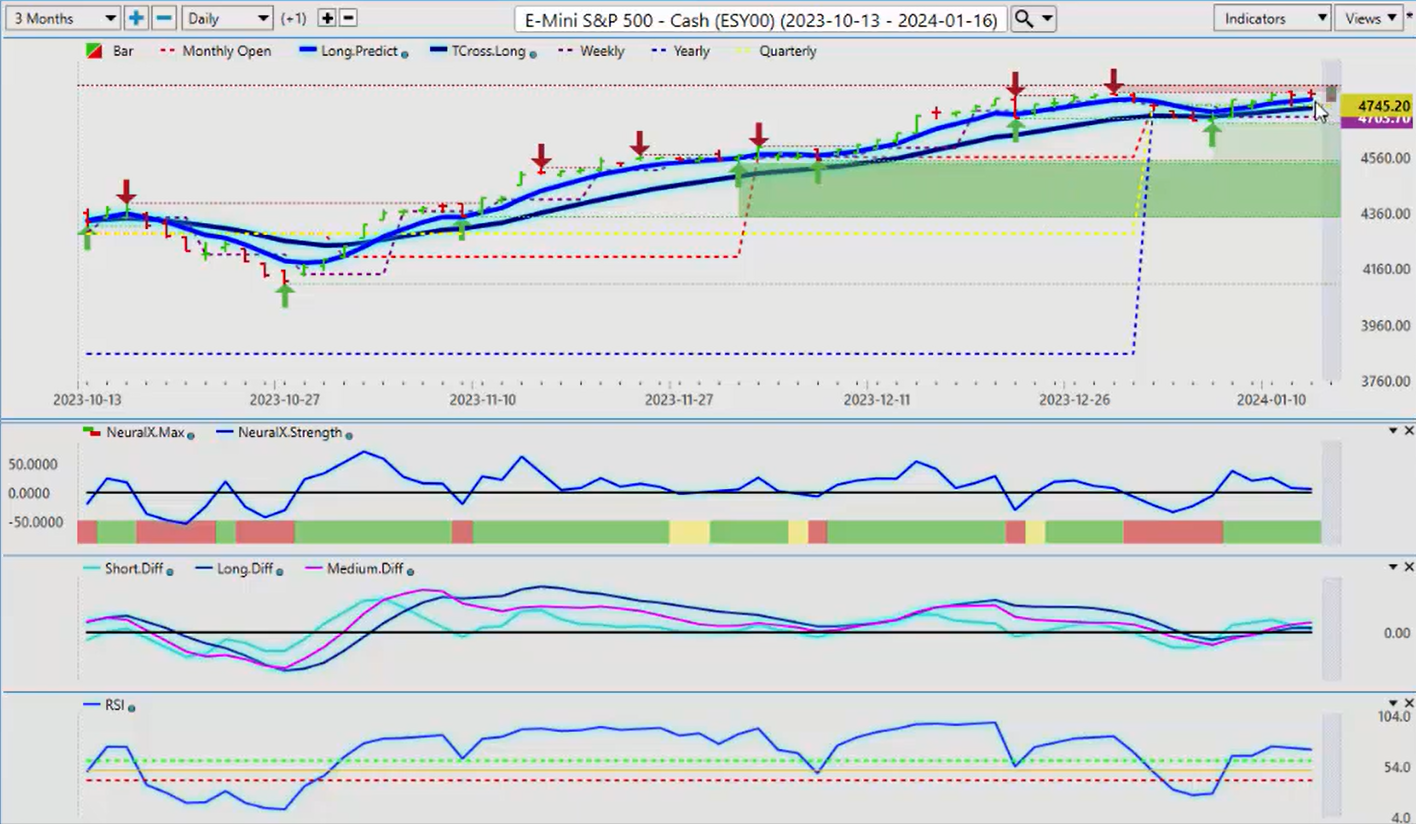
So on the positive side of that, we’re likely to see a stronger week in the equity markets. Right now, we’re holding above our T cross long at 4735. That’s the level we want to watch. Again, our predicted short, medium, and long-term differences are above the zero line, meaning we have a short, medium, and long-term crossover has occurred. We’ve got some momentum above the 60 level on the predicted RSI. The neural index is slightly sloping down, but you can see that it’s flattening out along the zero line. Again, this indicator is rapidly becoming one of my favorite indicators because I like to see the slope or what’s actually going on inside that very important neural index. So we’re still green, we’re flattening out here. That usually would suggest that it’s getting ready to potentially make another move. But we do have some pretty stiff resistance. I’m not always a big fan of buying this high at all-time highs, but when we look at the equity markets over the last 10 years and if the FED is going to go into rate cuts, all of that does support the indirectly supports the equity markets.
Crude Oil
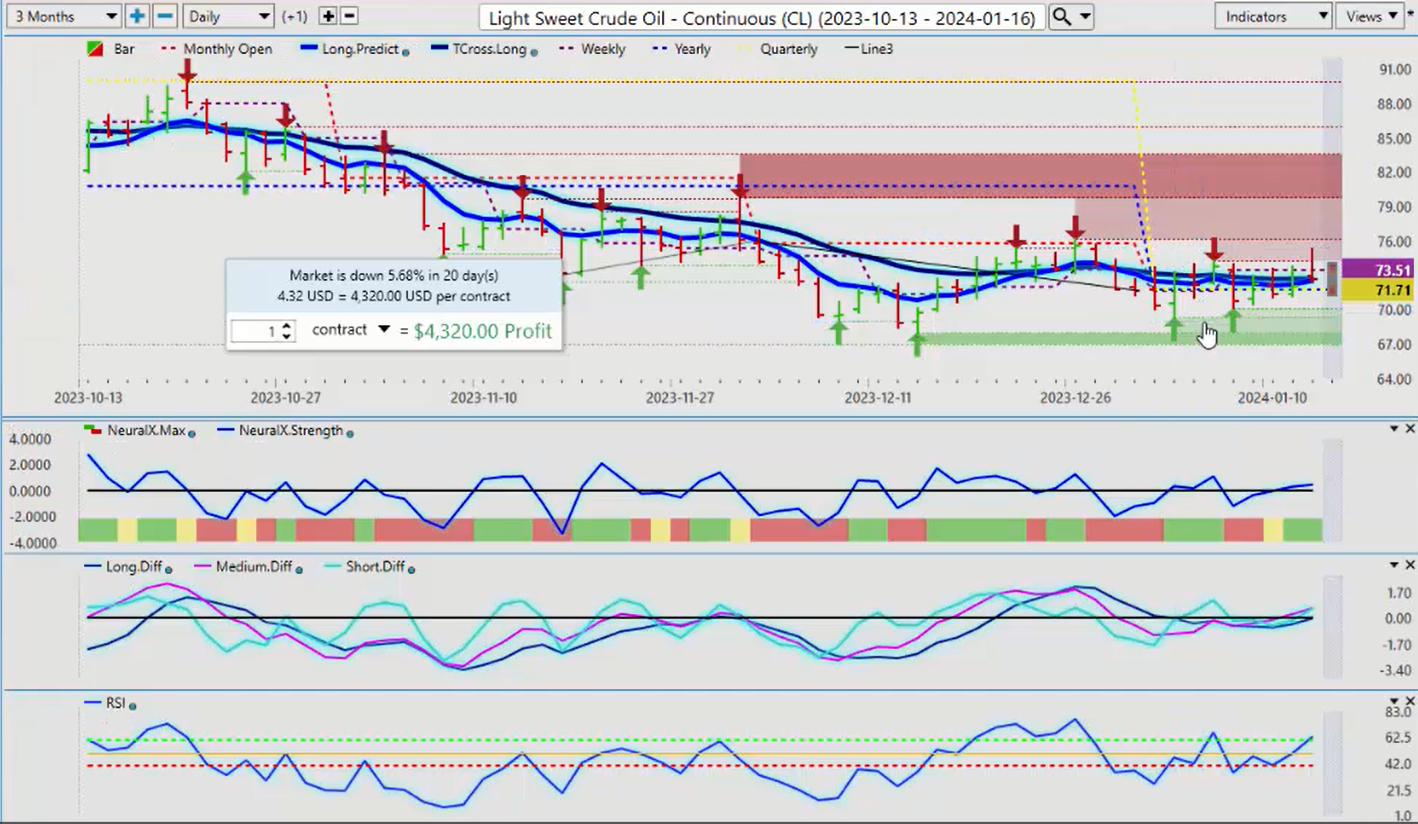
When we look at oil going into next week, oil recovering somewhat here, but again, we’ve got a very tight channel in place here. And again, I’ll just take that off so we can all see this. Now we’ve tried to push up above our current yearly opening price that’s coming in at 7171, which we’ve done. So we’re holding above that. The yearly opening price at this time in the first quarter of the new year is very, very important. The yearly, the quarterly opening, the yearly opening price will remain the same until we get into March. So for now, keep a very close eye on that. Our T cross long is at 7272. Everything points here that oil should see some kind of recovery, but it’s not the strongest season for oil. But our predicted differences are rising, our neural index is rising, and we’ve got a bit of momentum building on the predicted RSI at 62.8. Using a 60/40 split on our predicted RSI to gauge momentum, not overbought and oversold conditions, we’re looking to see if we’ve got momentum if the buyers can get a hold of this thing and push it up.
Gold
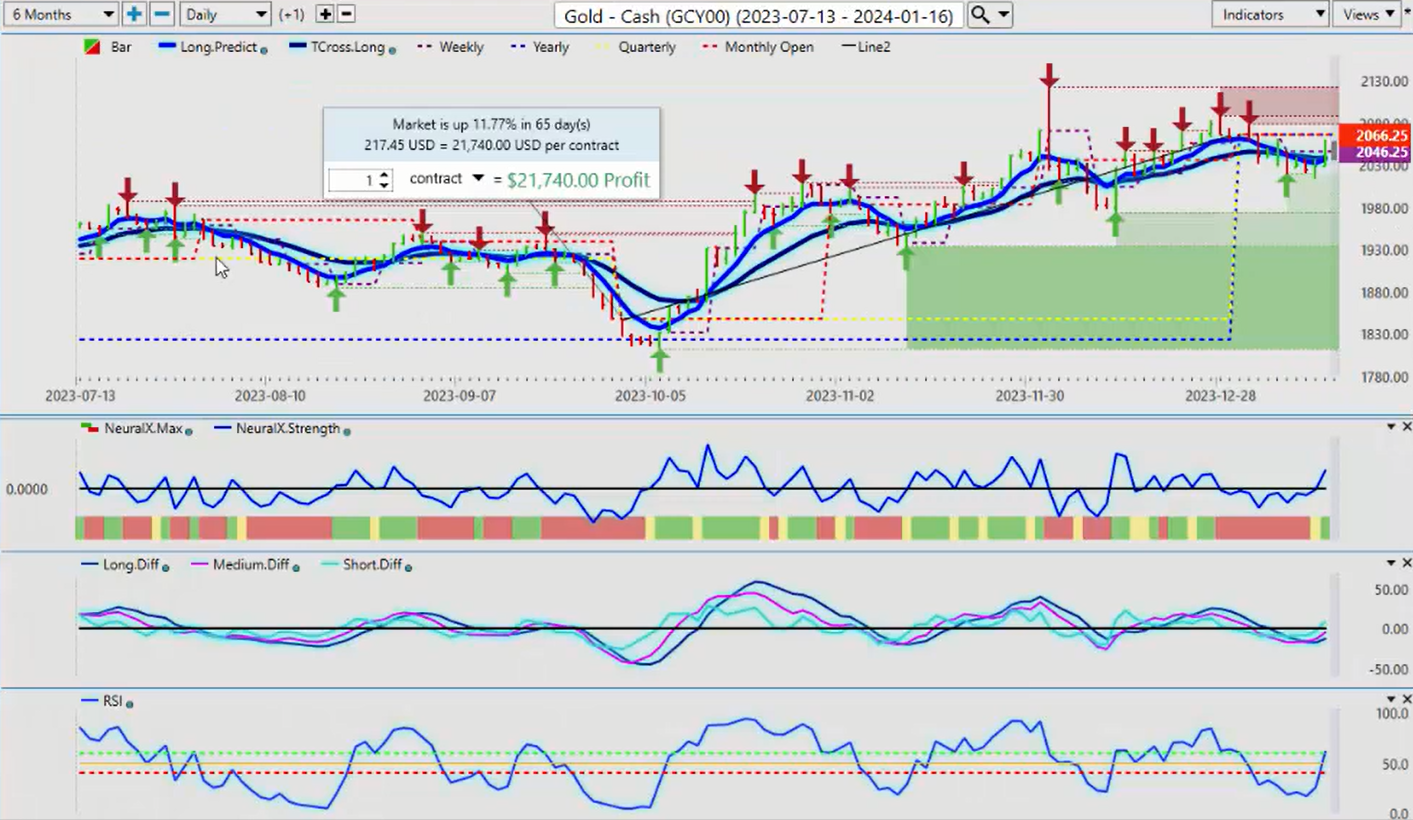
Now, when we look at gold for going into next week, on that dollar strength, we should see gold starting to move back up. Right now, we’ll just bring this in here to our 3-month time frames so we can see it closer. We have cleared over, again, that yearly opening price is 2066. We’re closing at 2049. I would like to see us get above that yearly opening price and stay above it. Right now, we’re turning back up. We’ve closed above our T cross long. 2039 is our key support level going into next week. If we click on our F8 in our software and look at our long predicted, our long-term crossover, again without the black line, we can see that it’s been using this level. The sellers have been using it for the better part of the week, but on Friday, we turned and closed above it. That’s a very early warning sign of potential bullish momentum coming into the market. And that is supported by our neural index, our neural index strength. We’ve got an MA diff cross to the upside, and our predicted RSI is sitting at 61.7. All of these indicators point to a decent week next week for gold. But always remember, we’ve got to get past that Monday-Tuesday reversal, and I would like to get back up above the monthly opening price here at 6066 and the yearly opening price at the same level.
Bitcoin
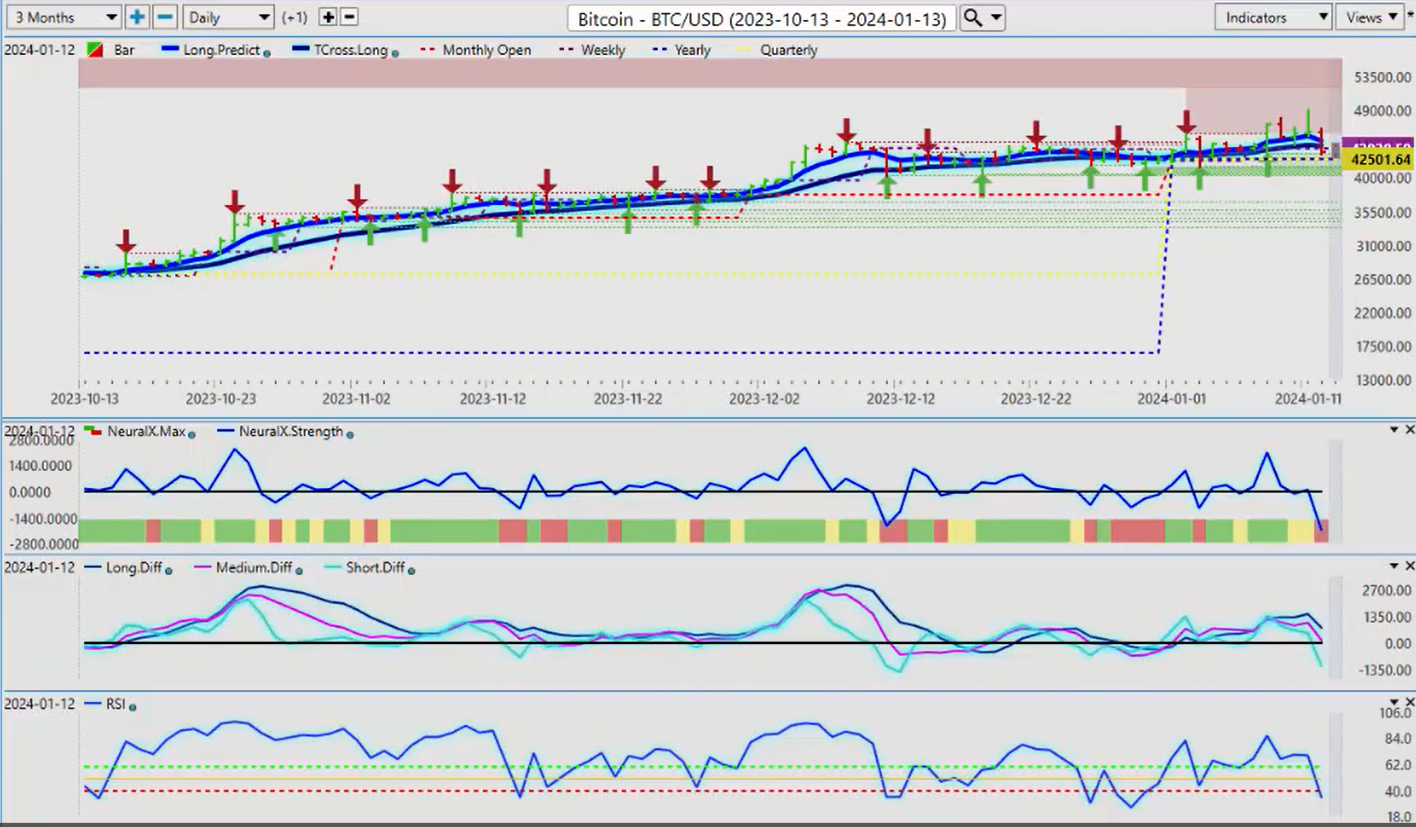
Now, Bitcoin, a lot of activity in Bitcoin this past week. The stunt they pulled, I guess the SEC got hacked, and they put out the false information that let some of the steam out of the announcement that the ETFs are being approved. But again, in my respectful opinion only, Bitcoin is likely to have a very, very strong year. Again, whenever we’ve had a down year in Bitcoin of 50% or more, the next three years have seen very, very strong rallies in Bitcoin. 2023 was the first calendar year after that down year, and we rallied 155%. So that’s not something we want to take lightly right now, a little bit of a corrective move.
But uh, again guys, the yearly or quarterly opening, whatever you want to call it, 42501, that is the level you want to keep your eye on over the next, during this entire quarter, because that will decide which way this trend in Bitcoin is going to go, just like it did in 2023. We held above the yearly opening price when they all said to sell it. Bitcoin was a scam, Bitcoin to 5,000. The exact opposite occurred. So again, the yearly opening price is objective, it’s not subjective, it’s a line in the sand that we monitor. It’s an anchor point, a very strong anchor point. I might at the rolling performance if we keep moving and shifting our performance model from random 5 days, random 30 days, random 365 days, all we’re doing is moving the goalpost here. We need to be anchored so we know where that key level.
Bitcoin is still bullish on the year, even with the bearish indicators pointing lower.
Euro versus U.S. Dollar
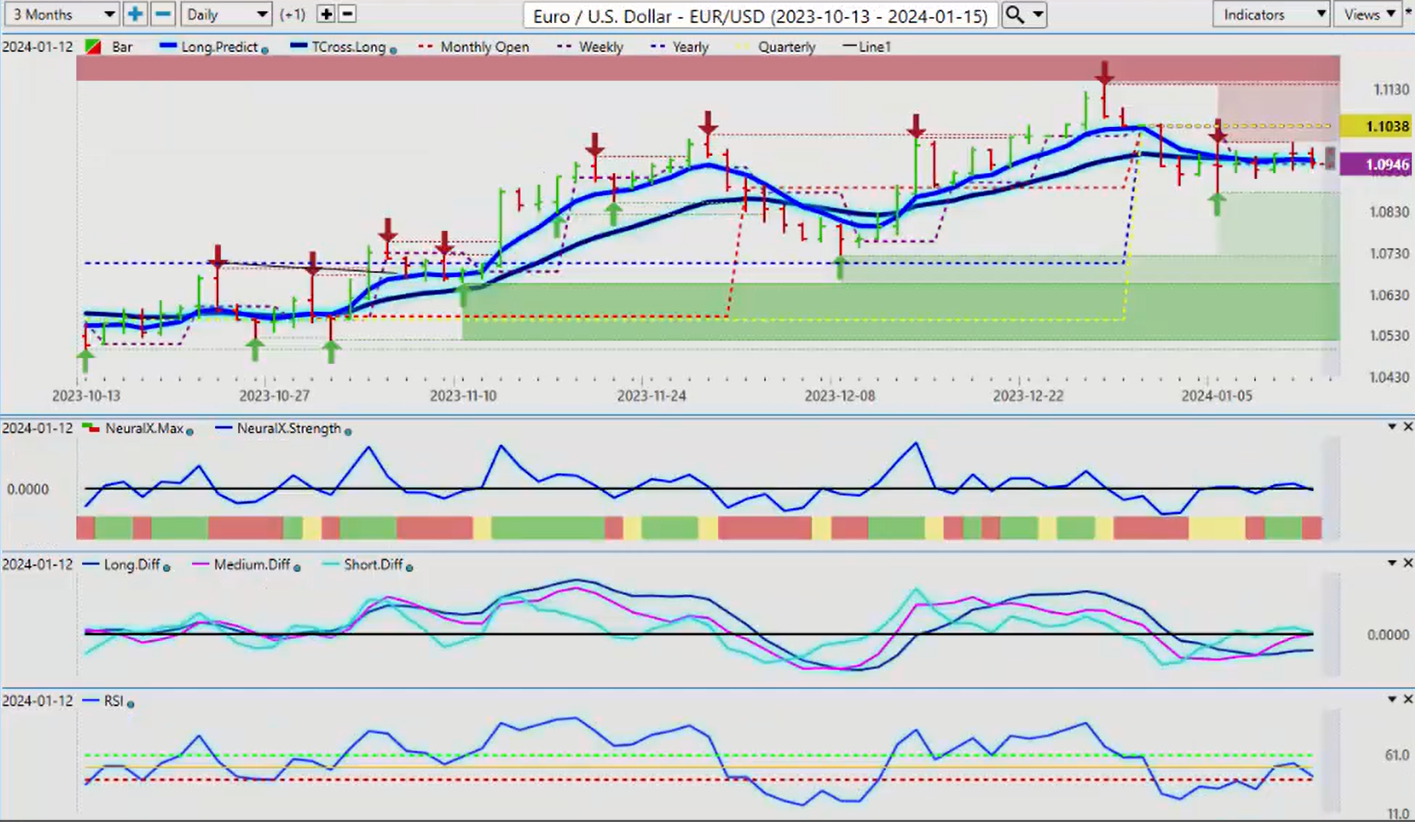
Now as we go into some of our main Forex pairs, the Euro obviously putting out a signal, a buy signal here, or that we’re going to move higher, based around the sell signal with the MA diff cross and the dollar index. So the Euro basically running this entire week, sitting around 1.0946. The weekly opening price also a very strong anchor point in your weekly trading, because again if we’re below the weekly opening, it’s bearish. Above it, the buyers are in control. So the buyers, the bulls, and the bears are fighting it out pretty heavy here. And as luck may have it, we have our long predicted and our T cross long coming in at 1.0957. Once we get above this and stay above this, we should move higher into the end of the month before we get into that dollar monthly dollar cycle and the yearly seasonal with dollar strength. But the FED could ruin that party and send the dollar considerably lower if we’re looking at a series of rate cuts and not just one or two. So, a slight bias to the upside on the Euro for next week. We’re not showing any significant downward momentum with the predicted RSI holding above that very important 40 level.
U.S. Dollar versus Swiss Franc
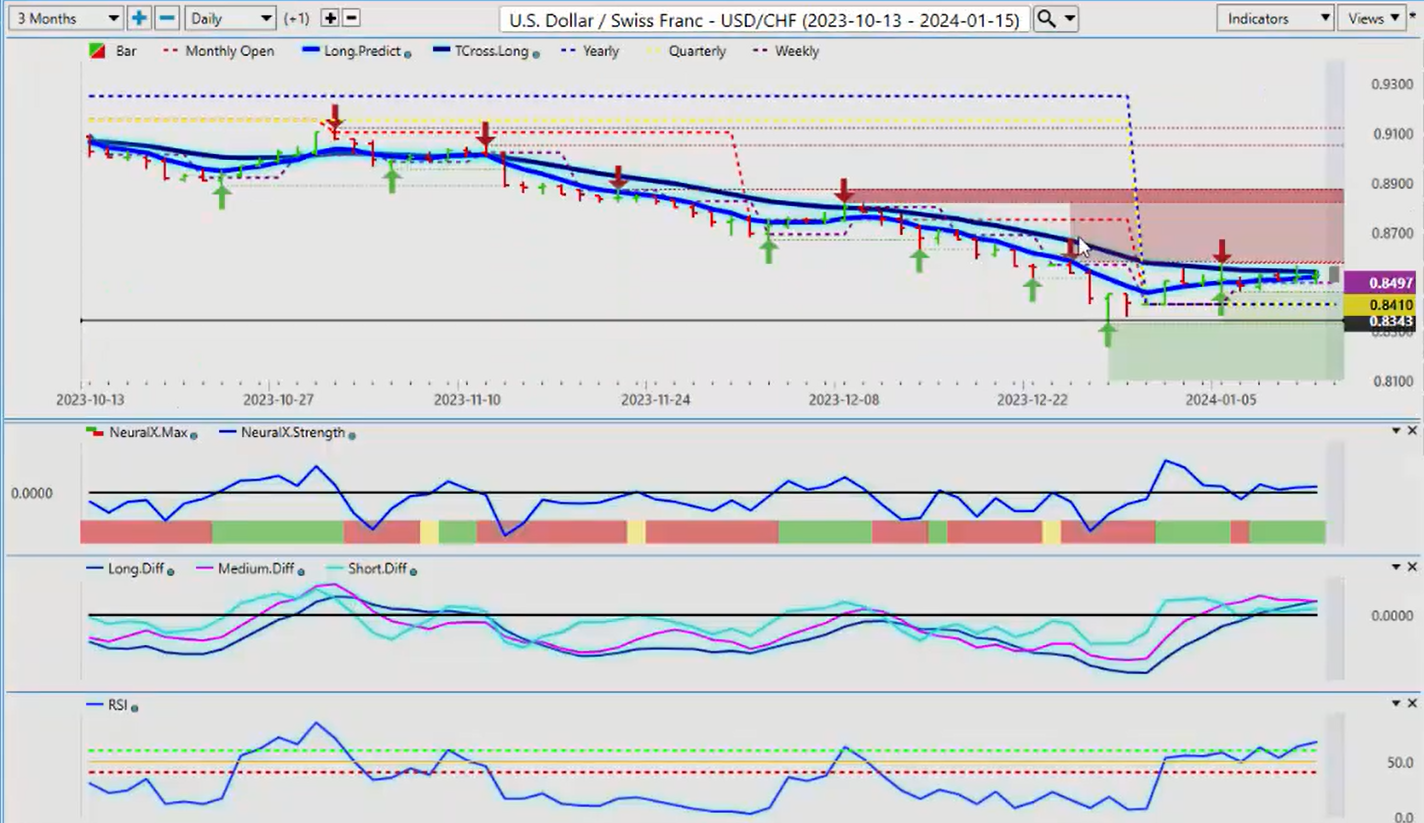
Now, should the Dollar sell off for the next few weeks, then US Swiss Franc would be a good selling opportunity. Right in here, our T cross long, 0.8541. That’s our key level. But we are above the current quarterly opening at 0.8410. So, at the very least, I anticipate a move back down to that level. This move is about to likely occur next week. We can see that our pink line is getting ready to cross over our blue line, meaning that the medium-term trend is weakening against the longer-term trend. So it’s a contrarian reversal indicator. It will go off much quicker than your standard indicators. Now we’re above the zero line here. It could be corrective in nature, but either way, it’s likely we’re moving back to 0.8410 with that contrarian setup.
British Pound versus U.S. Dollar
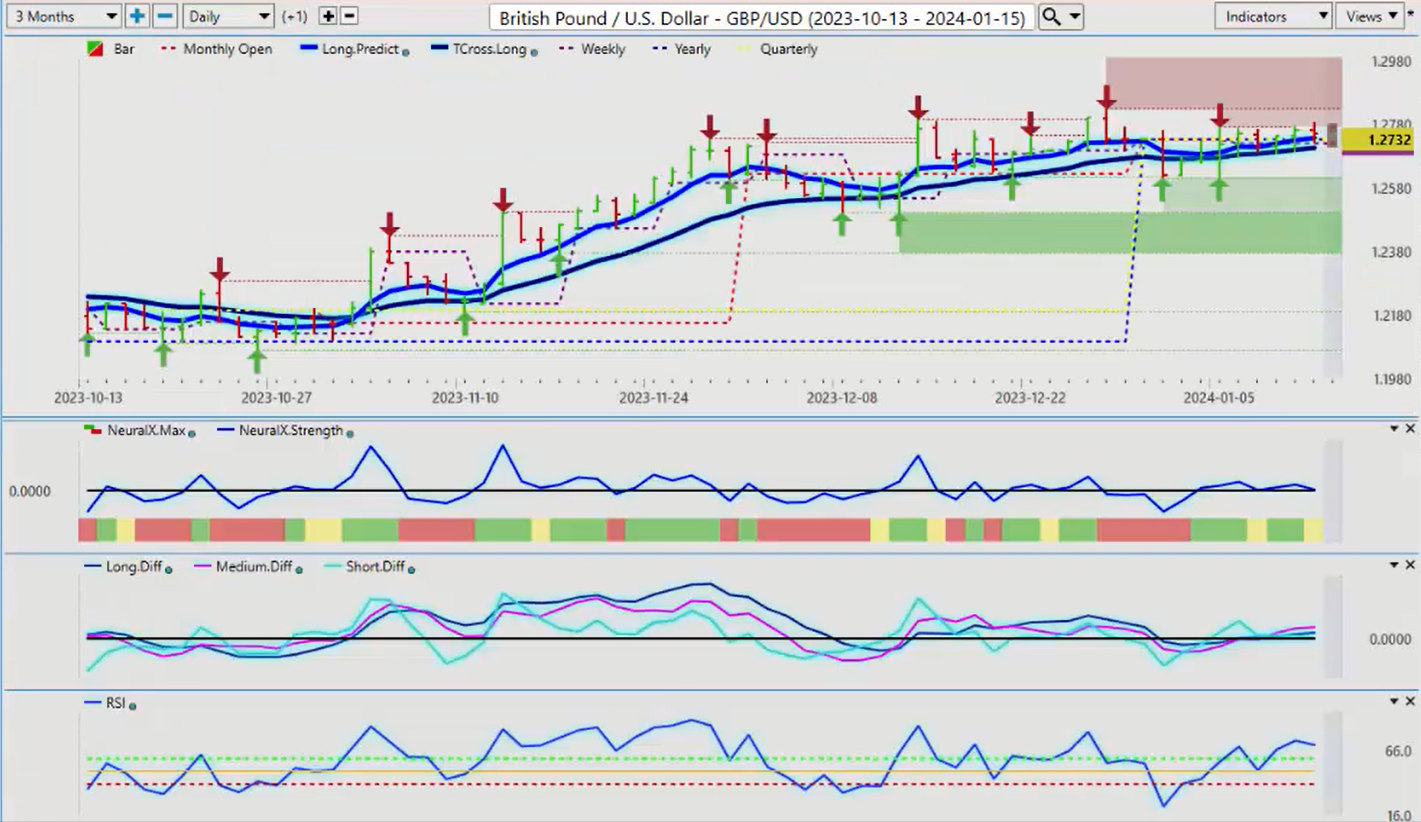
Now the British pound for next week, the British pound came out of last week very strong. And you can see the power of the Vantage Point predicted moving average. Our T cross long, every single day we can buy off of this particular level. So to start the week next week, I anticipate Monday will be a down day. And then we would use that down day to get long on this. So again, when we look at our T cross long, that’s coming in at 1.2705. There’s a lot of activity, the quarterly and yearly opening, the weekly opening. There will be a new weekly opening for next week based on the close price of 1.2751. So basically, we’re looking to hold above 1.2751 and then stay with the core VantagePoint indicators, which are all showing that it’s likely going higher on that dollar weakness.
U.S. Dollar versus Japanese Yen
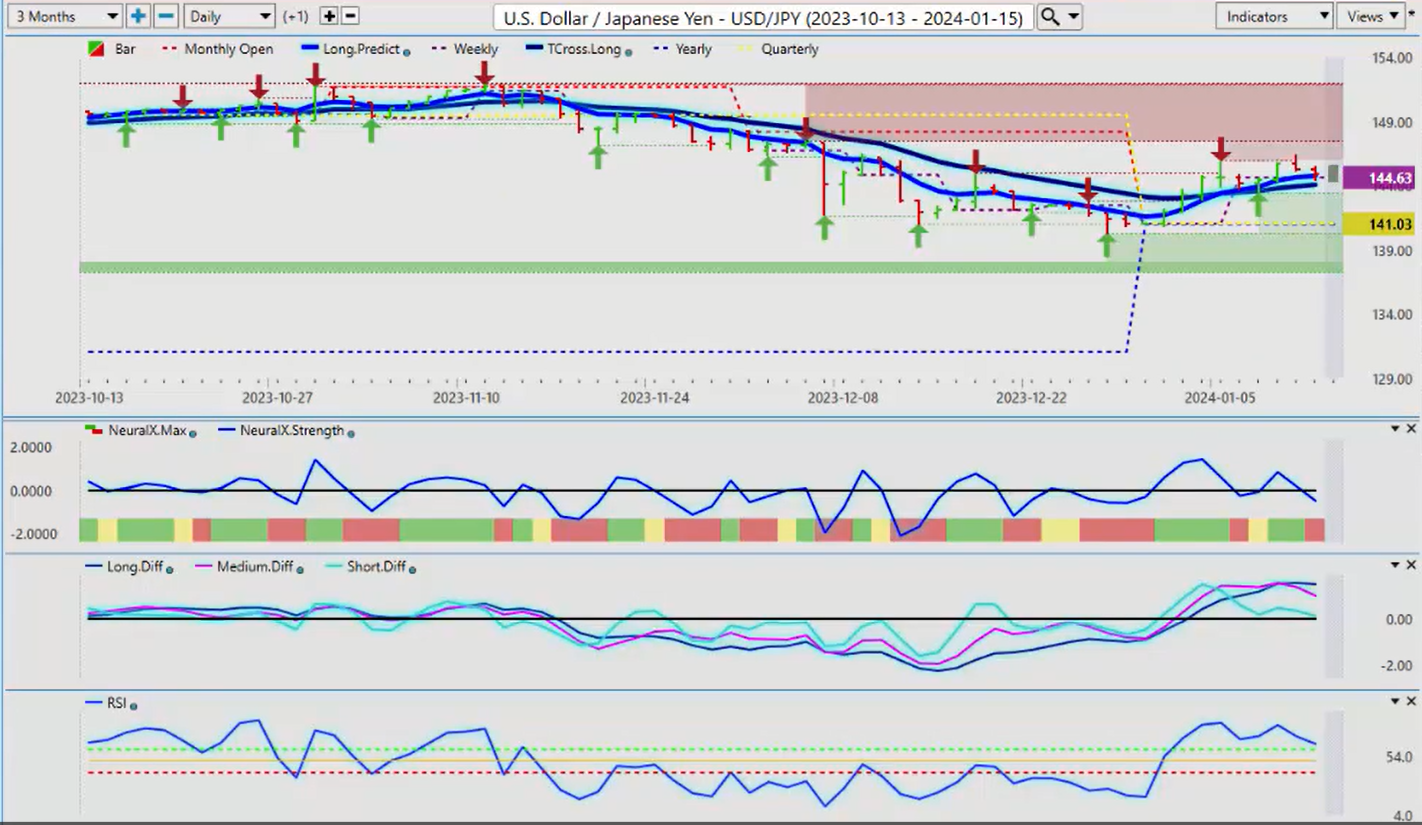
Now we did see a lot of volatility this past week in the dollar-yen, particularly on Friday, as I anticipated, as we worked on in the Vantage Point live training room, where I had discussed that the CPI number, 3.9 versus 3.8, is really insignificant because the CPI is a lagging indicator. But the producer’s price index was considerably softer, and that’s current data. So again, and then leading economic indicators are things like consumer confidence, retail sales. These are ones we want to watch, not the lagging unemployment numbers, the lagging CPI, because again, the current state is that the producer’s price index inflation is coming down. So, dollar-yen did not respond well to that. It immediately sold off from the 145.50 level, and down we went. But this is still the carry trade. So, we’ve got to be careful with this because everybody’s still looking to get long the dollar, short the yen. But again, other pairs like the US Swiss Franc have bucked the trend. The yen has taken the bulk of the carry trade. But if that carry trade is getting ready to come unwound, it will start to price in sooner rather than later if they’re anticipating Fed rate cuts. The interest rate differential between the Bank of Japan and the Federal Reserve will shift in favor of the yen. But I don’t think that’s going to be anything that’s going to happen overnight here. It’s going to take months to get those cuts. And even then, the interest rate differential still favors the dollar. So again, we’ll watch this one, but there is a clear contrarian signal here. The MA diff cross crossing to the downside, neural index strength pointing straight down, the neural index red, and we’re losing that momentum in the RSI. But the RSI is technically still bullish. So again, we will monitor the TR cross long going into next week’s trading. 144.10. If we have a sustained break of 144.10, then the attention carry trade starting to come unwound a bit, it was likely will be in progress. So keep an eye on that area very, very closely.
U.S. Dollar versus Canadian Dollar
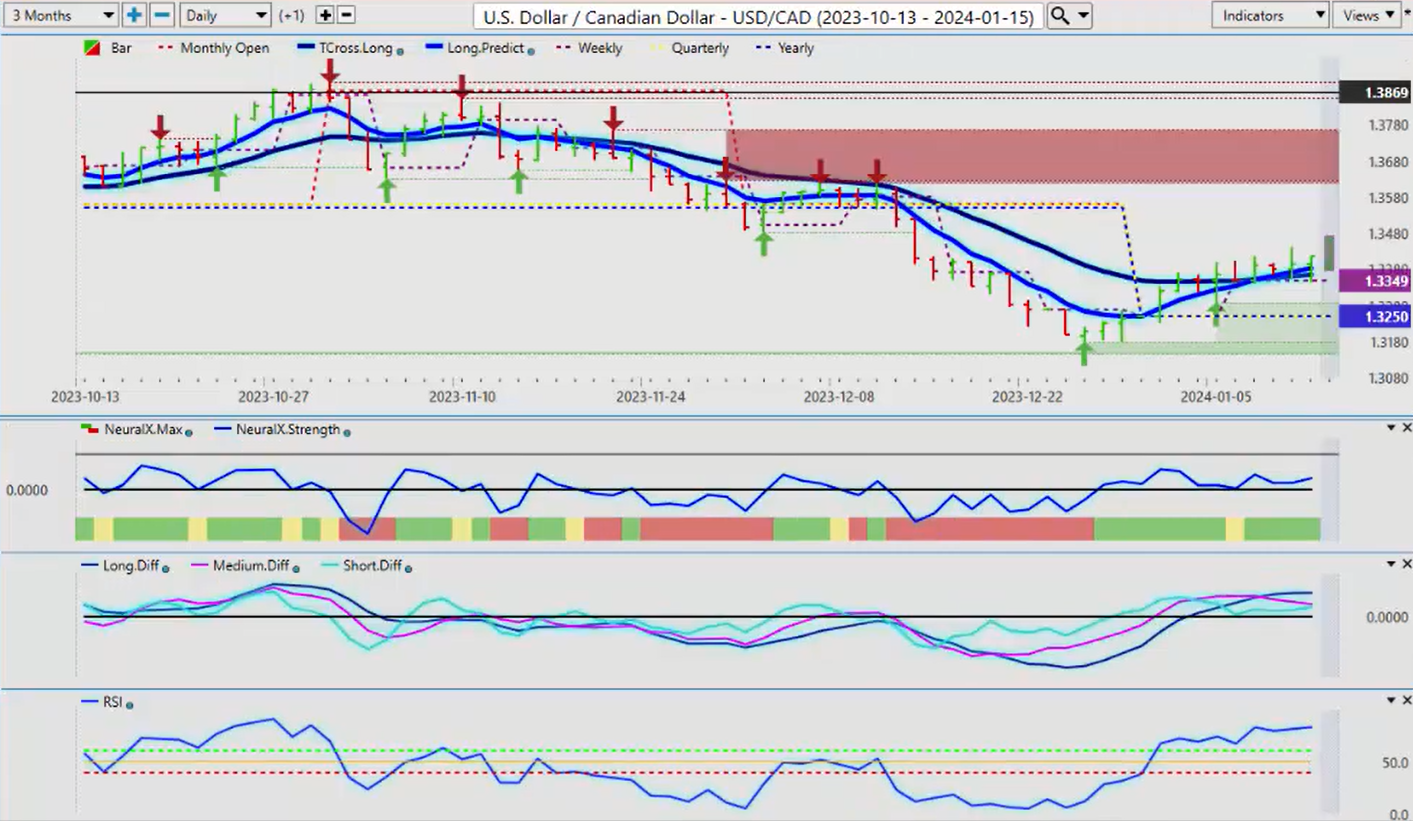
Now when we look at the US Canadian pair, I believe personally as a Canadian that the Bank of Canada will be the next one to signal significant rate cuts coming. I could argue Canada is in a recession now. Housing market, a number of different factors, carbon tax is killing everybody. So again, nobody’s really buying a lot of things here. So that’s going to come out in the inflation side of this, and I believe the Bank of Canada will have to address this. So there could be still, even with dollar weakness, we could still have a long trade here. The yearly opening price or the quarterly opening price is 1.3250. We remain slightly bullish while above this level. But again, the contrarian indicator for next week, the MA diff cross is again warning of dollar weakness because the US dollar is the base currency in this particular pair. So as we start to move on this pair, keep a very close eye on our T cross long, 1.3367. If we get a sustained break of this level, then we likely are heading back down into the 1.3250 based around that short to medium-term dollar weakness until the end of the month. So again, watch that level, but be very cautious with this pair. It is the most notorious running, I think about 90% on a Monday, Tuesday reversal for no reason. So if it goes up really hard on Monday, it usually goes down on Tuesday. Goes down hard on Monday, goes up on Tuesday. It’s… It can be a very frustrating pair to trade, but hopefully that little tidbit or that little nugget I just gave you there will help you in your trading. Just to be, if nothing else, be mindful that it’s happening.
Australian Dollar versus U.S. Dollar
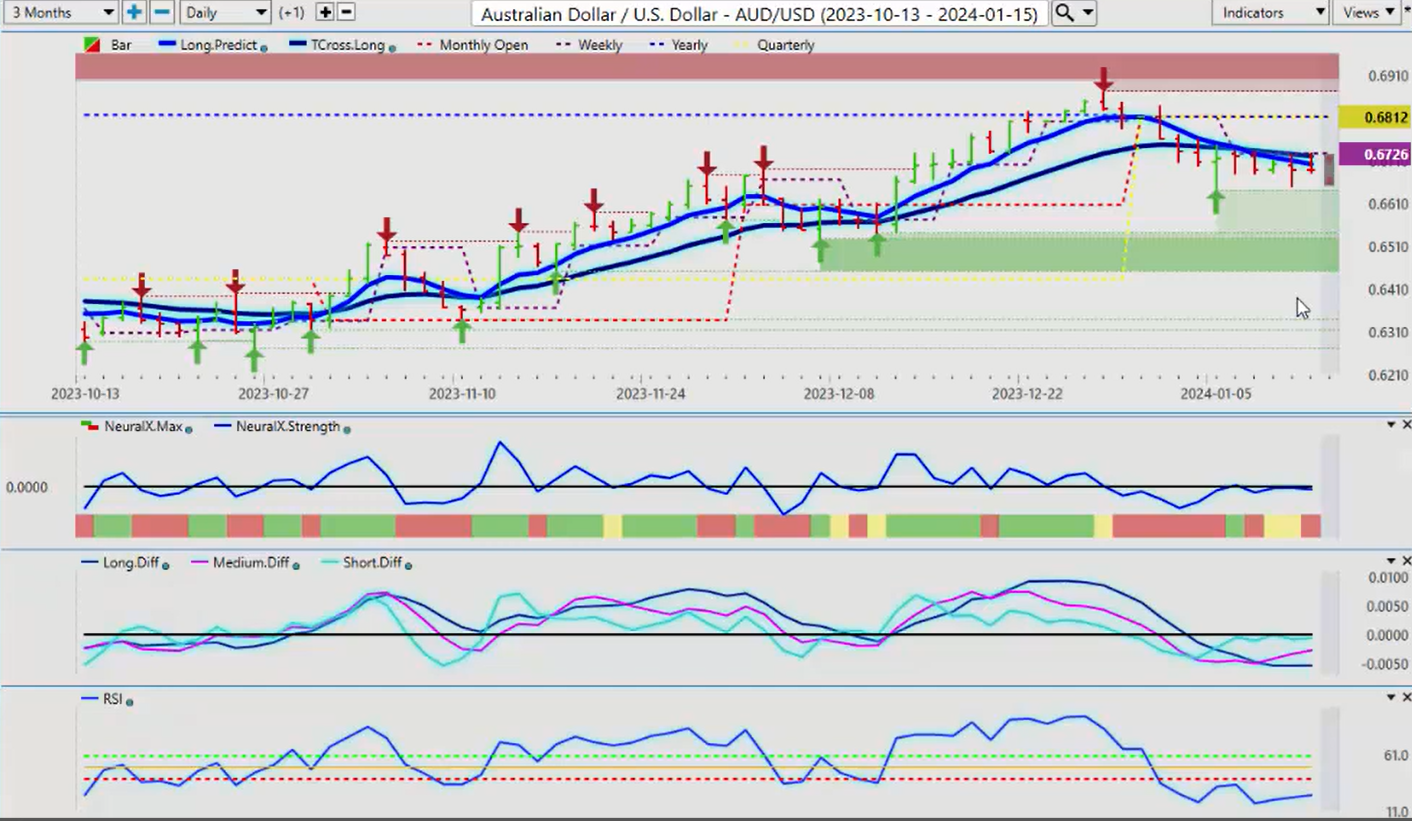
Now when we look at the Aussie and the Kiwi for next week, the Kiwi carries a slight, slight edge here versus the Aussie. And that’s showing up in the Aussie/New Zealand cross pair. But if Aussie/New Zealand cross pair turns back to the upside, which I believe it very well may, that may happen next week, then that would put more emphasis on the Aussie currency Rebounding against the US dollar too. So, again, starting off the year bearish, yet again, this pair is something. But again, I believe this to be short term. And again, we also have that contrarian reversal indicator.
New Zealand versus U.S. Dollar
We can see the same reversal indicator on the Kiwi. It’s virtually the same trade; however, you can see that the Kiwi is slightly stronger. Just I did get a question on this last week: how do you gauge which one of these pairs to trade? And my answer is going to be this. I thought it’d be easier to answer it on here: this is where the Aussie is getting the weakness from. There is no such thing as Australia/New Zealand; it is made up of Aussie/US and New Zealand/US. So if they’re selling Aussie/New Zealand, they’re selling Aussie/US first, guys, and they’re buying New Zealand/US. That’s what this trade is. So again, just a little nugget there to remember, always maybe come over and check your cross pairs to see what’s going on because as this pushed lower, but as you can see, we’re coming into a verified support low at 1.0690. If this area of 1.0690 holds, then that would tell me that it’s very, very likely that the Aussie/US is getting ready to reverse as well. So just another way that we can trade these markets successfully.
With that said, this is the Vantage Point AI Market Outlook for the week of January 15th, 2024.