-
View Larger Image
Welcome to the Artificial Intelligence Outlook for Forex trading.
VIDEO TRANSCRIPT
Okay. Hello everyone, and welcome back. My name is Greg Firman, and this is the Vantage Point AI Market Outlook for the week of June 10, 2024.
U.S. Dollar Index
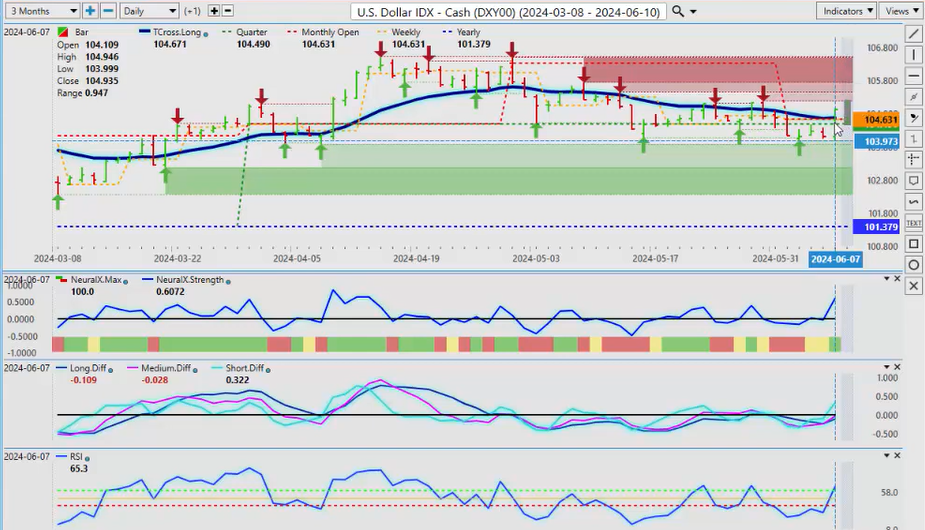
Now, to get started this week, we’ll begin with the Dollar Index . We’re coming off the non-farm payroll number on Friday, so just a quick look at some of those numbers here so everybody has a better idea of what’s going on with this labor market. The U6 clearly is going the wrong way. Now, there are positive attributes about that report, but there are quite a few negatives also. The main one that’s caught my attention is the U6 number staying higher, and now we’ve broken that psychological unemployment number of 3.9%, going to 4%. In most cases, that usually leads to dollar weakness.
Now, we’ve had a big spike up in thin, liquid markets clearing the T cross long, but as you can see, there are significant headwinds above the 105 level with these verified zones coming in at or about 105.18. As a licensed CTA, I do carry a Series 3 Commodity Futures and a Series 34. It’s important to look at what is actually going on here. The markets reacted to this, but again, the numbers are not as clear as they might appear to be. Very often, the dollar sells off the week after the non-farm payroll number regardless of what it is because the real dollar buying has already occurred.
So, a very choppy week last week. There was a lot of chatter about the interest rates. The Bank of Canada has sent a very clear message to the market: they cut, and Tiff Macklem has said very clearly that there are many more cuts coming. The ECB has cut, and they’ve said to the Fed that basically it was a very hawkish cut from the ECB, saying they’re not doing anything until the Fed makes up its mind what it’s going to do. Then, Jean-Claude Trichet, the former ECB head, was interviewed and said he’s unclear why the Fed hasn’t cut already.
So again, we talk about this briefly each week because it’s all about interest rates when it comes to the next move on oil , on gold , but on currencies and even the equity market . Right now, we would look for if the dollar has any life and it can move higher here. We must stay above 104.67. But on a side note, my monthly projected targets have already—well, they haven’t been met quite yet, but about just over the 105 area is about it for the month. So, we’ll see how the market responds once they’ve had a chance to look deeper into that labor report. Very often, once they look closer at it, the dollar loses its shine somewhat, so to speak. So be careful. I would anticipate the dollar rally will continue on Monday into part of Tuesday, and that’s where you want to be careful. The indicators are mildly bullish here, but we have only a short-term crossover. This is this blue line, which means a crossover in the short term has occurred. But in the MA diff, this is a good warning sign which I talked about last week, and I’ll talk about it again in a moment here. That is saying we’re correcting higher, but again, we’ve got to watch these areas up here. If we can’t get past this, then buying EUR/USD , buying GBP/USD —these trades are still valid, which again I’ll talk about in a moment.
Gold
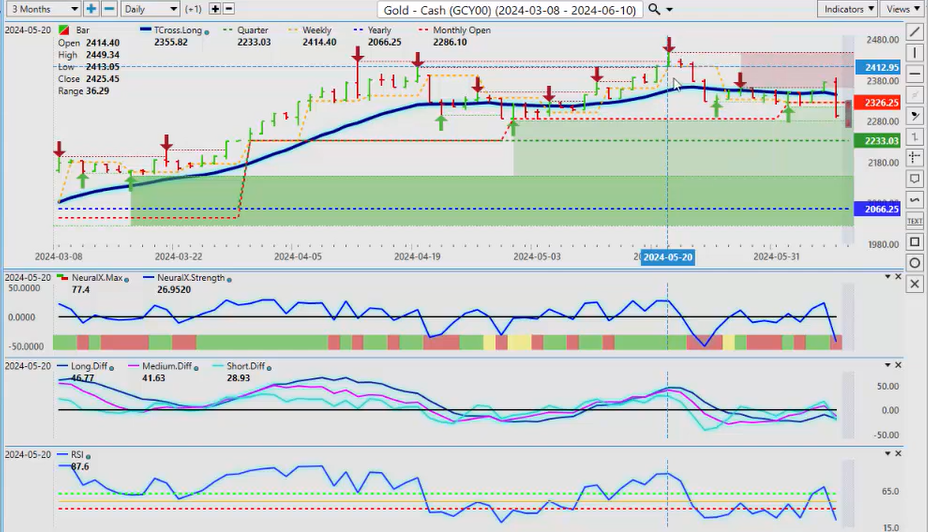
Now, when we look at gold for the coming week, gold backed away, but once again, as I had discussed previously, gold usually runs out of buyers around midday. Yes, I’m fully aware that China is buying gold, but am I going to buy gold because China is? No, I’m going to buy gold based on the affirmation levels and the signals from the VP software just to confirm whether we’re going to continue seeing buying. Now, I do believe that gold will rebound here. You can see that gold has reacted to that non-farm payroll number, but again, we need a couple of days for this to digest to see how the institutions and the bigger players are going to react to this. Gold has had a push lower, but we are firmly above our quarterly opening and yearly opening price, and I believe we could have more of a risk-off scenario brewing here as tensions between the US and Russia are picking up. My understanding is there are several warships being pulled into Cuba as early as in the coming weeks, and a nuclear submarine. So, I think that heightened tension may not only help the dollar, but it may help gold here too.
So remember, we can’t just look at levels and technicals and things like that. We have to discuss fundamental events that are occurring all around us, and we want to marry the two together. I believe gold will hold above 2233, and I believe it to be a reasonable buying area. However, I want the indicators on board, and I believe the indicators will start to roll back to the upside by the middle of next week. This is an outlook, not a recap of something that’s already happened in the previous trading week. We will monitor these levels very closely, but I don’t feel that gold is done just yet, though it is carrying that bearish sentiment after that payroll number.
S&P 500 Index
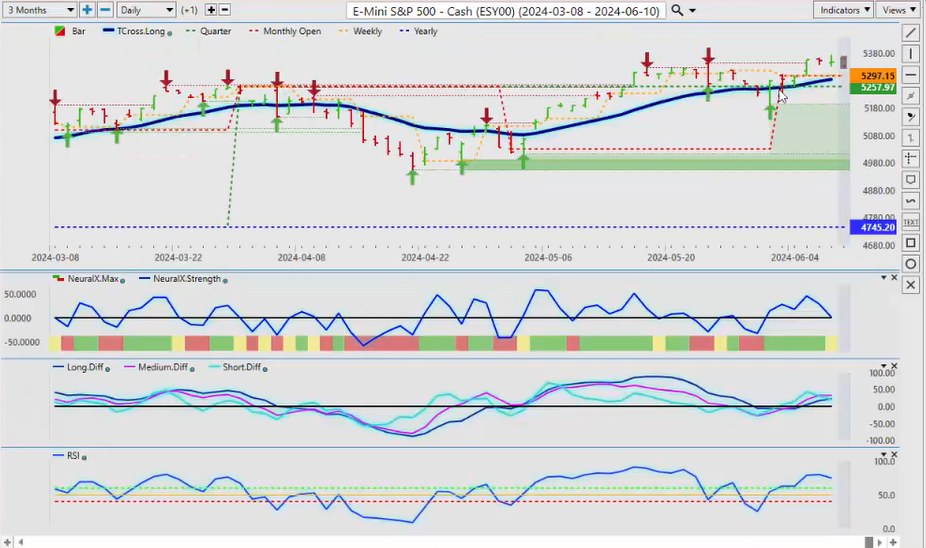
Now, when we look at the equity markets going into next week, that risk-off scenario I’ve discussed will see if it goes anywhere. I thought I would mention it because it is a fundamental aspect. When we look at equities right now, we’re holding above our quarterly opening price and our monthly opening price, but more importantly, that is intersecting with our T cross long coming in at 5283. As long as we’re holding above 5283 and our quarterly and monthly opening prices, that gives us that bullish bias in the equity markets. I believe that the Fed will be forced into cuts later this year. It could be one, it could be three, or it could be none. It’s possible, but as I’ve stated week after week, the data is catching up to the Fed. One thing with that labor report is the downward revisions. Remember, the U3 is just a household survey number. The broader unemployment data has good and bad pieces to it, but again, I think equity market traders are looking for the Fed to cut, and they believe that he’s going to, so they are staying long in the equity market.
We can identify a very clear level, and that is our T cross long. We can follow that up with a quarterly opening, much like what I’ve just shown you with gold at 5257. These are price-based tools, and right now equities are positive on the quarter, gold is positive on the quarter. That’s the way we would look at it. The indicators are relatively neutral, but I believe that stocks will rebound when the market has had a chance to digest all of that labor report.
Bitcoin
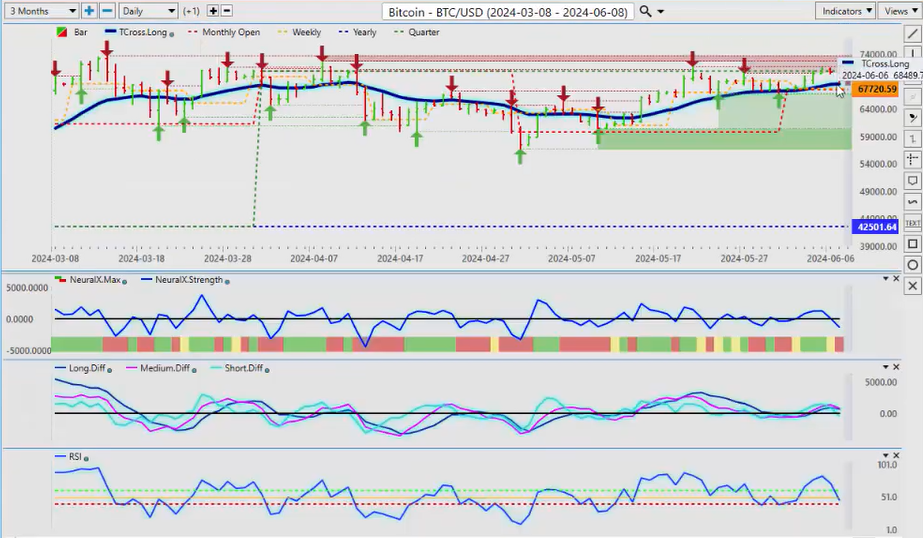
Now, when we’re looking at Bitcoin for next week, once again, Bitcoin is really on a tear. You can see that we came right down to our T cross long, but this occurred earlier in the week, and we’ve rallied directly off the T cross long and the weekly opening price at 67720. When I have the monthly opening, the weekly opening, and the T cross long intersecting in that area, it provides an excellent entry point, a value-based entry point. When we’re looking at investing or trading, we’re always looking for value. That’s why we use products like Vantage Point, to show us if something is in or out of fair value. The market decided fair value is the T cross long, and Bitcoin has extended higher. This green level up here, the quarterly opening at 70885, is the level we need to push above. If we do, we will likely get our breakout higher. Bitcoin is clearly outperforming gold; there’s no comparison between the two. Gold can still move lower, and Bitcoin can extend higher; that is still a very strong possibility. Some big numbers are being forecasted for Bitcoin, 250,000. I don’t know if we’ll get there or not, but we need to deal with the immediate levels, not worry about the future too far ahead because a lot of things can happen in the meantime. Still bullish here, but it’s a little bit soft. You can see that once we came up and hit our quarterly opening, we’ve been stalling above that particular area. We retraced back down to the T cross long, and we’re holding there for now.
Light Sweet Crude Oil
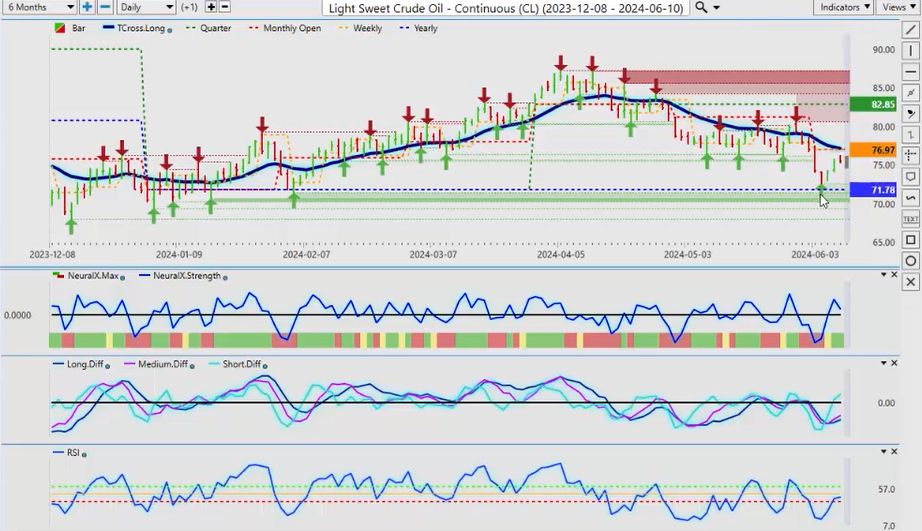
When we look at light sweet crude oil , it’s another great example of applying the current yearly opening price. If we’re looking at rolling performance over the last 5 days, the last 30 days, the last 90 days, we’re not seeing the bigger picture. You can see that light sweet crude oil rallied off the yearly opening price right at the beginning of the year. We retraced back to it on February 5th, and we’ve had an even stronger rally. In the Vantage Point live training room the last few weeks, we’ve been targeting the 71 area. You can see we’ve come very close, with a low of 7248, and oil has had a significant rebound. It’s targeting the T cross long at 7708, which is our obstacle for next week.
We need to get above that level. Again, as I’ve stated previously, in most years, gas prices, oil prices, and pump prices at the pump go up and they feed these types of contracts a seasonal pattern. The indicators here on oil are bullish. We’ve got our MA diff cross here that is warning us that we’re extending, but what I want to point out with this MA diff cross down here is it’s showing a corrective move back up. We’ve got our yearly opening price to buy from, and then we have our upside target. However, we would need these lines crossing the zero line to tell us that we’ve got a crossover. That’s what we’re looking for, but the immediate resistance area is the T cross long at 7708. I would not disagree that oil does carry a slightly bearish tone to it but offers an excellent buying opportunity provided you have the current yearly opening price as a guideline.
DAX
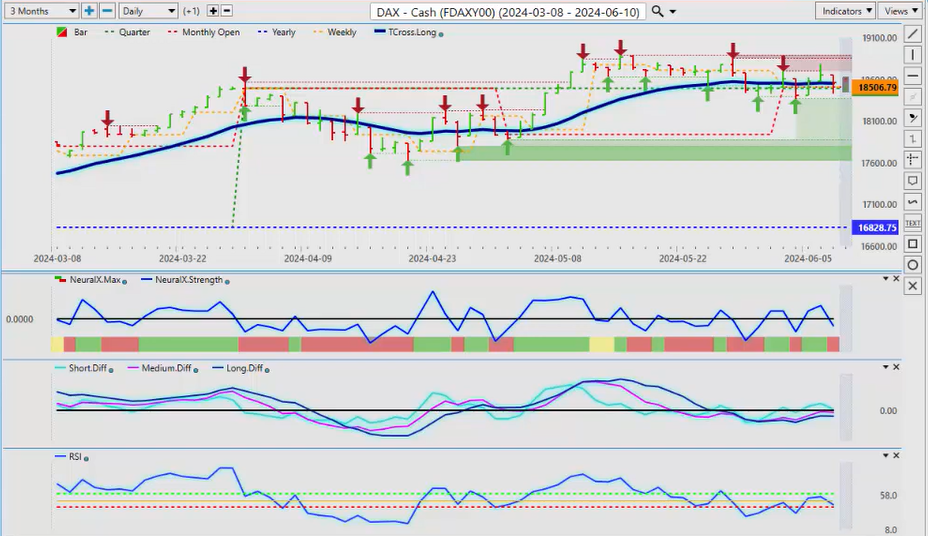
Now, when we look at our European equity markets with the DAX , again, a hawkish hike didn’t really push the European equities. I was very surprised to see Lagarde kind of take a bit of a shot at J Powell, saying, “We’re not doing anything until you make your move.” The European equity markets didn’t really like that comment too much because they were looking for a dovish ECB and they didn’t get it, so their equity markets backed off a little bit. You guys are still looking okay. We just need to stay above this T cross long here, and that number for next week is 18,551. However, I suspect it could come under pressure because now it’s a wait-and-see game. What is the Fed going to say next week? It’s going to be choppy because you’ve also got the US CPI next week, which could give us some direction. Always remember, with that US non-farm payroll number, it’s a lagging number. It’s the previous month, and we have already seen that the revisions are showing the unemployment rate is ticking up. I believe the revisions will get even stronger as we go forward and that the labor market is nowhere near as strong as what we’re being told based on the Fed’s or the BLS’s own numbers.
Volatility Index
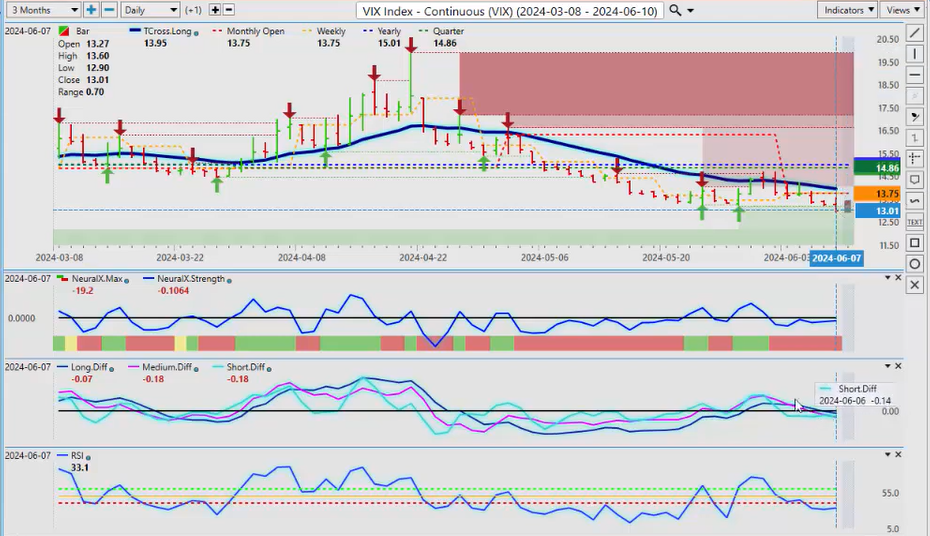
Globally, we want to make sure we’re looking at the VIX . The VIX staying very negative is important. Again, we’ve got our MA diff cross right on the T cross long, and that is what would allow us to stay in our S&P 500 , NASDAQ , or even individual stock trades because the VIX is still pointing down. If the VIX is down, our global indices or at least the US indices should be up. When we look at that MA diff cross and we look at it again, just as a reminder, this is an outlook, not a recap of something that’s already happened. When I discussed this last week, I used First Solar as an example. To clarify, doctors, lawyers, airplane pilots, they don’t buy high and sell low and make up in volume, or at least not my direct client base. They take the Warren Buffett approach and look for value. I am certainly not saying that First Solar is not a good long trade or a buy. I’m saying that the Vantage Point indicators are warning that this is not the time yet to buy. Our MA diff cross has taken place and we’ve dropped 6%. When I discussed this last week, we’ve dropped 2.98%. We did have some mild buying here, but you can see that now you have two verified zones that have formed up at this high of 285. If we’re going to buy high, then we need to clear this level and then use 285. If we did buy high, just remember, this stock was at this price back in 2009, and then it was down for about 15 years. Again, everyone is free to trade how they want, but buying high and selling low, like GameStop, there’s many examples of how disastrous that methodology can be.
Do I buy high or sell low? Yes, I do at times, but it has to be with that Warren Buffett approach of value. If there is value in buying high, then I will. This stock is bullish, but I just wanted to point out that our retracement or if I was willing to buy First Solar, then I would look at 250, which is our cross long, or I would click on my F8 and say, “Okay, well, wait a minute. I’ve got 269.09. Maybe that area there is pretty good.” So we can identify two specific areas. But as you can see, the MA diff cross which I discussed last week has progressed to a medium-term crossover. If I click on my F7, you can see that the bearish sentiment is starting to build. This is simply to show you guys how to alternate strategies that are very much applicable to all the given markets.
Euro versus U.S. Dollar
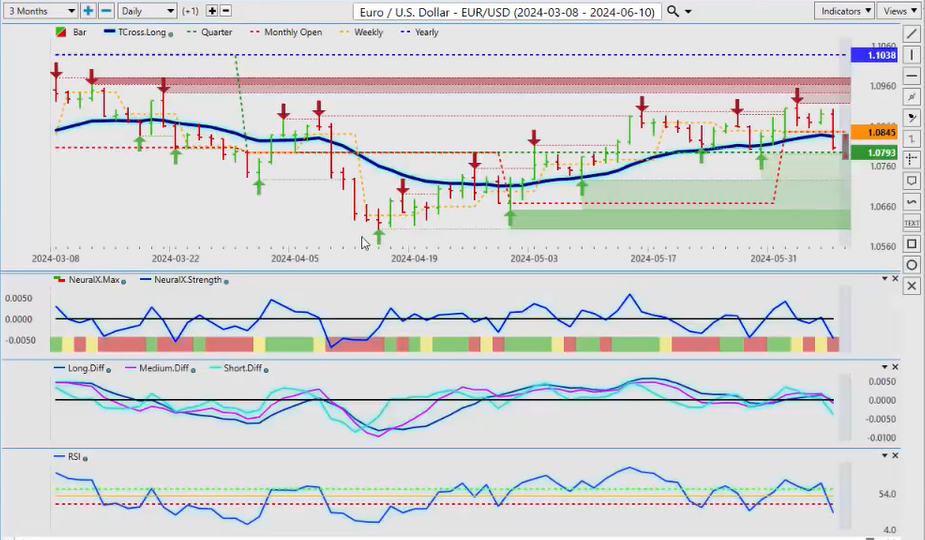
When we look at some of our main Forex pairs, again, the EUR/USD pair, this is a dollar index trade. When we look at it right now, the euro has responded negatively, but it actually responded positively to the ECB’s hawkish cut. Now, we’ve broken down below our T cross long at 1.0834. My prediction would be that the euro will sell off further on Monday and maybe even part of Tuesday. Be very cautious continuing to sell because I believe all eyes are going to be on the Fed, and I believe the Fed is going to maybe carry a little bit of a dovish tone and warm the markets up to the idea of a rate cut. We’ll see. Again, we need to talk about these fundamentals. It’s not about being right or wrong; it’s about discussing fundamentals with the key levels, and the interest rates are always a fundamental that we need to monitor.
Once again, when we look at the setup of the EUR/USD pair, 1.0793 is the quarterly level I want to stay above by the end of next week. If we don’t, that sets a bearish tone for the euro. The indicators are warning that we’ve got crossovers going off, but the fundamental that caused this was the non-farm payroll number. Is that data sustainable to keep the pressure on selling the euro? I don’t believe it is, but I will monitor this very closely. Fundamental events can cause distortion in price; it doesn’t necessarily mean that will continue. We’ll monitor the key level.
British Pound versus U.S. Dollar
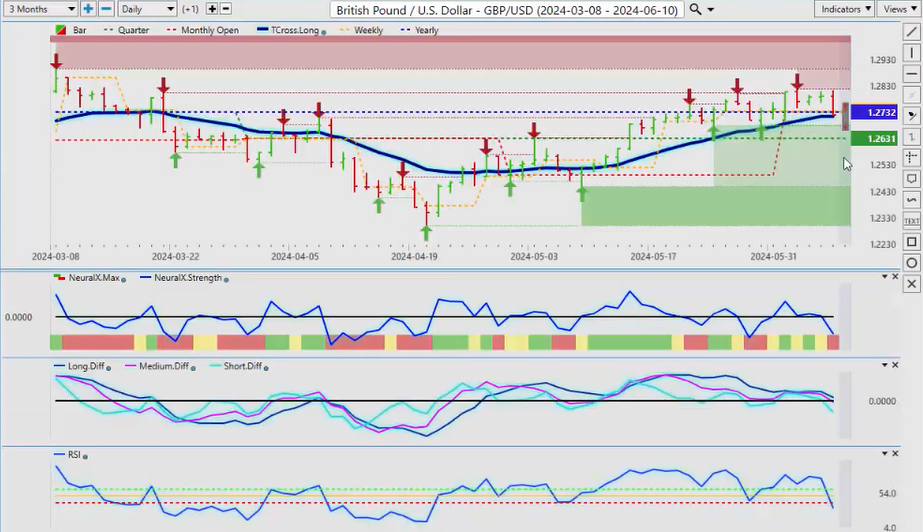
GBP/USD , again, in the Forex market, we’re either buying or selling US dollars. The dollar index is paramount to keep your eye on if you’re a Forex trader. Right now, a very interesting setup with GBP/USD: we’ve got our T cross long at 1.2714 sitting right near the current yearly opening price of 1.2732. We need to get back up above this level and stay above it if we’re going to buy. This is all a significant amount of congested resistance up here that we need to be very mindful of. I could see us maybe getting a little bit of a push down to the quarterly opening, which would be 1.2631, and in my respectful opinion, that would be a buying opportunity.
U.S. Dollar versus Swiss Franc
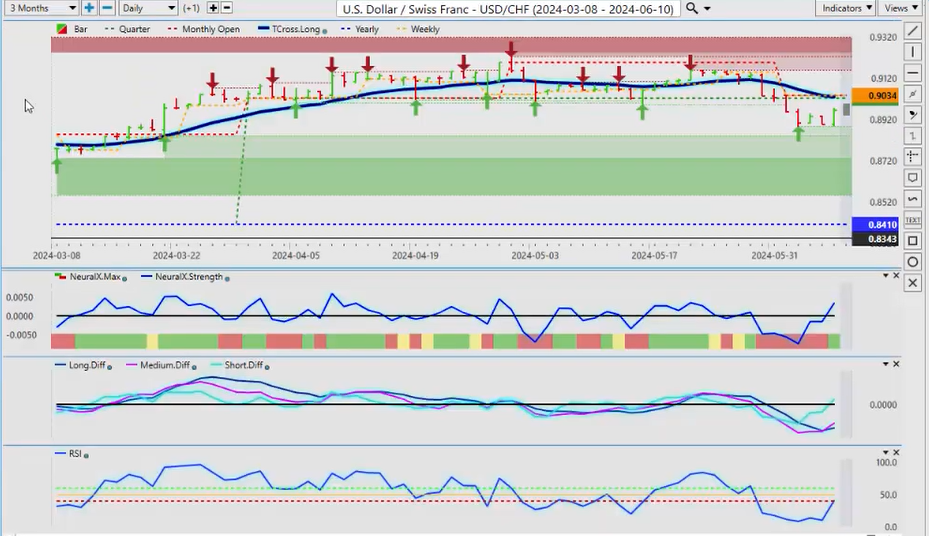
The USD/CHF , again, the Swiss franc was one of the first banks to go off with rate cuts, and that did hurt the currency temporarily. However, as you can see, the Swiss franc has rebounded on their GDP numbers and a few other issues. Right now, we’ve got a newly formed verified support low coming in at around 0.8885. We’ve got a considerable amount of visible support stacking up in a verified zone at 0.8894. The indicators, there is the classic MA diff that I showed you last week with First Solar, and you saw the outcome. Again, this is an outlook, not a recap of something that already happened. I warned you in advance on how to use the Vantage Point software for reversals or corrective moves. Well, this is showing the same: a corrective move. Our target would be back to the T cross long at 0.9026. That’s the area we would target, and then we would reassess once we get up there. This could go the other way by Tuesday or Wednesday next week if the market determines that the labor market is not exactly what that report suggested.
U.S. Dollar versus Japanese Yen
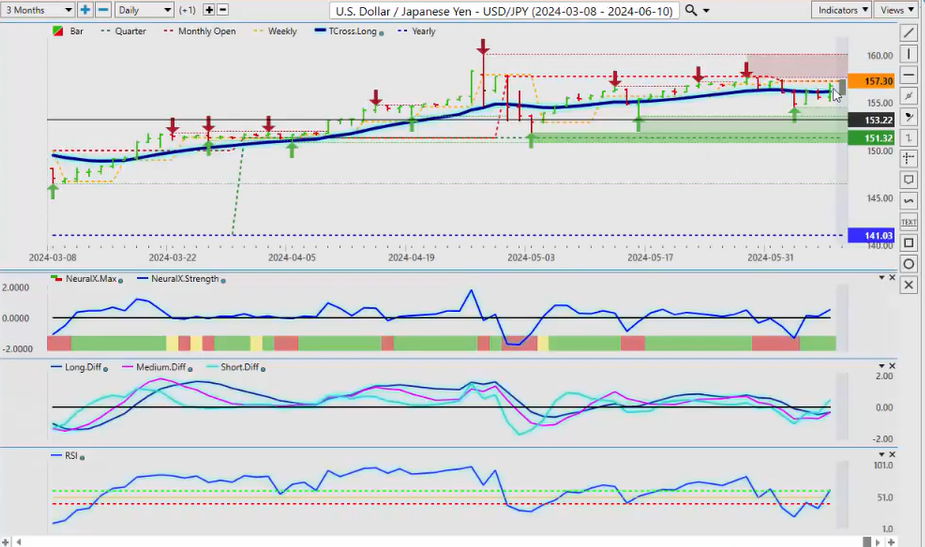
When we look at the USD/JPY , the carry trade is still very much on here. It’s probably one of the most stubborn carry trades I’ve seen in 30 years, and they’re just not leaving it. Right now, our monthly opening and our quarterly opening at 151.32, we’re holding in there. However, I believe this could come unwound on a risk-off scenario, so we’ll monitor this pair. It is showing a buy signal; the software is showing a buy signal for next week, but I would be very cautious with this. 157.30 is the monthly opening price, and if the market feels that a risk-off scenario is coming, then they could move into the yen or the Swiss franc. Those are two alternative currencies that they will move to. Be very cautious with this particular pair.
Canadian Dollar versus U.S. Dollar
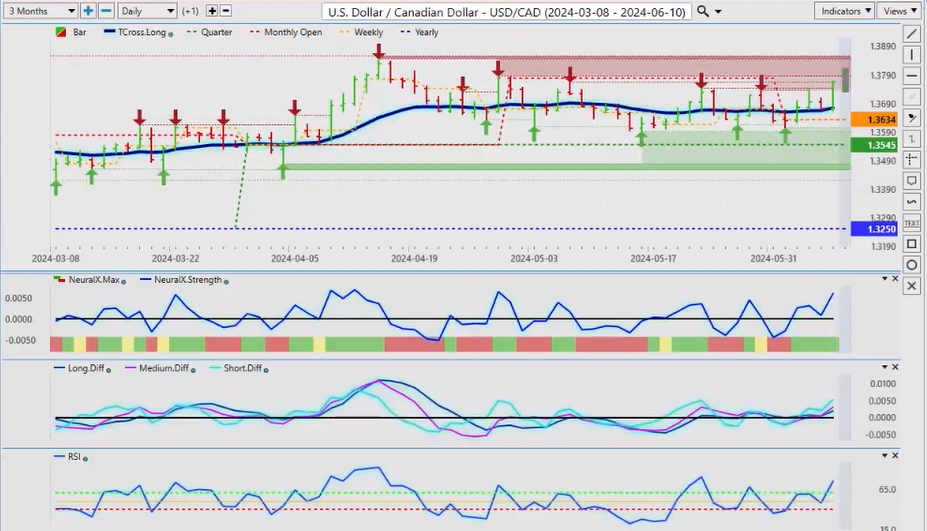
For next week, the Canadian dollar : we’ve got our rate cut, but it was a very dovish cut. If we look back to when the Fed wasn’t hiking, when the Fed said, “Okay, inflation is transitory,” the argument here for me would be, well, the Bank of Canada was one of the first ones to hike. They’ve now cut, and is the Fed lagging behind the Bank of Canada again? I believe it is because, again, the head of the Bank of Canada, Tiff Macklem, was very clear in his statement that more cuts are coming. Canada is the US’s biggest trading partner and vice versa, so what happens there in the US will often happen to us. I believe, again, that the Canadian dollar will take the brunt of this initially, but I also believe it will rebound on higher oil prices. If we get stronger equity markets, that’s the inter-market correlation. Keep an eye on your S&P 500, keep an eye on your oil contracts. That could still indirectly support the Canadian dollar. If and when the Fed does finally decide and say, “Look, I’m getting ready to cut here, and it’s coming next month or the month after,” then that would trigger broad dollar weakness.
That’s what we would be looking for in the weeks and months ahead. But it’s anybody’s guess right now what’s going through his head. Just be aware that it’s a big deal, a very big deal in these particular markets. We’re still bullish well above our T cross long, but we have significant verified resistance up to about the 1.3846 area. The immediate resistance at these verified zones is coming in around 1.3750, with staggered verified resistance along the high at 1.3785. That’s where I believe your sellers are going to come out, probably as early as mid to late next week.
Australian Dollar versus U.S. Dollar
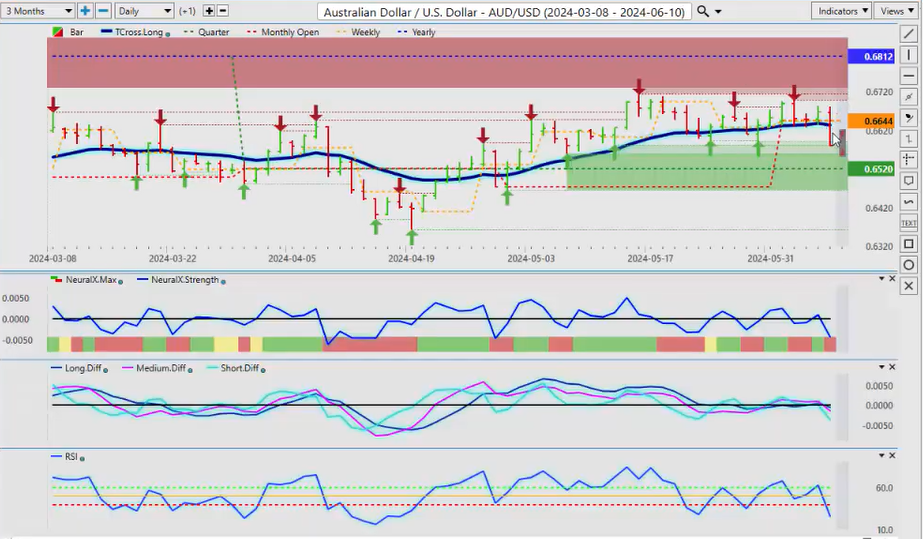
Now, the Aussie and the Kiwi —again, not a lot of buyers are coming in for the Aussie, and that payroll number has influenced this. The beauty of Forex trading is that you can have the same trade every single day using the Vantage Point T cross long. Every one of these trades was a very good buy. The one thing to note is that I don’t sell low and I don’t buy high in the currencies. Whenever I have a big long bar down like that, I can guarantee you we’re going to retrace at least 50% of this bar next week or potentially by late Monday or early Tuesday. It would take a significant risk-off scenario to change that.
For now, we are above our quarterly opening at 0.6520. I believe we will get down there, but I also believe that could be a buying opportunity. We’ll wait and let the market digest that payroll number.
New Zealand Dollar versus U.S. Dollar
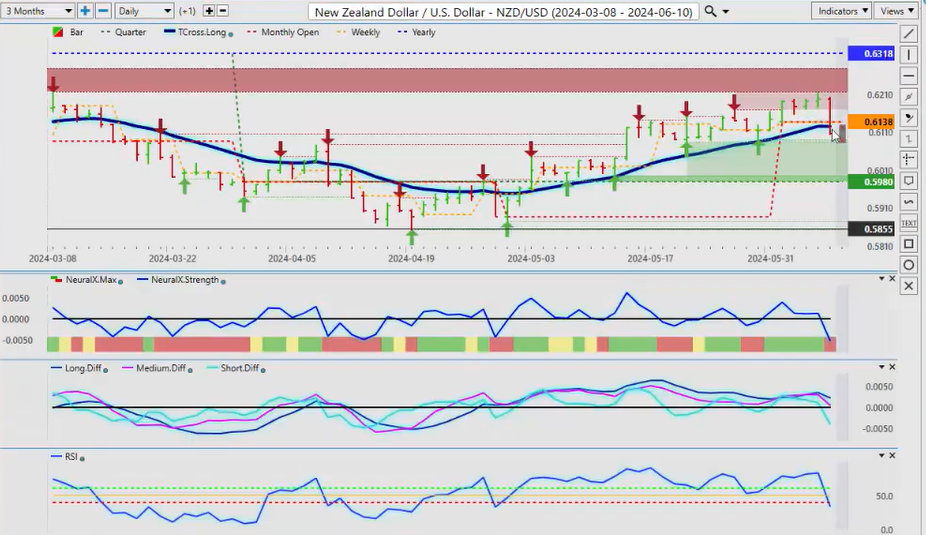
That will also affect the Kiwi (New Zealand dollar), which is holding its ground a little better. As I’ve shown you in the past, Aussie/New Zealand is your culprit. They’ve been selling Aussie/New Zealand, which indirectly strengthens New Zealand/US to some degree. Now, I’m seeing signs of a potential reversal here once again using the current yearly opening price at 1.0781. Once we clear that, we go to our T cross long at 1.0830 and will reassess if we can break through that level. This will also indirectly tell us what to do with that Aussie/US pair.
On a side note, next week will be very volatile again with the US CPI and the Federal Reserve. Hopefully, we’ll get a clearer picture from the fundamental side of where we’re going. With that said, this is the Vantage Point AI Market Outlook for the week of June 10, 2024.