-
View Larger Image
Welcome to the Artificial Intelligence Outlook for Forex trading.
VIDEO TRANSCRIPT
Okay, hello everyone, and welcome back. My name is Greg Firman, and this is the VantagePoint AI Market Outlook for the week of June 24, 2024.
U.S. Dollar Index
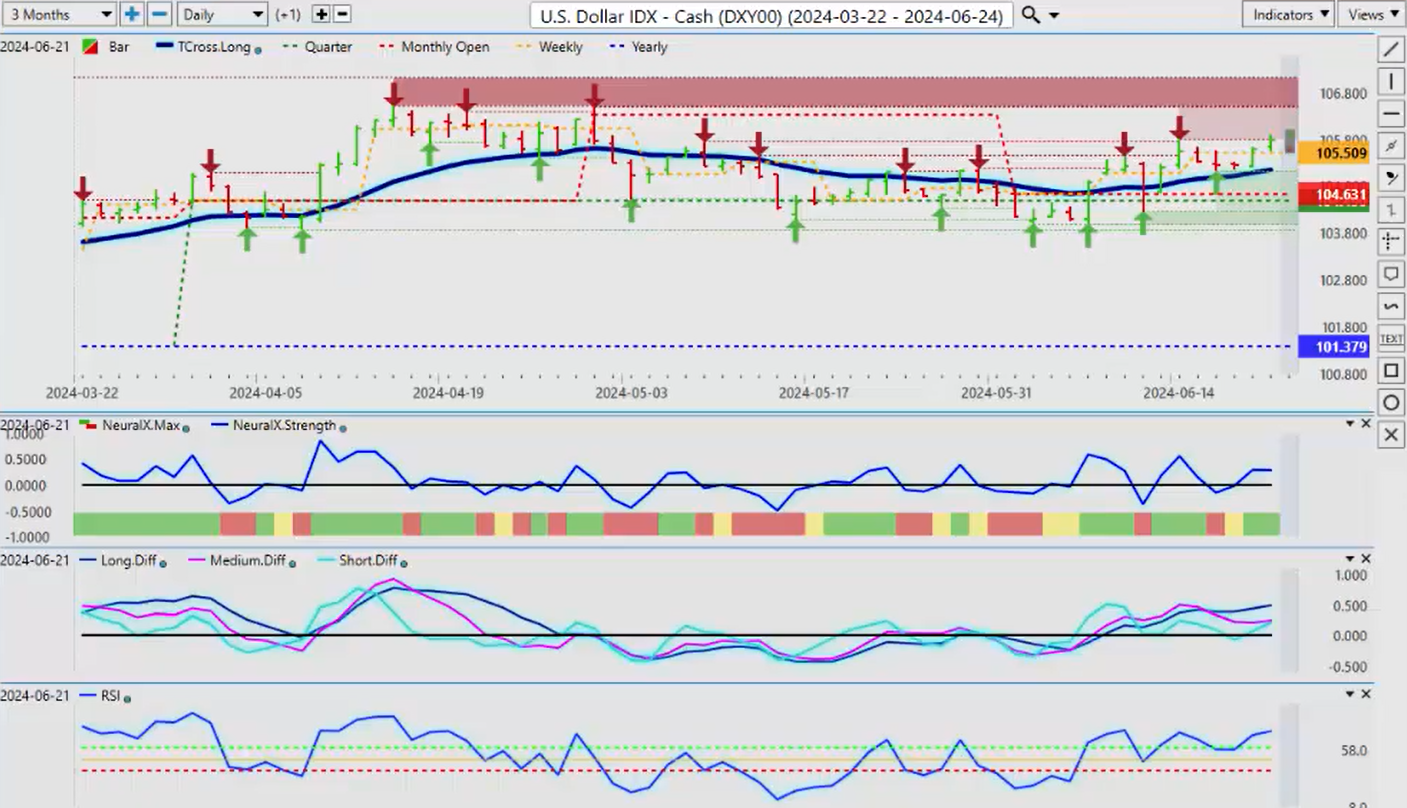
Now, to get started this week, we’ll begin again with that very important US Dollar Index . Pretty much everything revolves around interest rates these days, so in our trading, the point of these presentations is not just to talk about technicals but also to bring fundamentals in because fundamentals drive the market in most cases, specifically in this case’s interest rates.
So last week, we looked at our Fed Funds Futures , and we’ll bring that back up so we can see that after the PMIs and some of the other very mixed data, there is only a 10% chance of a rate cut in July. When we move into September, that’s come down slightly to 65.9% probability of a rate cut, but November and December remain strong at 78% probability of a rate cut, and in December, we’re looking at 94.8%. So the wild card here would be September. But again, the Fed is, in my respectful opinion, getting backed into a corner. The data does not support higher for longer; it does not support holding at these rates basically, so we’ll leave that at that. But this brings it into perspective, the fundamental that we need to monitor each week. We can debate what the Fed should or shouldn’t be doing; that’s a separate argument, guys. What we need to focus on is the probabilities going forward, and when we look into January of next year, this is a pretty clear picture: January 98%, March 99%. So we always want to make sure that, if nothing else, we’re getting out in front of these moves.
So right now, the Dollar has responded to the PMIs being slightly higher. Nothing significant here. The indicators in VP are very, very mixed. Our MA diff cross is still warning that this move higher is likely not sustainable here, so we want to make sure we understand that we have significant verified resistance up to 105.74. This is the area to keep an eye on. Now, in most cases, the trend from Friday continues into Monday, and then on Tuesday, we see things reverse. But always remember, we are moving towards month-end, where the Dollar is predominantly strong anyway, so I would be looking for a little bit more dollar strength. But if anything, it would probably be the week after next where we see that dollar strength. So again, our MA diff cross is down.
Now, some had asked about the short term, the T cross short. So what you can do in your software is bring in any one of these you want to bring in, but just remember that shorter-term indicators very often produce false signals. As you can see right here, the short-term T cross short, there’s a crossover that took place there. So again, what I would strongly advise is that if you’re using the T cross short, one of the best ways to use that is gauging when the market is out of fair value. The further the short-term T cross short moves away from our anchor point, our T cross long, the less likely the market is going to continue higher. So right now, our T cross short could extend a little bit higher, but again, that’s not always indicative of a stronger trend. Very often, it’s showing us the exact opposite. So again, we look for it to move out of fair value like it did back here in April, and then we look to play the MA diff cross. But again, if your short-term bets are on the Dollar or on the long side, I would not dispute that, but the medium and long-term bets are definitely short against the Dollar .
Gold
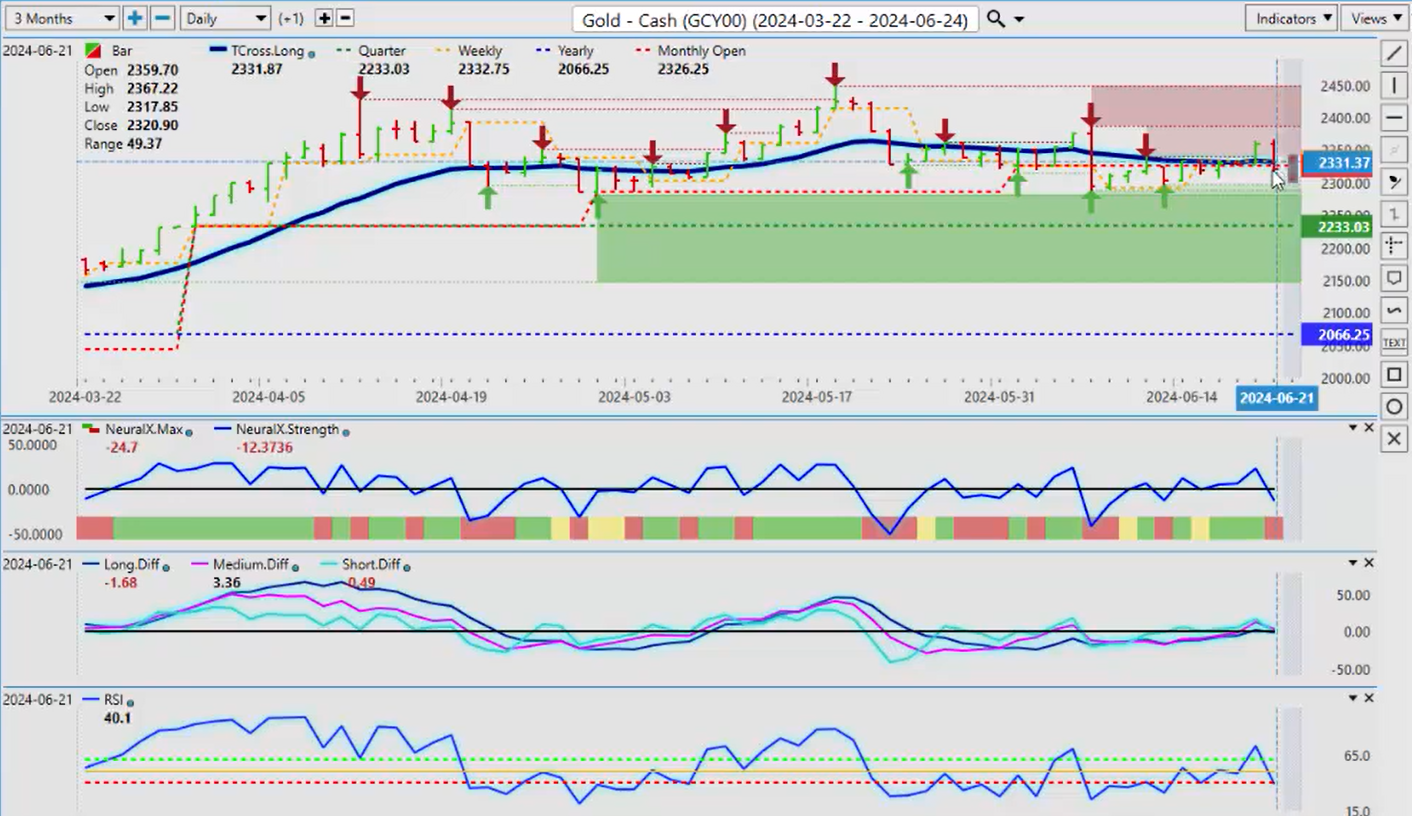
So when we do a comparative into our Gold contracts, once again, you can see that gold responded to that data, but that’s only one data set, guys. But again, I will stress the importance of adding fundamentals to your technical trading; it’s a must actually. So again, when we look at Gold , China’s not the big player here for buying gold. India is, and India’s been buying it up heavily, and I don’t believe they’re going to stop. So right now, the structural bias of this is 2066, but the area that I’ve been discussing over the last several months actually is the quarterly opening price, which is the important one, 2233, which I believe represents a very good buying opportunity if we can get down into those levels. Right now, the indicators in VP are sitting at a potential breakout point to the downside, but we need the predicted RSI moving below 40 to signal we have downside momentum. But either way, I believe Gold will be contained by 2233, and that would be a buying opportunity. Again, we just need confirmation in the indicators. So once again, if you want to manipulate the triple cross, then you can certainly do that by adding a shorter-term indicator here, but we want to use that in conjunction with the main tools here. So right now, you’ve got a lot of choppiness with that short-term T cross long here, and again, this is a weekly outlook, guys, not a daily. We do look at tools like this, and I would encourage anybody using the VP software to look at the live training room that’s on Monday, Wednesday, and Friday, where we get into short-term trading strategies. But that’s not what this presentation is; it’s a weekly outlook. That’s why we have the hard anchor point of the T cross long. That area now is 2355, but I believe that the data that came out this past week is only short-term data. We have Michigan confidence next week, I believe GDP, so there’s always data each week, but some data is very important, and some is not as important. So the PMIs have pushed Gold down a bit, but I don’t believe it will keep gold down for any length of time based on the fundamental that, again, from the Fed’s own words, rate cuts, there is no pathway to rate hikes. It’s higher for longer or cuts. That should keep Gold firm in the near term.
S&P 500 Index
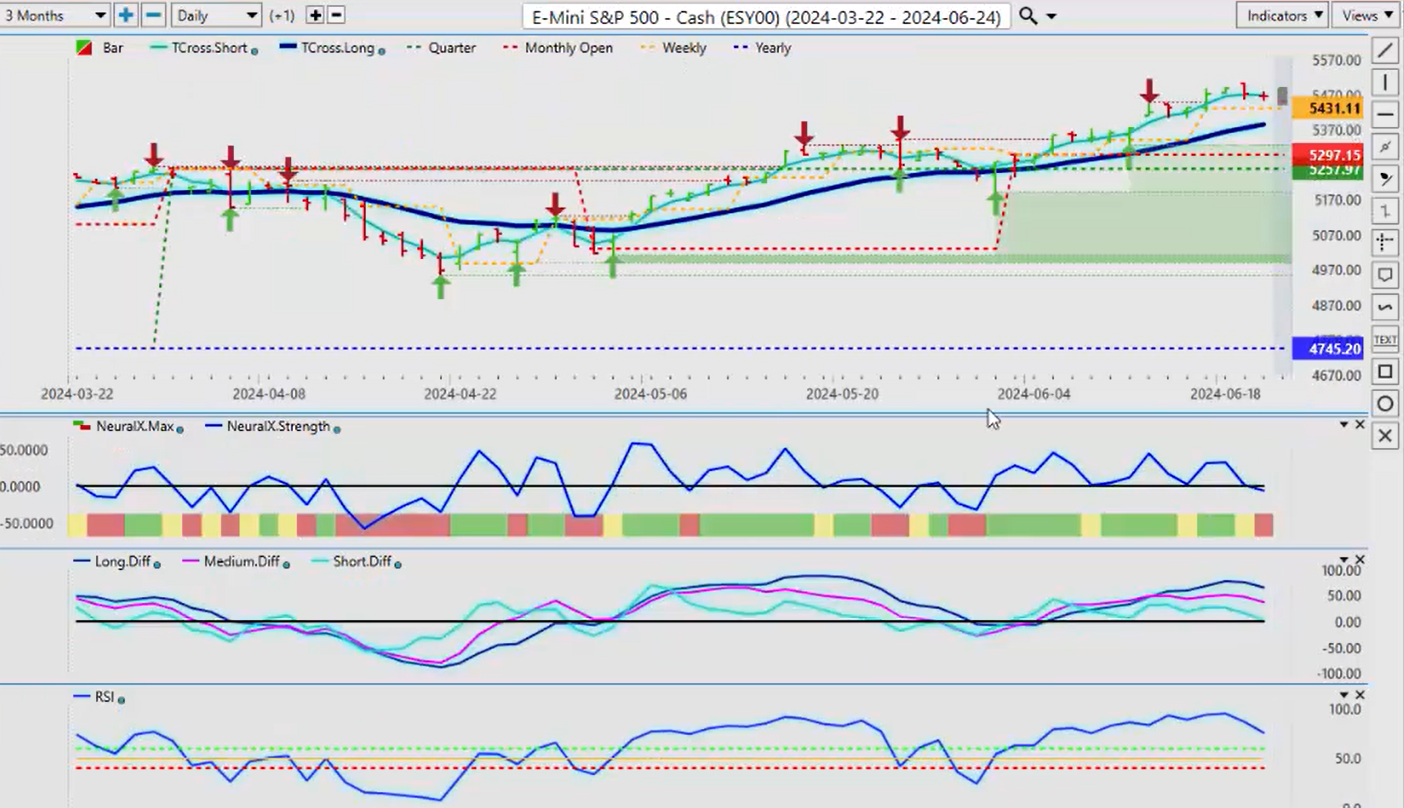
Now, when we look at the S&P 500 once again, a pretty strong week, but when we look at the T cross long as our anchor point, if I add in the short T cross occasionally, I can bring this in for you guys if you want to see it. That’s not a problem. So the short-term T cross long up here, there’s a gap between these two levels: 5467.50 and 5385. That’s a significant gap. The predicted high for next week is sitting at, again, 54.87, and the predicted low at 54.41. But from the predicted low down to the T cross long, there’s a gap in price that needs to be filled, a corrective gap. Now, we can also use our F8, and this is one of my favorites. You can see that this has been a very good entry point on a daily basis, right? So for the start of the week, we’ve got pretty strong support at 5454 and our predicted low at 5441. But remember, we’ve got a gap to fill down to that T cross long.
Now, when we look at the S&P 500 going into next week, once again, we’re holding in there, but again, not a lot of gains up here, but it is a very strong move for the week. So we can see the SPYs and the S&P 500 is basically the exact same trade here. So when we look at that all-important S&P 500 , we’re still pushing gains higher, making all new highs, 5505 last week on the cash side. But the indicators are starting to turn somewhat negative here. Now, again, we’re looking at a gap to be filled. The predicted low is rather high for Monday. And again, when we look at that, connecting the dots between these levels, that’s a bit of a problem here. I believe we need to allow this market or this gap to be filled somewhat. That gap would be down to 5385. That’s the level we would look for a corrective move and then reassess if we want to buy into that level.
In my respectful opinion, the Dollar cycle plays a big part in this, where the Dollar strengthens in the last few days of the month. So that’s not next week but the week after. So I believe stocks can do well next week but not the week after, and that’s because of dollar buying largely. But I also believe the S&P and your equity traders are digging their heels in, saying that cuts are coming and they’re staying long the stock market. So I wouldn’t recommend fighting this very powerful trend because, again, we want to look at the primary fundamental trend. We want to look at the intermarket correlations and the intermarket technicals to decide in our trade, not just one of those three. And the fundamental and technical trend on the S&P is strongly up, so we would remain long the S&P with that in mind.
DAX
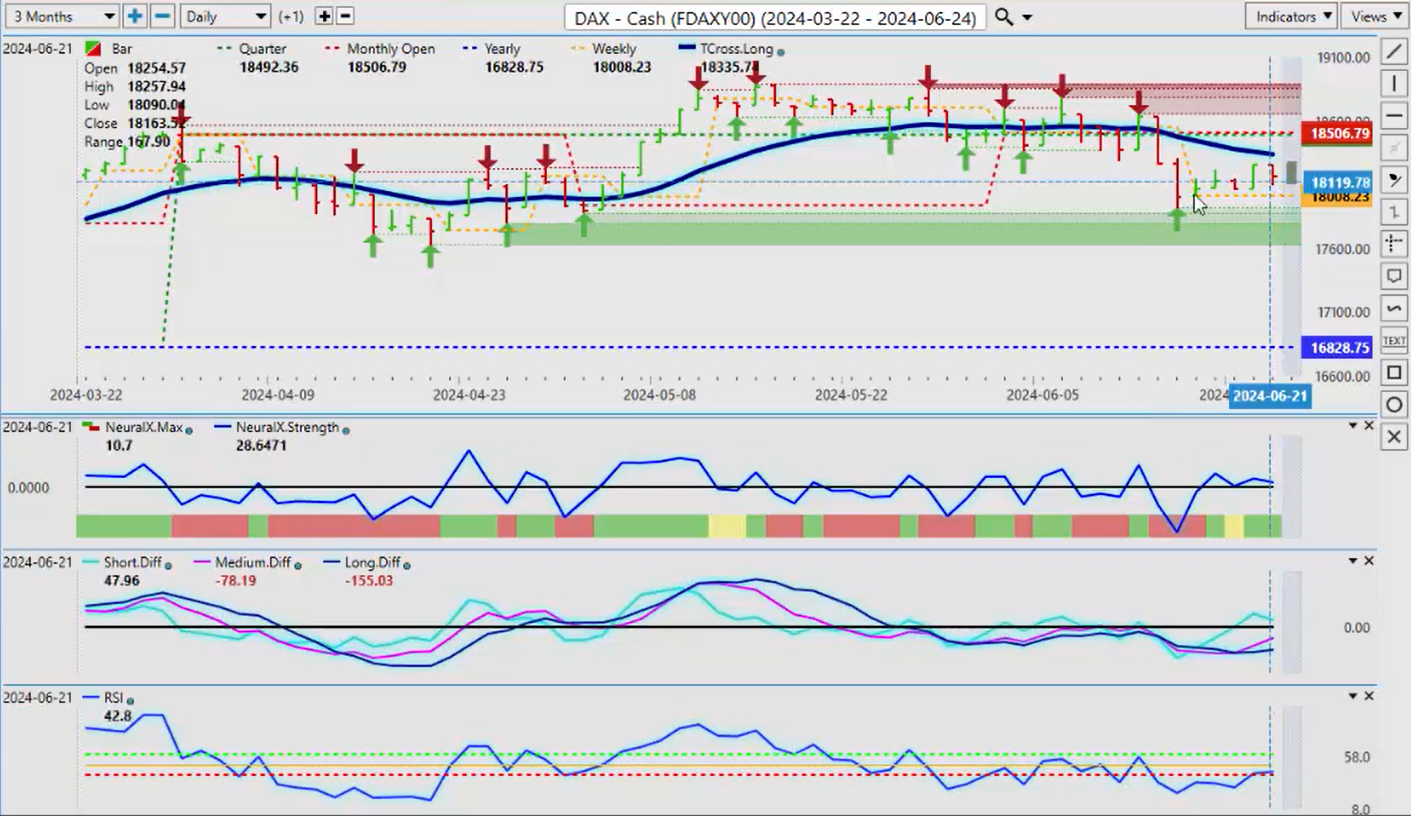
Now, our European equity markets again should be getting a bit of a boost here with that softer PMIs coming out of Europe. But once again, if we look down at the bottom here, we can see the DAX actually had a pretty good week, but we’re still negative, positive on the year but negative on the quarter and the month. So right now, our T cross long is used at 18,335. In order to buy this, we need to get above that. But I’ll discuss that further in a minute and how the Euro is affecting this.
Because in most cases, they’re either buying the Euro just like in the US, they’re buying stocks, or they’re buying the Dollar . In Europe, it’s not that much different; you’re either buying into the European equities or buying the Euro . In this particular case, I would argue that that’s getting a bit of a boost because of that Euro weakness and the Dollar strength. But for now, we have a clear reversal signal: the pink line over the blue line, the medium-term strength is weakening against the long-term strength, pointing that we’re at least going to move back up to the T cross long, and that’s 18335. We would need to get above that to confirm that we’re going to stay with the primary move up while above the current yearly opening price at 16828.
VIX
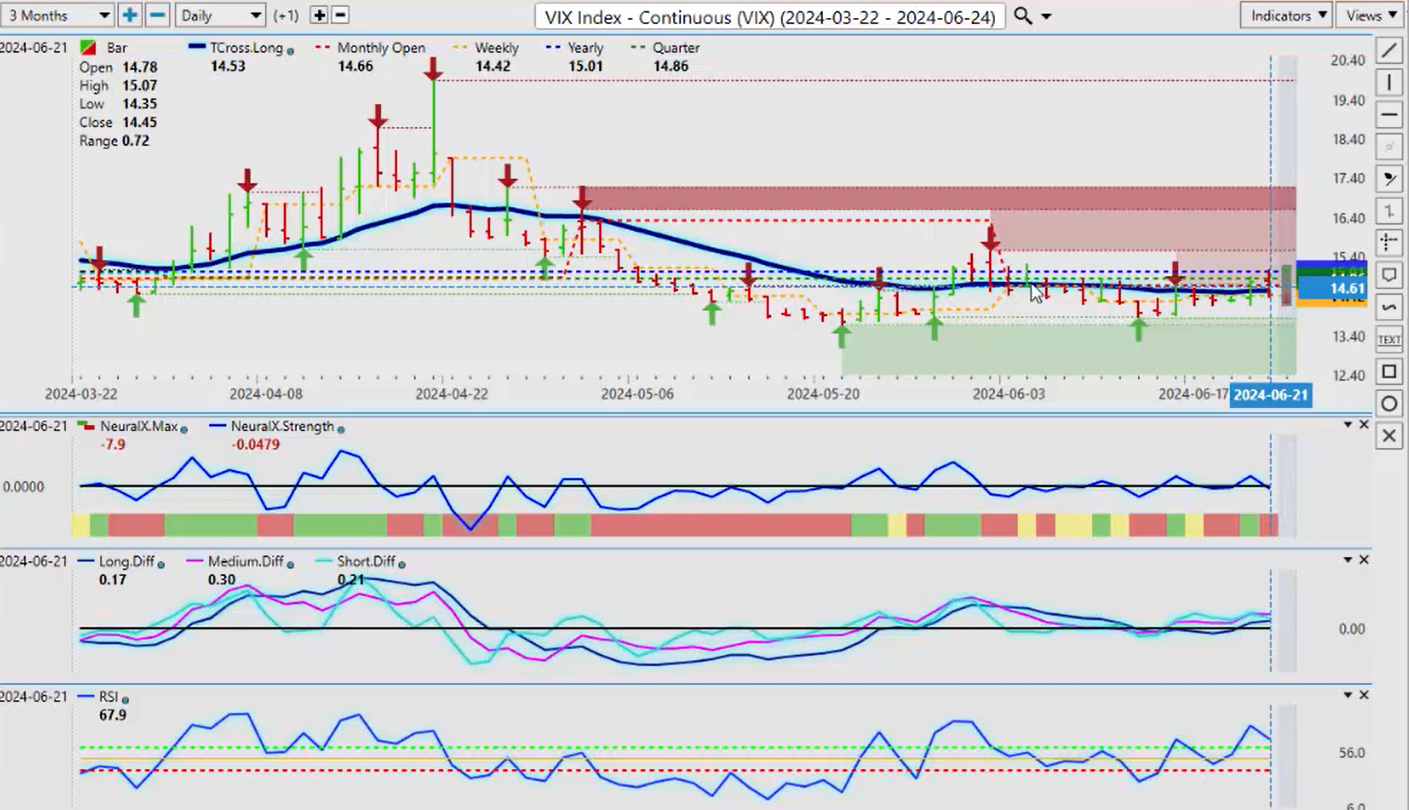
Now, the VIX is again being challenged on the current yearly opening price. It’s very important that we look at the VIX in our stock trading. Again, this is a broader market outlook, quickly covering all the major markets that are driving the underlying markets. If we’re buying stocks, we look for the S&P 500 to be higher. If we’re buying Gold , Gold stocks, or Gold miners, we look for Gold Futures up. If we’re buying Dollars , then we look for a stronger DXY . They’re all tied to the main futures contracts. So right now, the VIX continues to fail, and this is another great example of why the current yearly opening price, and not a rolling performance model, matters. We have the current yearly opening price to tell us the trend of the VIX . It’s still down, guys. Until we cross over the yearly opening at 15.01, the VIX remains bearish. I believe the VIX will rise when the Dollar strength kicks in towards the end of the month. That’s something we always like to be out in front of, not behind. That’s why we bring in the fundamentals of the Fed, the PMIs, and CPI, looking at broader data, not just one data set. So right now, there’s a slight upward bias for the VIX towards the end of the week.
Crude Oil
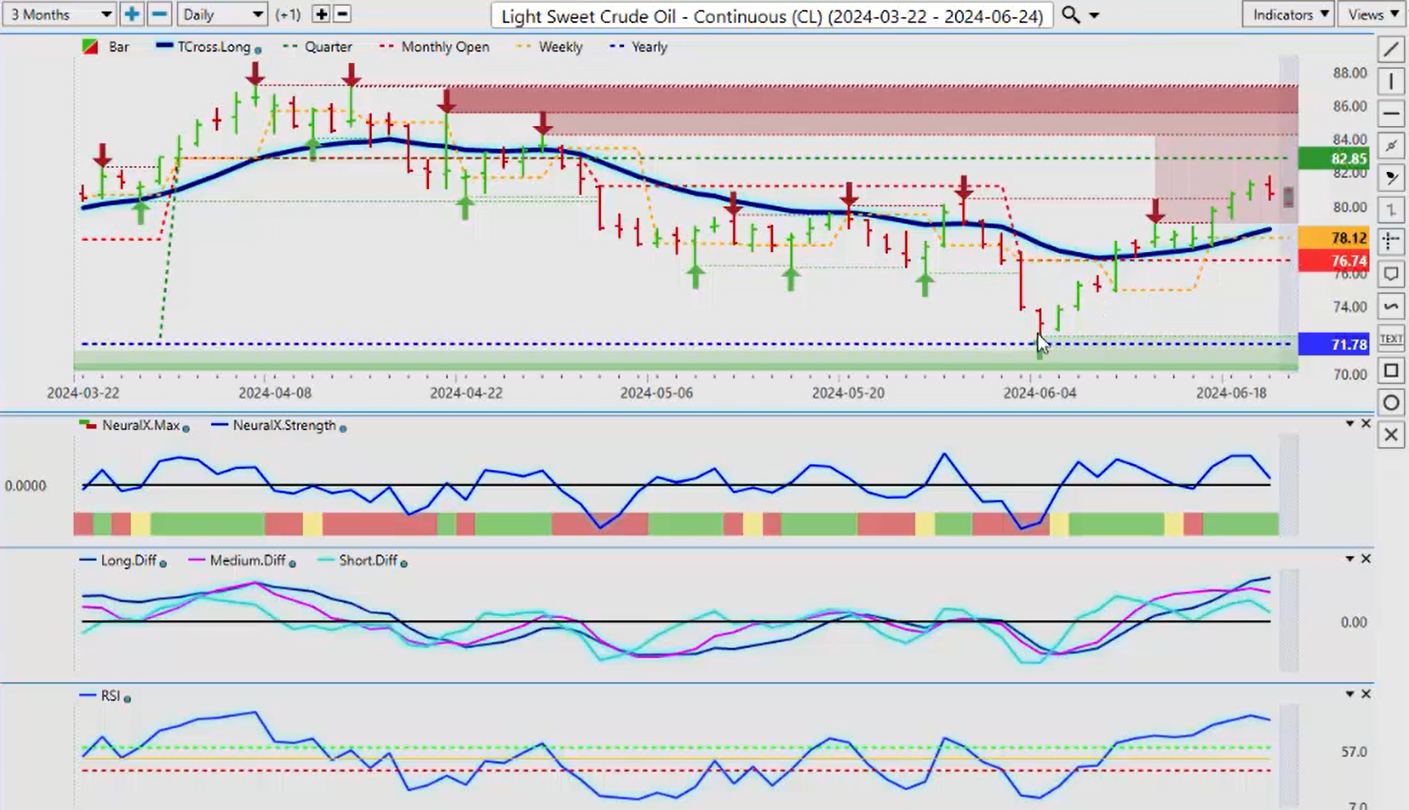
Now, when we look at light sweet Crude Oil , this trend continues to push higher. After what we’ve discussed with the current yearly opening price, we’ve crossed over the VP T cross long back on June 10th, and we’ve been moving higher. Now, we may have a bit of a problem as we’re approaching the current quarterly opening at 82.85. We have at least some corrective nature showing weakness in the software with that MA diff cross. You can see that our neural index is green, but the neural index strength is actually pointing down, suggesting maybe we’re going to take a little bit of a break in oil prices here. So if we do, our downside target level, our T cross long, will be 78.62. That’s the level we want to look for, guys, for a corrective move to potentially re-enter longs. But again, we’re firmly above the yearly opening price. We’ve had a test of the yearly opening price, which I pointed out several weeks ago as a buying opportunity. The same thing that put us into this trade short, guys, can be the same thing that takes us out of this trade, warning that we’re coming lower. Now, if you’re a longer-term oil trader, then I think staying in should be okay, but I want to get above 82.85. I still think it’s possible we can get to our $86 target by month-end.
Bitcoin
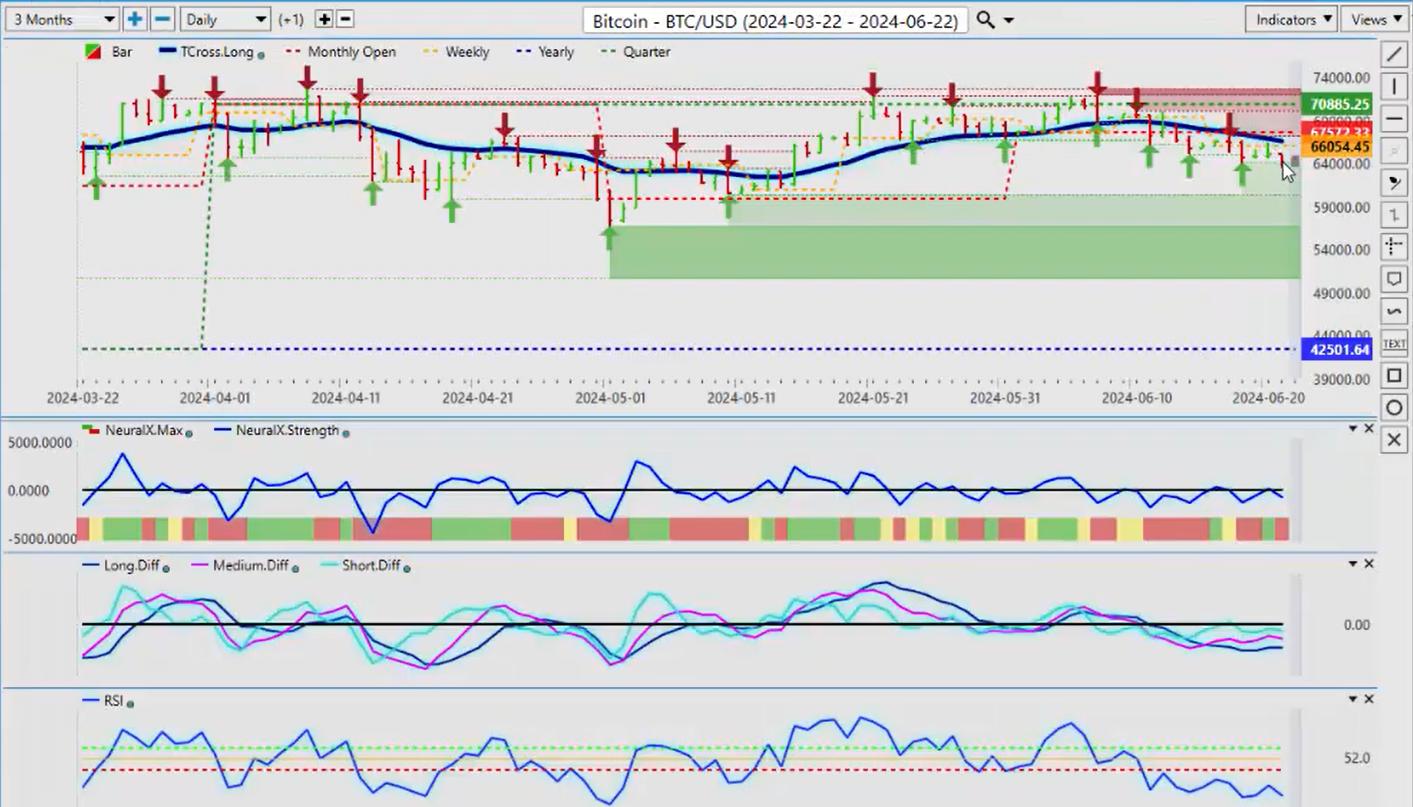
Now, with Bitcoin , Bitcoin is pulling back, remaining bearish from last week. Getting into summer trading is perfectly normal, but buying Bitcoin on a dip, the closer we get to mid-to-early October, is likely the next time we’re going to see a big breakout in Bitcoin . It occurs almost every year. So mid-September to early October, there’s a very clear seasonal pattern. So potentially a little bit soft between now and then, but again, the lowest verified zone we’ve got down here currently is about 60381. We’ll probably test that next week, and that’s the area I would keep a very close eye on. Our secondary support comes in at 56600. The software is warning that there isn’t a lot of downside here. We’ve got an MA diff cross that’s taking place, and the worst thing you could ever say about this indicator is it’s always early to the party, guys. So keep an eye on that if we see any odd pricing in Bitcoin . If you want to manipulate that a little bit, you can bring in the short T cross short. The further the T cross short moves away from the T cross long, the more likely a reversal is imminent.
Euro versus U.S. Dollar
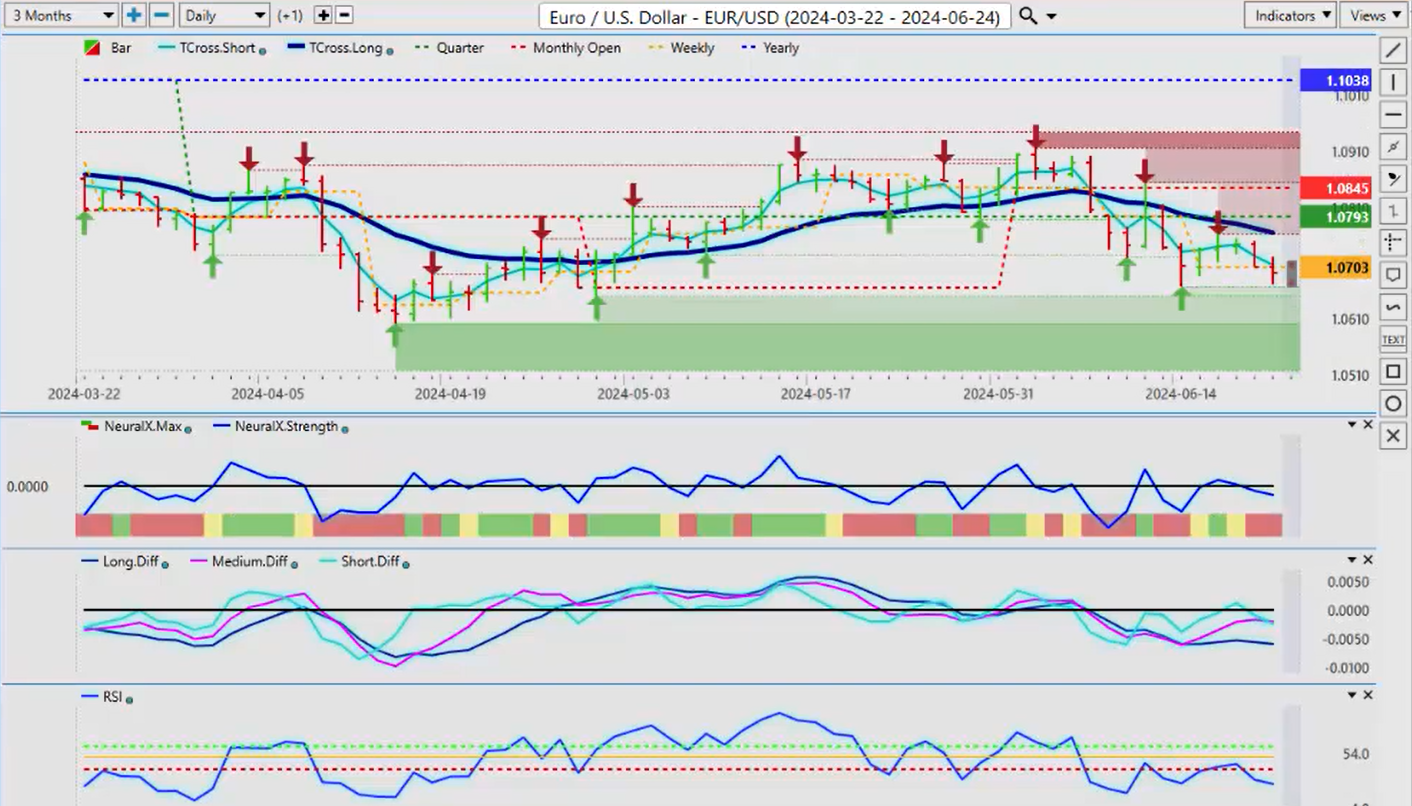
Now, when we look at some of our major FX pairs for next week, the Euro is always at the top of that list because of its high inverse correlation to the Dollar Index , about 98% actually. So right now, you can see that I’ve left that on here. The further that blue line moves away, which is our T cross short, the more likely a pending reversal is coming. We do have an MA diff cross to the upside, but the Euro is structurally weak, and I wouldn’t disagree. The PMIs last week didn’t help it much, that’s for sure, but ultimately what’s happening to these other currencies is going to happen to the Dollar sooner rather than later. It may not be till August or September, but the closer we get to September, I believe the US data will deteriorate, and that’s a fundamental that cannot be ignored. So again, we’ll monitor things right now, but we are coming into a strong verified support low down here at 106.50 and about 106.02. I believe this area is likely to hold, or maybe a slight breakdown below it and then it reverses higher. Be very cautious of a bear trap down here.
British Pound
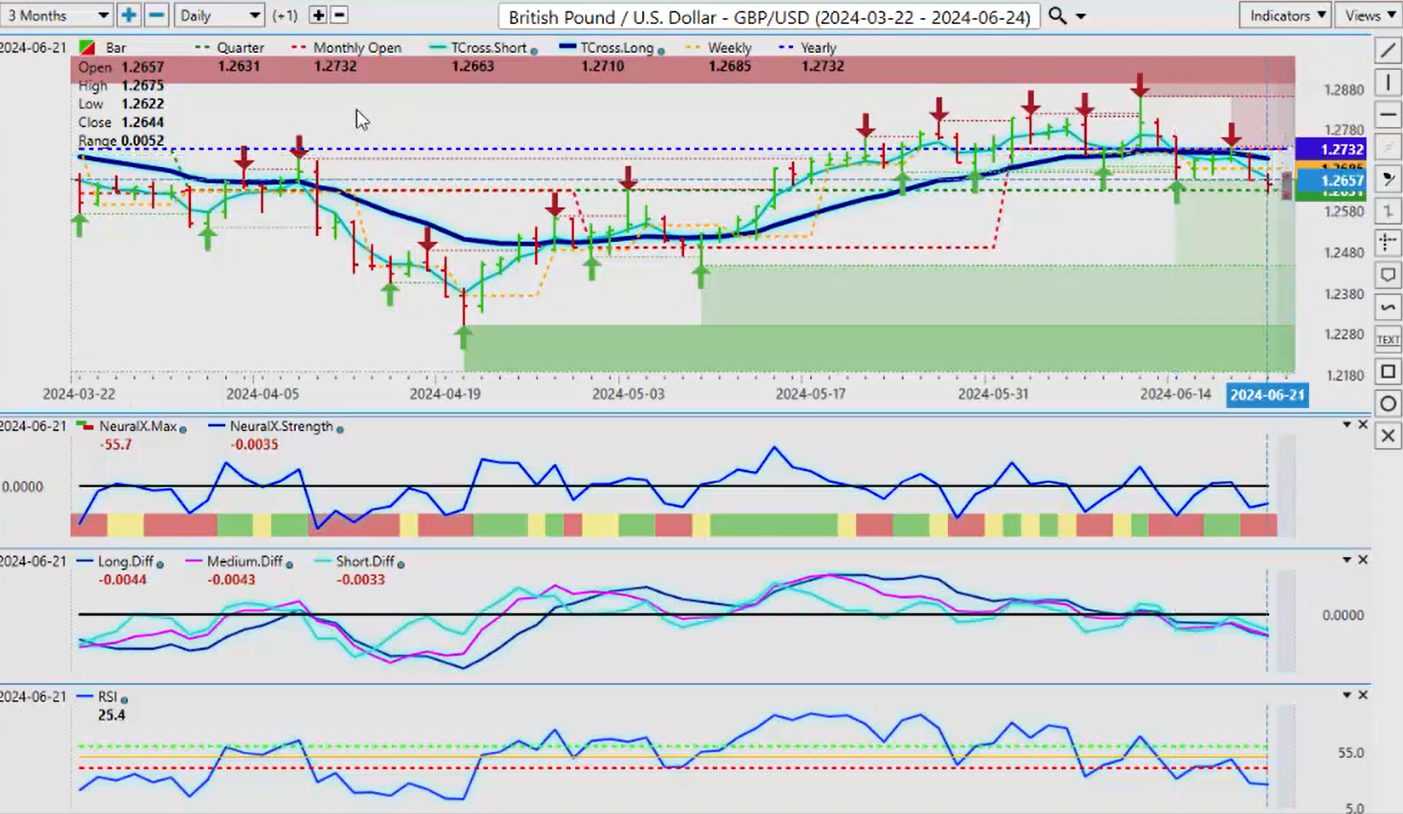
The same thing would apply to the British Pound . When we look at the British Pound for next week, again, we can see that we’ve got a bit of a problem. Once again, as we discussed in last week’s outlook, this yearly opening price is a stubborn area to break, but it’s broken to the downside again. But right now, our quarterly opening is coming in at 126.31 here, guys. Again, keep an eye on this particular level. We want to get back up above that quarterly opening to see if we can rechallenge the T cross long and the current yearly opening price. But 127.32 has proven to be very stiff resistance, a very tough level to hold for this pair. Ultimately, I believe we go higher, but that’s going to depend on the fundamental attached to that, which is interest rates from both the Bank of England and the Fed. But I believe the Fed and the Bank of England will both cut, guys, so you’ve got somewhat of a standoff between these central banks. We’ll see where this goes right now. Keep an eye on that for this week. The indicators are mixed, but they are pointing lower.
Swiss Franc
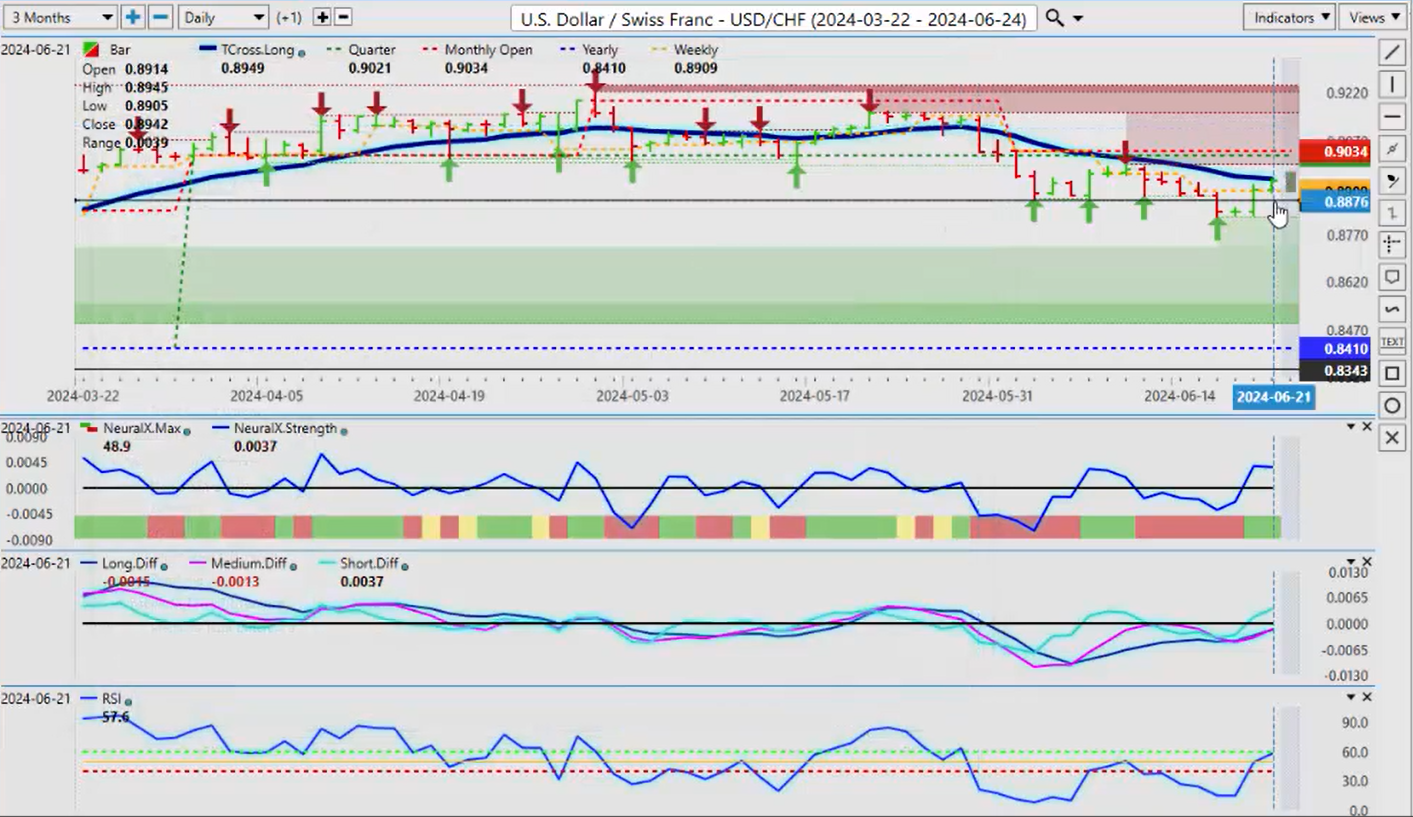
Now again, a surprise from the Swiss National Bank this past week, they’ve cut again, and the Fed is still yet to cut. This is why we discussed this, guys, so everyone understands that there are interest rate cuts and hikes going on in other countries and how it’s going to affect the US. The Swiss, even though they were the first to cut here, the currency remains very strong against the US Dollar . Once again, when we look at this, there’s many different ways we can manipulate this, but my view here is that when they cut, it’s a short-term move. We can see that that’s what’s happened here. It’s reversed back to our T cross long at 89.49. We would look for that area to potentially break and would open up the door to potentially up into this 90.21 level, 90.34, but then we have to get above our current monthly opening price. So even with a secondary cut from the Swiss National Bank, the currency remains very strong. We’ll watch these levels; the indicators suggest we’re going higher, but we want that predicted RSI above 60 to show that we’ve got upward momentum, and I don’t believe we do. If we do, it’s short-term as we gear up for additional cuts, but once again, we need to clear that level.
U.S. Dollar versus Japanese Yen
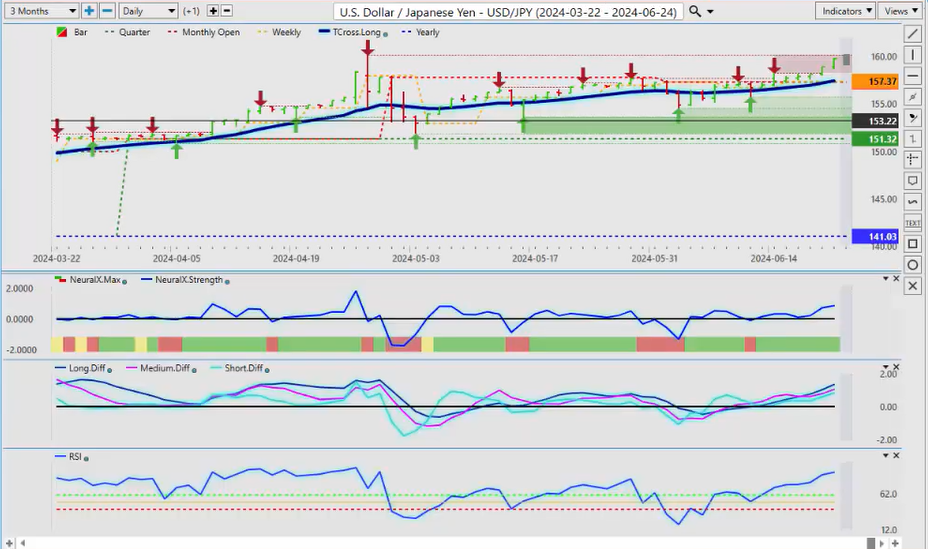
Now, when we look at the Dollar/Yen , the broader market remains heavily on guard for intervention here. Fundamentals matter, guys. It’s not just about levels and technicals. The underlying fundamental here is the Bank of Japan. If they intervene, it will be on a Sunday night for sure. It could be as early as this Sunday night, but that high at 16017 we are approaching yet again. I have never seen this pair at this level, and the central banks did it to themselves when they intervened prior to the Fed starting its rate hike cycle. Big mistake. We will see how this one plays out, but I would be very cautious of both a bull and a bear trap on this particular pair because this is 100% now a fundamental trade. If this carry trade starts to come unwound, it will come unwound very, very quickly. Caution is what I can advise.
U.S. Dollar versus Canadian Dollar
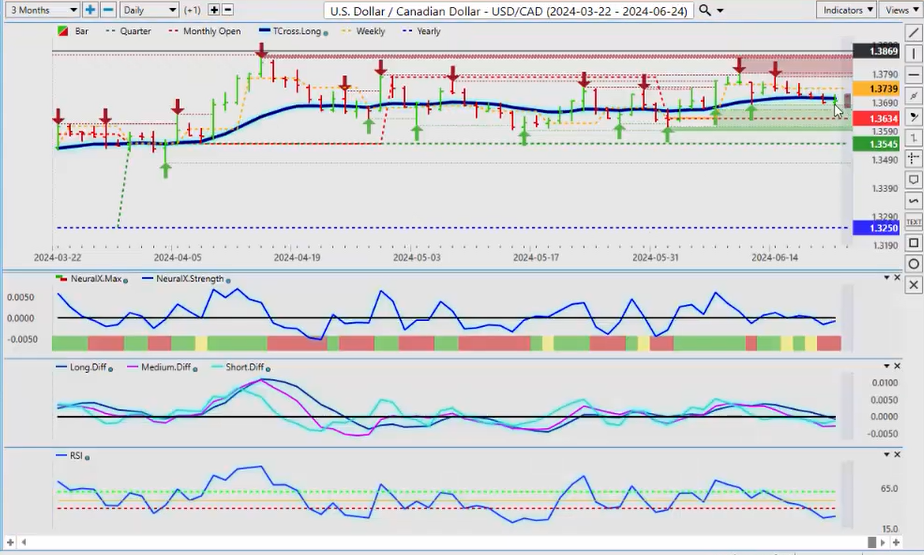
Now, the US/Canadian pair, again, the Canadian Dollar responding to both higher oil prices and strong global stock markets. If we think the direct market correlation here is if there’s going to be a corrective move lower on oil, that would mean US/Canada could go higher. The Bank of Canada has made it very clear with lots of cuts coming; that’s what they said. It’s nice to see that rationale because they should have cut a long time ago. Right now, we’ve got support down here at
136.34, and on the monthly and quarterly at 135.45, this area potentially could be a buying opportunity, a short-term buying opportunity. Structurally, if we’re talking fundamentals and interest rates, nothing has changed in Canada, but this is the power of intermarket correlations: stronger equity, stronger oil prices that support the Canadian economy, and a bank that’s openly stated they’re going to be cutting numerous times going forward, which should weaken that currency. We’ll monitor this right now, but be careful down here because the indicators, again, if you look at the neural index strength, it’s actually turning back up, not down. Be cautious of a bear trap down here.
Australian Dollar versus U.S. Dollar
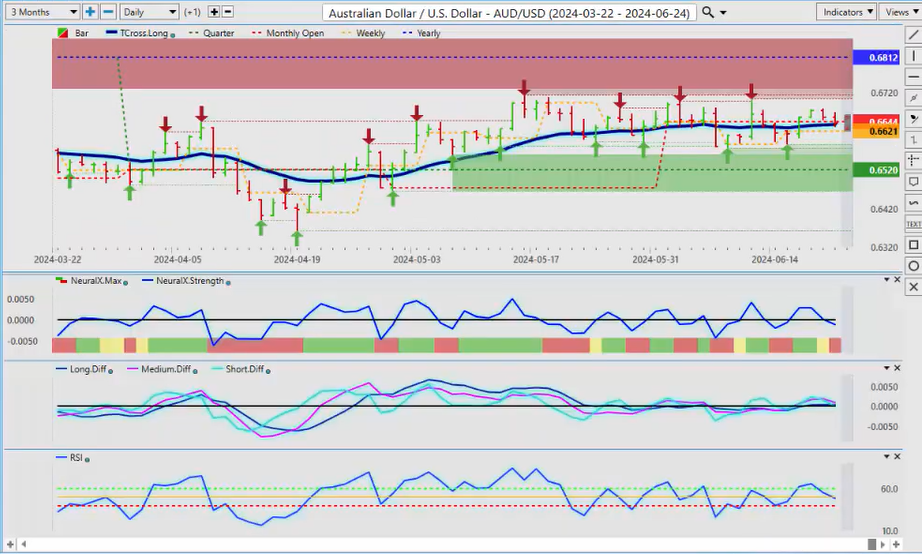
Ultimately, with the Aussie and the Kiwi , I believe both currencies will rise going into the third and definitely the fourth quarter of this year. For now, the Aussie is putting up a pretty epic battle, but you can see the way my charts are set up: my quarterly opening at 6520, my yearly opening price at 6820. We are sitting smack in the middle of this. The closer we get to 6520, the more attractive longs are going to be here, guys, because regardless of all the indicators and everything that’s discussed, we have held above the quarterly opening price on this pair the entire time. That actually is bullish, not bearish. I do anticipate a bit of a stop-loss hunt. I would look for longs potentially down between 6585 and 6520. I believe to be reasonable, but the indicators are saying in VP that we are going lower.
New Zealand Dollar versus U.S. Dollar
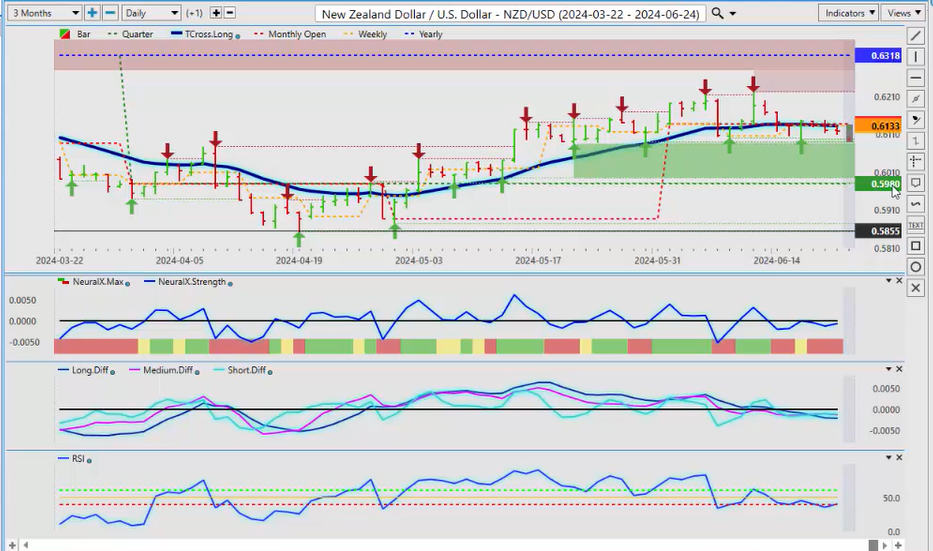
The same thing is almost identical in the Kiwi . We’re trapped between 5980 and 6318. This is a bit of a dangerous area for either longs or shorts. I want to show this in these videos so you can see that this looks very similar to a median grid. A median grid is the high plus the low divided by two. When we look at this right now, it has an immediate bearish tone to it, but looking forward, not backward, because this is an outlook, not a recap of something that’s already happened, guys. We look for this area down here for potential longs as the data starts to back the Fed into a corner where it’s going to have to concede on these cuts. If we do end up getting a cut in September, from what I’ve seen from the Fed’s balance sheet and the Fed members, they’re pricing in two cuts this year, and I would actually be in agreement with that and maybe even three. Either way, 2025 is all about rate cuts. I believe the market, the closer we get to the fiscal year end of the US, which will be the end of September, then the Dollar is really going to struggle into the US fiscal first quarter between October 1 and mid-January.
With that said, this is the VantagePoint AI Market Outlook for the week of June 24, 2024.